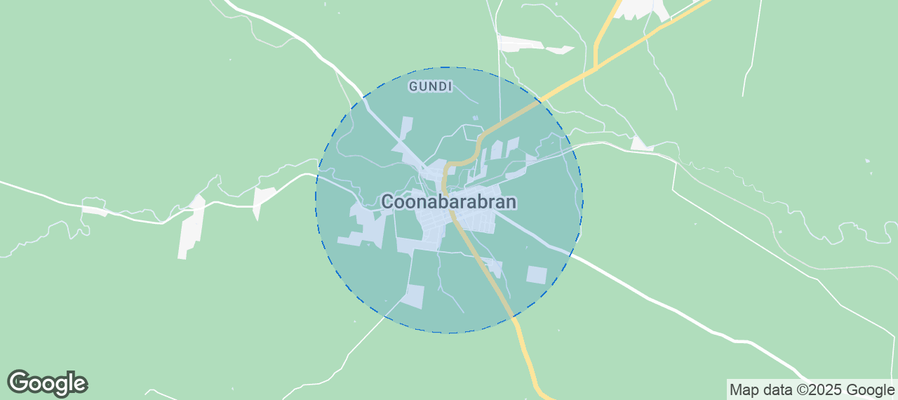
Coonabarabran Airbnb Market Analysis 2025: Short Term Rental Data & Vacation Rental Statistics in New South Wales, Australia
Is Airbnb profitable in Coonabarabran in 2025? Explore comprehensive Airbnb analytics for Coonabarabran, New South Wales, Australia to uncover income potential. This 2025 STR market report for Coonabarabran, based on AirROI data from October 2024 to September 2025, reveals key trends in the niche market of 17 active listings.
Whether you're considering an Airbnb investment in Coonabarabran, optimizing your existing vacation rental, or exploring rental arbitrage opportunities, understanding the Coonabarabran Airbnb data is crucial. Navigating the high regulation landscape is key to maximizing your short term rental income potential. Let's dive into the specifics.
Key Coonabarabran Airbnb Performance Metrics Overview
Monthly Airbnb Revenue Variations & Income Potential in Coonabarabran (2025)
Understanding the monthly revenue variations for Airbnb listings in Coonabarabran is key to maximizing your short term rental income potential. Seasonality significantly impacts earnings. Our analysis, based on data from the past 12 months, shows that the peak revenue month for STRs in Coonabarabran is typically October, while February often presents the lowest earnings, highlighting opportunities for strategic pricing adjustments during shoulder and low seasons. Explore the typical Airbnb income in Coonabarabran across different performance tiers:
- Best-in-class properties (Top 10%) achieve $3,688+ monthly, often utilizing dynamic pricing and superior guest experiences.
- Strong performing properties (Top 25%) earn $2,908 or more, indicating effective management and desirable locations/amenities.
- Typical properties (Median) generate around $1,913 per month, representing the average market performance.
- Entry-level properties (Bottom 25%) see earnings around $959, often with potential for optimization.
Average Monthly Airbnb Earnings Trend in Coonabarabran
Coonabarabran Airbnb Occupancy Rate Trends (2025)
Maximize your bookings by understanding the Coonabarabran STR occupancy trends. Seasonal demand shifts significantly influence how often properties are booked. Typically, Aprilsees the highest demand (peak season occupancy), while February experiences the lowest (low season). Effective strategies, like adjusting minimum stays or offering promotions, can boost occupancy during slower periods. Here's how different property tiers perform in Coonabarabran:
- Best-in-class properties (Top 10%) achieve 80%+ occupancy, indicating high desirability and potentially optimized availability.
- Strong performing properties (Top 25%) maintain 64% or higher occupancy, suggesting good market fit and guest satisfaction.
- Typical properties (Median) have an occupancy rate around 44%.
- Entry-level properties (Bottom 25%) average 30% occupancy, potentially facing higher vacancy.
Average Monthly Occupancy Rate Trend in Coonabarabran
Average Daily Rate (ADR) Airbnb Trends in Coonabarabran (2025)
Effective short term rental pricing strategy in Coonabarabran involves understanding monthly ADR fluctuations. The Average Daily Rate (ADR) for Airbnb in Coonabarabran typically peaks in January and dips lowest during May. Leveraging Airbnb dynamic pricing tools or strategies based on this seasonality can significantly boost revenue. Here's a look at the typical nightly rates achieved:
- Best-in-class properties (Top 10%) command rates of $209+ per night, often due to premium features or locations.
- Strong performing properties (Top 25%) achieve nightly rates of $158 or more.
- Typical properties (Median) charge around $127 per night.
- Entry-level properties (Bottom 25%) earn around $108 per night.
Average Daily Rate (ADR) Trend by Month in Coonabarabran
Get Live Coonabarabran Market Intelligence 👇
Explore Real-time Analytics
Airbnb Seasonality Analysis & Trends in Coonabarabran (2025)
Peak Season (October, December, April)
- Revenue averages $2,553 per month
- Occupancy rates average 59.0%
- Daily rates average $150
Shoulder Season
- Revenue averages $2,090 per month
- Occupancy maintains around 47.1%
- Daily rates hold near $141
Low Season (January, February, March)
- Revenue drops to average $1,455 per month
- Occupancy decreases to average 34.6%
- Daily rates adjust to average $149
Seasonality Insights for Coonabarabran
- The Airbnb seasonality in Coonabarabran shows moderate seasonality with distinct peak and low periods. While the sections above show seasonal averages, it's also insightful to look at the extremes:
- During the high season, the absolute peak month showcases Coonabarabran's highest earning potential, with monthly revenues capable of climbing to $2,577, occupancy reaching a high of 61.8%, and ADRs peaking at $153.
- Conversely, the slowest single month of the year, typically falling within the low season, marks the market's lowest point. In this month, revenue might dip to $1,157, occupancy could drop to 31.0%, and ADRs may adjust down to $132.
- Understanding both the seasonal averages and these monthly peaks and troughs in revenue, occupancy, and ADR is crucial for maximizing your Airbnb profit potential in Coonabarabran.
Seasonal Strategies for Maximizing Profit
- Peak Season: Maximize revenue through premium pricing and potentially longer minimum stays. Ensure high availability.
- Low Season: Offer competitive pricing, special promotions (e.g., extended stay discounts), and flexible cancellation policies. Target off-season travelers like remote workers or budget-conscious guests.
- Shoulder Seasons: Implement dynamic pricing that balances peak and low rates. Target weekend travelers or specific events. Offer slightly more flexible terms than peak season.
- Regularly analyze your own performance against these Coonabarabran seasonality benchmarks and adjust your pricing and availability strategy accordingly.
Best Areas for Airbnb Investment in Coonabarabran (2025)
Exploring the top neighborhoods for short-term rentals in Coonabarabran? This section highlights key areas, outlining why they are attractive for hosts and guests, along with notable local attractions. Consider these locations based on your target guest profile and investment strategy.
| Neighborhood / Area | Why Host Here? (Target Guests & Appeal) | Key Attractions & Landmarks |
|---|---|---|
| Coonabarabran Town Centre | The heart of Coonabarabran, offering a mix of shops, cafes, and local attractions. It's ideal for travelers seeking convenience and access to local amenities. | Coonabarabran Visitor Information Centre, Siding Spring Observatory, Warrumbungle National Park, Coonabarabran Heritage Museum, Stargazing opportunities |
| Warrumbungle National Park | A stunning national park just outside of town, known for its natural beauty and outdoor activities. Perfect for nature lovers and adventurers looking for a peaceful retreat. | Milroy Observatory, Walking trails, Wildlife viewing, Camping sites, Star-gazing areas |
| Brewarrina | A nearby town known for its historical significance and surrounding natural beauty. It attracts tourists interested in cultural experiences and exploring rural New South Wales. | Brewarrina Aboriginal Fish Traps, Local arts and crafts shops, Heritage walks, Nature reserves |
| Pilliga Forest | A vast forest area known for its serene environment and birdwatching opportunities. Attracts nature enthusiasts and those looking for a quiet getaway. | Pilliga Nature Reserve, Birdwatching spots, Walking trails, Picnic areas |
| The Dandry Gorge | A scenic gorge that offers beautiful views and hiking opportunities. Ideal for outdoor enthusiasts and those looking to explore the natural landscape of the region. | Dandry Gorge lookout, Hiking trails, Picnic spots, Photography opportunities |
| Garrangara National Park | A lesser-known national park with unique landscapes. It attracts visitors who want to escape the urban environment and enjoy some tranquility. | Walking tracks, Picnic areas, Wildlife viewing |
| Binnaway | A small town near Coonabarabran known for its rural charm and local community. Great for travelers looking for an authentic Australian town experience. | Local markets, Historical sites, Community events |
| Coolah Tops National Park | A park with breathtaking views and diverse wildlife. Attracts visitors seeking adventure and scenic beauty within close proximity to Coonabarabran. | Lookouts, Hiking trails, Wildflower viewing, Camping grounds |
Understanding Airbnb License Requirements & STR Laws in Coonabarabran (2025)
Yes, Coonabarabran, New South Wales, Australia enforces high STR regulations. Obtaining a license and ensuring compliance is almost certainly required according to current 2025 STR laws. Always verify the latest short term rental regulations and Airbnb license requirements directly with local government authorities for Coonabarabran to ensure full compliance before hosting.
(Source: AirROI data, 2025, based on 71% licensed listings)
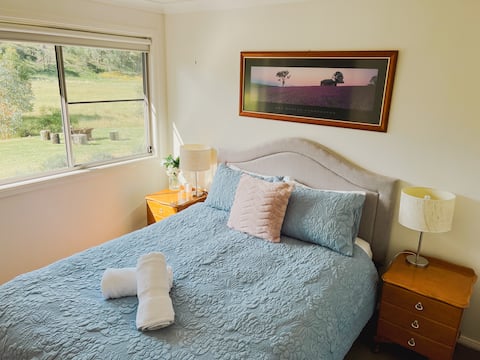
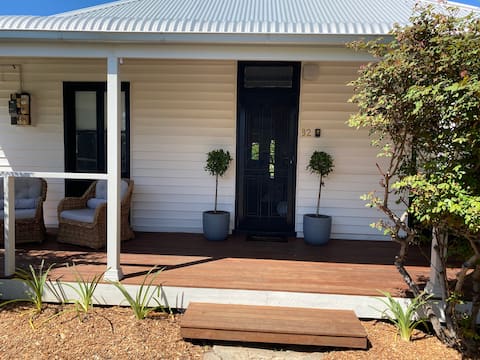
Top Performing Airbnb Properties in Coonabarabran (2025)
Benchmark your potential! Explore examples of top-performing Airbnb properties in Coonabarabranbased on Trailing Twelve Month (TTM) revenue. Analyze their characteristics, revenue, occupancy rate, and ADR to understand what drives success in this market.
Mirrabook Cottage Coonabarabran
Entire Place • 2 bedrooms

Argyle Cottage
Entire Place • 3 bedrooms
Dark Skies Cottage
Entire Place • 3 bedrooms

Skywatch Observatory Domestays
Private Room • 2 bedrooms

Spacious House in the Town
Entire Place • 3 bedrooms

100 acre Beautiful property close to Coonabarabran
Entire Place • 4 bedrooms
Note: Performance varies based on location, size, amenities, seasonality, and management quality. Data reflects the past 12 months.
Top Performing Airbnb Hosts in Coonabarabran (2025)
Learn from the best! This table showcases top-performing Airbnb hosts in Coonabarabran based on the number of properties managed and estimated total revenue over the past year. Analyze their scale and performance metrics.
| Host Name | Properties | Grossing Revenue | Stay Reviews | Avg Rating |
|---|---|---|---|---|
| Kelly | 1 | $43,865 | 163 | 4.98/5.0 |
| Lyn | 1 | $38,105 | 318 | 4.93/5.0 |
| Vanessa | 1 | $36,561 | 388 | 4.95/5.0 |
| Gary | 1 | $34,471 | 544 | 4.90/5.0 |
| Samantha | 1 | $30,221 | 48 | 4.75/5.0 |
| Atif | 1 | $29,587 | 50 | 4.86/5.0 |
| Peter | 1 | $25,758 | 43 | 4.81/5.0 |
| Grace | 3 | $19,850 | 252 | 4.85/5.0 |
| Tiny Away | 1 | $19,044 | 16 | 4.56/5.0 |
| Vicky | 1 | $18,536 | 93 | 4.74/5.0 |
Analyzing the strategies of top hosts, such as their property selection, pricing, and guest communication, can offer valuable lessons for optimizing your own Airbnb operations in Coonabarabran.
Dive Deeper: Advanced Coonabarabran STR Market Data (2025)
Ready to unlock more insights? AirROI provides access to advanced metrics and comprehensive Airbnb data for Coonabarabran. Explore detailed analytics beyond this report to refine your investment strategy, optimize pricing, and maximize your vacation rental profits.
Explore Advanced MetricsCoonabarabran Short-Term Rental Market Composition (2025): Property & Room Types
Room Type Distribution
Property Type Distribution
Market Composition Insights for Coonabarabran
- The Coonabarabran Airbnb market composition is heavily skewed towards Entire Home/Apt listings, which make up 76.5% of the 17 active rentals. This indicates strong guest preference for privacy and space.
- Looking at the property type distribution in Coonabarabran, House properties are the most common (64.7%), reflecting the local real estate landscape.
- Houses represent a significant 64.7% portion, catering likely to families or larger groups.
- The presence of 11.8% Hotel/Boutique listings indicates integration with traditional hospitality.
Coonabarabran Airbnb Room Capacity Analysis (2025): Bedroom Distribution
Distribution of Listings by Number of Bedrooms
Room Capacity Insights for Coonabarabran
- The dominant room capacity in Coonabarabran is 3 bedrooms listings, making up 29.4% of the market. This suggests a strong demand for properties suitable for families or small groups.
- Together, 3 bedrooms and 1 bedroom properties represent 52.9% of the active Airbnb listings in Coonabarabran, indicating a high concentration in these sizes.
- A significant 41.2% of listings offer 3+ bedrooms, catering to larger groups and families seeking more space in Coonabarabran.
Coonabarabran Vacation Rental Guest Capacity Trends (2025)
Distribution of Listings by Guest Capacity
Guest Capacity Insights for Coonabarabran
- The most common guest capacity trend in Coonabarabran vacation rentals is listings accommodating 5 guests (23.5%). This suggests the primary traveler segment is likely larger groups.
- Properties designed for 5 guests and 2 guests dominate the Coonabarabran STR market, accounting for 41.1% of listings.
- 29.4% of properties accommodate 6+ guests, serving the market segment for larger families or group travel in Coonabarabran.
- On average, properties in Coonabarabran are equipped to host 3.8 guests.
Coonabarabran Airbnb Booking Patterns (2025): Available vs. Booked Days
Available Days Distribution
Booked Days Distribution
Booking Pattern Insights for Coonabarabran
- The most common availability pattern in Coonabarabran falls within the 181-270 days range, representing 41.2% of listings. This suggests many properties have significant open periods on their calendars.
- Approximately 70.6% of listings show high availability (181+ days open annually), indicating potential for increased bookings or specific owner usage patterns.
- For booked days, the 91-180 days range is most frequent in Coonabarabran (41.2%), reflecting common guest stay durations or potential owner blocking patterns.
- A notable 29.4% of properties secure long booking periods (181+ days booked per year), highlighting successful long-term rental strategies or significant owner usage.
Coonabarabran Airbnb Minimum Stay Requirements Analysis
Distribution of Listings by Minimum Night Requirement
1 Night
5 listings
33.3% of total
2 Nights
7 listings
46.7% of total
4-6 Nights
1 listings
6.7% of total
30+ Nights
2 listings
13.3% of total
Key Insights
- The most prevalent minimum stay requirement in Coonabarabran is 2 Nights, adopted by 46.7% of listings. This highlights the market's preference for shorter, flexible bookings.
- A strong majority (80.0%) of the Coonabarabran Airbnb data shows acceptance of very short stays (1-2 nights), indicating a dynamic, high-turnover market.
- A significant segment (13.3%) caters to monthly stays (30+ nights) in Coonabarabran, pointing to opportunities in the extended-stay market.
Recommendations
- Align with the market by considering a 2 Nights minimum stay, as 46.7% of Coonabarabran hosts use this setting.
- Explore offering discounts for stays of 30+ nights to attract the 13.3% of the market seeking extended stays.
- Adjust minimum nights based on seasonality – potentially shorter during low season and longer during peak demand periods in Coonabarabran.
Coonabarabran Airbnb Cancellation Policy Trends Analysis (2025)
Flexible
5 listings
29.4% of total
Moderate
8 listings
47.1% of total
Firm
2 listings
11.8% of total
Strict
2 listings
11.8% of total
Cancellation Policy Insights for Coonabarabran
- The prevailing Airbnb cancellation policy trend in Coonabarabran is Moderate, used by 47.1% of listings.
- The market strongly favors guest-friendly terms, with 76.5% of listings offering Flexible or Moderate policies. This suggests guests in Coonabarabran may expect booking flexibility.
Recommendations for Hosts
- Consider adopting a Moderate policy to align with the 47.1% market standard in Coonabarabran.
- Using a Strict policy might deter some guests, as only 11.8% of listings use it. Evaluate if potential revenue protection outweighs possible lower booking rates.
- Regularly review your cancellation policy against competitors and market demand shifts in Coonabarabran.
Coonabarabran STR Booking Lead Time Analysis (2025)
Average Booking Lead Time by Month
Booking Lead Time Insights for Coonabarabran
- The overall average booking lead time for vacation rentals in Coonabarabran is 55 days.
- Guests book furthest in advance for stays during May (average 76 days), likely coinciding with peak travel demand or local events.
- The shortest booking windows occur for stays in February (average 19 days), indicating more last-minute travel plans during this time.
- Seasonally, Spring (53 days avg.) sees the longest lead times, while Winter (26 days avg.) has the shortest, reflecting typical travel planning cycles.
Recommendations for Hosts
- Use the overall average lead time (55 days) as a baseline for your pricing and availability strategy in Coonabarabran.
- For May stays, consider implementing length-of-stay discounts or slightly higher rates for bookings made less than 76 days out to capitalize on advance planning.
- Target marketing efforts for the Spring season well in advance (at least 53 days) to capture early planners.
- Monitor your own booking lead times against these Coonabarabran averages to identify opportunities for dynamic pricing adjustments.
Popular & Essential Airbnb Amenities in Coonabarabran (2025)
Amenity Prevalence
Amenity Insights for Coonabarabran
- Essential amenities in Coonabarabran that guests expect include: Essentials, Kitchen. Lacking these (any) could significantly impact bookings.
- Popular amenities like Air conditioning, Heating, TV are common but not universal. Offering these can provide a competitive edge.
- Warning: Wifi is not universally provided but is considered essential globally. Ensure reliable Wifi is offered.
Recommendations for Hosts
- Ensure your listing includes all essential amenities for Coonabarabran: Essentials, Kitchen.
- Consider adding popular differentiators like Air conditioning or Heating to increase appeal.
- Highlight unique or less common amenities you offer (e.g., hot tub, dedicated workspace, EV charger) in your listing description and photos.
- Regularly check competitor amenities in Coonabarabran to stay competitive.
Coonabarabran Airbnb Guest Demographics & Profile Analysis (2025)
Guest Profile Summary for Coonabarabran
- The typical guest profile for Airbnb in Coonabarabran consists of primarily domestic travelers (89%), often arriving from nearby Sydney, typically belonging to the Post-2000s (Gen Z/Alpha) group (50%), primarily speaking English or French.
- Domestic travelers account for 89.2% of guests.
- Key international markets include Australia (89.2%) and United Kingdom (3.6%).
- Top languages spoken are English (77.8%) followed by French (6.9%).
- A significant demographic segment is the Post-2000s (Gen Z/Alpha) group, representing 50% of guests.
Recommendations for Hosts
- Target domestic marketing efforts towards travelers from Sydney and New South Wales.
- Tailor amenities and listing descriptions to appeal to the dominant Post-2000s (Gen Z/Alpha) demographic (e.g., highlight fast WiFi, smart home features, local guides).
- Highlight unique local experiences or amenities relevant to the primary guest profile.
- Consider seasonal promotions aligned with peak travel times for key origin markets.
Nearby Short-Term Rental Market Comparison
How does the Coonabarabran Airbnb market stack up against its neighbors? Compare key performance metrics like average monthly revenue, ADR, and occupancy rates in surrounding areas to understand the broader regional STR landscape.
| Market | Active Properties | Monthly Revenue | Daily Rate | Avg. Occupancy |
|---|---|---|---|---|
| Mudgee | 218 | $3,143 | $293.15 | 41% |
| Mid-Western Regional Council | 230 | $2,898 | $307.49 | 34% |
| Dubbo | 165 | $2,555 | $216.65 | 47% |
| Gunnedah | 15 | $2,428 | $163.34 | 49% |
| Scone | 13 | $2,421 | $219.28 | 39% |
| Moore Creek | 12 | $2,389 | $317.20 | 45% |
| Tamworth | 162 | $2,340 | $217.10 | 49% |
| Muswellbrook | 16 | $2,072 | $176.61 | 46% |
| Upper Hunter Shire Council | 10 | $2,038 | $220.94 | 37% |
| Warrumbungle Shire Council | 14 | $1,828 | $176.77 | 35% |