Darlinghurst Airbnb Market Analysis 2026: Short Term Rental Data & Vacation Rental Statistics in New South Wales, Australia
Is Airbnb profitable in Darlinghurst in 2026? Explore comprehensive Airbnb analytics for Darlinghurst, New South Wales, Australia to uncover income potential. This 2026 STR market report for Darlinghurst, based on AirROI data from February 2025 to January 2026, reveals key trends in the niche market of 26 active listings.
Whether you're considering an Airbnb investment in Darlinghurst, optimizing your existing vacation rental, or exploring rental arbitrage opportunities, understanding the Darlinghurst Airbnb data is crucial. Navigating the high regulation landscape is key to maximizing your short term rental income potential. Let's dive into the specifics.
Key Darlinghurst Airbnb Performance Metrics Overview
Monthly Airbnb Revenue Variations & Income Potential in Darlinghurst (2026)
Understanding the monthly revenue variations for Airbnb listings in Darlinghurst is key to maximizing your short term rental income potential. Seasonality significantly impacts earnings. Our analysis, based on data from the past 12 months, shows that the peak revenue month for STRs in Darlinghurst is typically December, while May often presents the lowest earnings, highlighting opportunities for strategic pricing adjustments during shoulder and low seasons. Explore the typical Airbnb income in Darlinghurst across different performance tiers:
- Best-in-class properties (Top 10%) achieve $9,129+ monthly, often utilizing dynamic pricing and superior guest experiences.
- Strong performing properties (Top 25%) earn $5,345 or more, indicating effective management and desirable locations/amenities.
- Typical properties (Median) generate around $3,747 per month, representing the average market performance.
- Entry-level properties (Bottom 25%) see earnings around $2,556, often with potential for optimization.
Average Monthly Airbnb Earnings Trend in Darlinghurst
Darlinghurst Airbnb Occupancy Rate Trends (2026)
Maximize your bookings by understanding the Darlinghurst STR occupancy trends. Seasonal demand shifts significantly influence how often properties are booked. Typically, Novembersees the highest demand (peak season occupancy), while May experiences the lowest (low season). Effective strategies, like adjusting minimum stays or offering promotions, can boost occupancy during slower periods. Here's how different property tiers perform in Darlinghurst:
- Best-in-class properties (Top 10%) achieve 83%+ occupancy, indicating high desirability and potentially optimized availability.
- Strong performing properties (Top 25%) maintain 76% or higher occupancy, suggesting good market fit and guest satisfaction.
- Typical properties (Median) have an occupancy rate around 64%.
- Entry-level properties (Bottom 25%) average 46% occupancy, potentially facing higher vacancy.
Average Monthly Occupancy Rate Trend in Darlinghurst
Average Daily Rate (ADR) Airbnb Trends in Darlinghurst (2026)
Effective short term rental pricing strategy in Darlinghurst involves understanding monthly ADR fluctuations. The Average Daily Rate (ADR) for Airbnb in Darlinghurst typically peaks in December and dips lowest during August. Leveraging Airbnb dynamic pricing tools or strategies based on this seasonality can significantly boost revenue. Here's a look at the typical nightly rates achieved:
- Best-in-class properties (Top 10%) command rates of $456+ per night, often due to premium features or locations.
- Strong performing properties (Top 25%) achieve nightly rates of $257 or more.
- Typical properties (Median) charge around $192 per night.
- Entry-level properties (Bottom 25%) earn around $148 per night.
Average Daily Rate (ADR) Trend by Month in Darlinghurst
Get Live Darlinghurst Market Intelligence 👇
Explore Real-time Analytics
Airbnb Seasonality Analysis & Trends in Darlinghurst (2026)
Peak Season (December, November, October)
- Revenue averages $6,264 per month
- Occupancy rates average 74.0%
- Daily rates average $274
Shoulder Season
- Revenue averages $3,619 per month
- Occupancy maintains around 54.0%
- Daily rates hold near $212
Low Season (February, March, April)
- Revenue drops to average $0 per month
- Occupancy decreases to average 0.0%
- Daily rates adjust to average $201
Seasonality Insights for Darlinghurst
- The Airbnb seasonality in Darlinghurst shows highly seasonal trends requiring careful strategy. While the sections above show seasonal averages, it's also insightful to look at the extremes:
- During the high season, the absolute peak month showcases Darlinghurst's highest earning potential, with monthly revenues capable of climbing to $7,158, occupancy reaching a high of 79.0%, and ADRs peaking at $306.
- Conversely, the slowest single month of the year, typically falling within the low season, marks the market's lowest point. In this month, revenue might dip to $0, occupancy could drop to 0.0%, and ADRs may adjust down to $183.
- Understanding both the seasonal averages and these monthly peaks and troughs in revenue, occupancy, and ADR is crucial for maximizing your Airbnb profit potential in Darlinghurst.
Seasonal Strategies for Maximizing Profit
- Peak Season: Maximize revenue through premium pricing and potentially longer minimum stays. Ensure high availability.
- Low Season: Offer competitive pricing, special promotions (e.g., extended stay discounts), and flexible cancellation policies. Target off-season travelers like remote workers or budget-conscious guests.
- Shoulder Seasons: Implement dynamic pricing that balances peak and low rates. Target weekend travelers or specific events. Offer slightly more flexible terms than peak season.
- Regularly analyze your own performance against these Darlinghurst seasonality benchmarks and adjust your pricing and availability strategy accordingly.
Best Areas for Airbnb Investment in Darlinghurst (2026)
Exploring the top neighborhoods for short-term rentals in Darlinghurst? This section highlights key areas, outlining why they are attractive for hosts and guests, along with notable local attractions. Consider these locations based on your target guest profile and investment strategy.
| Neighborhood / Area | Why Host Here? (Target Guests & Appeal) | Key Attractions & Landmarks |
|---|---|---|
| Crown Street | A vibrant thoroughfare with a mix of cafes, restaurants, and shops, attracting both locals and visitors. It's well-known for its bustling atmosphere and trendy dining options. | Crown Street cafes, The Imperial Hotel, Oxford Street, Darlinghurst Theatre Company, Spicy Joint |
| William Street | An iconic street that serves as a gateway between Darlinghurst and the city, lined with bars and cultural attractions. Great for hosting guests who want nightlife and easy city access. | Taylor Square, The Colombian Hotel, Baird Lane, Nightclubs, Street Art |
| Oxford Street | A famous street known for its nightlife and diverse culture, predominantly attracting the LGBTQ+ community. Ideal for those looking for a lively and welcoming environment. | Stonewall Hotel, Sydney's LGBT Pride events, The Bearded Tit, Oxford Art Factory, Bar Cleveland |
| Woolloomooloo | Located adjacent to Darlinghurst, featuring waterfront views and a historic atmosphere. Appeals to tourists who appreciate both nature and city life. | Woolloomooloo Wharf, Finger Wharf, The Old Fitzroy Hotel, Access to the Botanic Gardens, Art Galleries |
| Fitzroy Gardens | A serene public park offering green space amid the urban environment. Perfect for families and individuals looking for relaxation and recreation. | Fitzroy Gardens, Picnic areas, Walking paths, Playground, Historical monuments |
| The National Art School | An artistic hub located in a former jail, known for creative arts education and exhibitions. A draw for art enthusiasts and students. | National Art School exhibitions, Art classes, Historical buildings, Artist studios, Outdoor sculptures |
| St. Vincent's Hospital Area | Close proximity to one of the major hospitals in Sydney, ideal for medical professionals and families visiting patients. | St. Vincent's Hospital, Surrounding cafes and shops, Healthcare facilities, Public transport access, Residential communities |
| Darlinghurst Road | A key street in Darlinghurst that embodies the nightlife culture of the area, with numerous bars and eateries. It's perfect for energetic travelers looking to experience nightlife. | TheStonewall Hotel, Shady Pines Saloon, Sydney's nightlife, Dining options, The Bearded Tit |
Understanding Airbnb License Requirements & STR Laws in Darlinghurst (2026)
Yes, Darlinghurst, New South Wales, Australia enforces high STR regulations. Obtaining a license and ensuring compliance is almost certainly required according to current 2026 STR laws. Always verify the latest short term rental regulations and Airbnb license requirements directly with local government authorities for Darlinghurst to ensure full compliance before hosting.
(Source: AirROI data, 2026, based on 96% licensed listings)
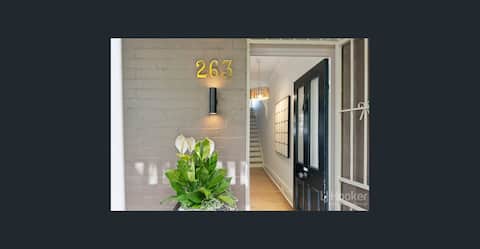
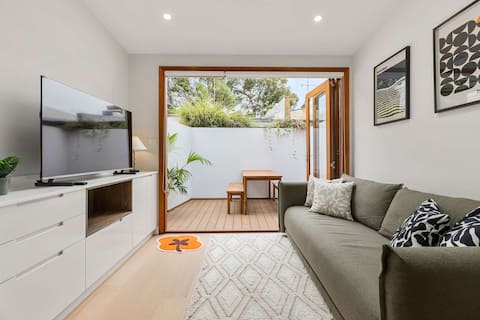
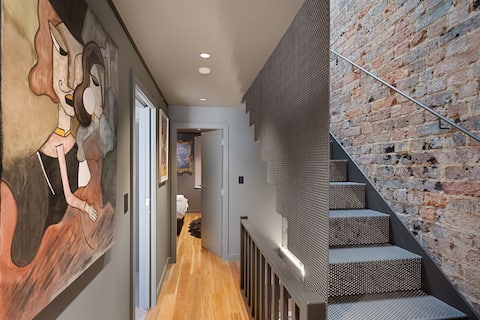
Top Performing Airbnb Properties in Darlinghurst (2026)
Benchmark your potential! Explore examples of top-performing Airbnb properties in Darlinghurstbased on Trailing Twelve Month (TTM) revenue. Analyze their characteristics, revenue, occupancy rate, and ADR to understand what drives success in this market.
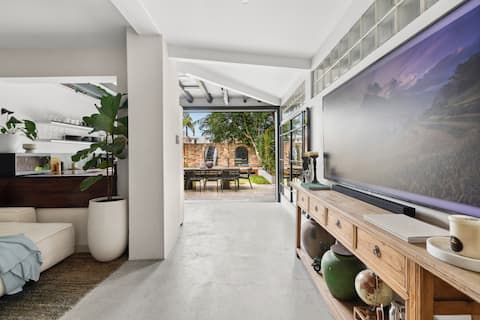
Skyline on Forbes - 4 bedroom home Darlinghurst
Entire Place • 4 bedrooms
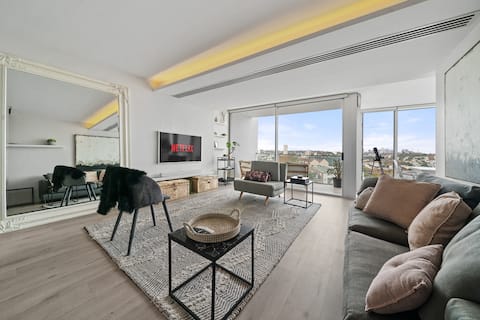
4-Story Terrace House in Darlinghurst
Entire Place • 3 bedrooms
Artsy Terrace | 3 Bed · 3 Bath · 1 Car
Entire Place • 3 bedrooms

The Brass Bear 4BR Parking Sauna 2 Desks Pets OK
Entire Place • 4 bedrooms
Sandstone Oasis & Lush Courtyard
Entire Place • 1 bedroom
Bright 2BR Pad with Scenic City-View, Gym & Pool
Entire Place • 2 bedrooms
Note: Performance varies based on location, size, amenities, seasonality, and management quality. Data reflects the past 12 months.
Top Performing Airbnb Hosts in Darlinghurst (2026)
Learn from the best! This table showcases top-performing Airbnb hosts in Darlinghurst based on the number of properties managed and estimated total revenue over the past year. Analyze their scale and performance metrics.
| Host Name | Properties | Grossing Revenue | Stay Reviews | Avg Rating |
|---|---|---|---|---|
| James | 1 | $105,888 | 35 | 4.97/5.0 |
| Sam | 1 | $102,300 | 55 | 4.91/5.0 |
| Marco | 1 | $83,521 | 38 | 4.92/5.0 |
| Johannes | 2 | $80,132 | 123 | 4.74/5.0 |
| Squirrel Manager | 2 | $66,348 | 40 | 4.47/5.0 |
| Frank | 2 | $60,773 | 12 | 4.50/5.0 |
| Tony | 1 | $49,231 | 21 | 4.76/5.0 |
| Michelle | 1 | $47,565 | 23 | 4.96/5.0 |
| Ben From Bidnstay | 1 | $41,845 | 14 | 4.71/5.0 |
| Perrine Elise | 1 | $40,280 | 18 | 5.00/5.0 |
Analyzing the strategies of top hosts, such as their property selection, pricing, and guest communication, can offer valuable lessons for optimizing your own Airbnb operations in Darlinghurst.
Dive Deeper: Advanced Darlinghurst STR Market Data (2026)
Ready to unlock more insights? AirROI provides access to advanced metrics and comprehensive Airbnb data for Darlinghurst. Explore detailed analytics beyond this report to refine your investment strategy, optimize pricing, and maximize your vacation rental profits.
Explore Advanced MetricsDarlinghurst Short-Term Rental Market Composition (2026): Property & Room Types
Room Type Distribution
Property Type Distribution
Market Composition Insights for Darlinghurst
- The Darlinghurst Airbnb market composition is heavily skewed towards Entire Home/Apt listings, which make up 100% of the 26 active rentals. This indicates strong guest preference for privacy and space.
- Looking at the property type distribution in Darlinghurst, Apartment/Condo properties are the most common (69.2%), reflecting the local real estate landscape.
- Houses represent a significant 30.8% portion, catering likely to families or larger groups.
Darlinghurst Airbnb Room Capacity Analysis (2026): Bedroom Distribution
Distribution of Listings by Number of Bedrooms
Room Capacity Insights for Darlinghurst
- The dominant room capacity in Darlinghurst is 1 bedroom listings, making up 50% of the market. This suggests a strong demand for properties suitable for couples or solo travelers.
- Together, 1 bedroom and 2 bedrooms properties represent 73.1% of the active Airbnb listings in Darlinghurst, indicating a high concentration in these sizes.
Darlinghurst Vacation Rental Guest Capacity Trends (2026)
Distribution of Listings by Guest Capacity
Guest Capacity Insights for Darlinghurst
- The most common guest capacity trend in Darlinghurst vacation rentals is listings accommodating 2 guests (53.8%). This suggests the primary traveler segment is likely couples or solo travelers.
- Properties designed for 2 guests and 4 guests dominate the Darlinghurst STR market, accounting for 69.2% of listings.
- A significant 53.8% of listings cater specifically to 1-2 guests, highlighting strong demand from couples and solo travelers in Darlinghurst.
- 19.1% of properties accommodate 6+ guests, serving the market segment for larger families or group travel in Darlinghurst.
- On average, properties in Darlinghurst are equipped to host 3.6 guests.
Darlinghurst Airbnb Booking Patterns (2026): Available vs. Booked Days
Available Days Distribution
Booked Days Distribution
Booking Pattern Insights for Darlinghurst
- The most common availability pattern in Darlinghurst falls within the 181-270 days range, representing 50% of listings. This suggests many properties have significant open periods on their calendars.
- Approximately 61.5% of listings show high availability (181+ days open annually), indicating potential for increased bookings or specific owner usage patterns.
- For booked days, the 91-180 days range is most frequent in Darlinghurst (50%), reflecting common guest stay durations or potential owner blocking patterns.
- A notable 38.5% of properties secure long booking periods (181+ days booked per year), highlighting successful long-term rental strategies or significant owner usage.
Darlinghurst Airbnb Minimum Stay Requirements Analysis
Distribution of Listings by Minimum Night Requirement
1 Night
5 listings
19.2% of total
2 Nights
4 listings
15.4% of total
3 Nights
2 listings
7.7% of total
4-6 Nights
2 listings
7.7% of total
30+ Nights
13 listings
50% of total
Key Insights
- The most prevalent minimum stay requirement in Darlinghurst is 30+ Nights, adopted by 50% of listings. This highlights the market's preference for longer commitments.
- A significant segment (50%) caters to monthly stays (30+ nights) in Darlinghurst, pointing to opportunities in the extended-stay market.
Recommendations
- Align with the market by considering a 30+ Nights minimum stay, as 50% of Darlinghurst hosts use this setting.
- If feasible, allowing 1-night stays, especially midweek or during low season, could capture last-minute bookings, as only 19.2% currently do.
- Explore offering discounts for stays of 30+ nights to attract the 50% of the market seeking extended stays.
- Adjust minimum nights based on seasonality – potentially shorter during low season and longer during peak demand periods in Darlinghurst.
Darlinghurst Airbnb Cancellation Policy Trends Analysis (2026)
Limited
2 listings
7.7% of total
Flexible
4 listings
15.4% of total
Moderate
5 listings
19.2% of total
Firm
8 listings
30.8% of total
Strict
7 listings
26.9% of total
Cancellation Policy Insights for Darlinghurst
- The prevailing Airbnb cancellation policy trend in Darlinghurst is Firm, used by 30.8% of listings.
- A majority (57.7%) of hosts in Darlinghurst utilize Firm or Strict policies, indicating a market where hosts prioritize booking security.
Recommendations for Hosts
- Consider adopting a Firm policy to align with the 30.8% market standard in Darlinghurst.
- Regularly review your cancellation policy against competitors and market demand shifts in Darlinghurst.
Darlinghurst STR Booking Lead Time Analysis (2026)
Average Booking Lead Time by Month
Booking Lead Time Insights for Darlinghurst
- The overall average booking lead time for vacation rentals in Darlinghurst is 40 days.
- Guests book furthest in advance for stays during December (average 65 days), likely coinciding with peak travel demand or local events.
- The shortest booking windows occur for stays in April (average 0 days), indicating more last-minute travel plans during this time.
- Seasonally, Fall (49 days avg.) sees the longest lead times, while Spring (1 days avg.) has the shortest, reflecting typical travel planning cycles.
Recommendations for Hosts
- Use the overall average lead time (40 days) as a baseline for your pricing and availability strategy in Darlinghurst.
- For December stays, consider implementing length-of-stay discounts or slightly higher rates for bookings made less than 65 days out to capitalize on advance planning.
- During April, focus on last-minute booking availability and promotions, as guests book with very short notice (0 days avg.).
- Target marketing efforts for the Fall season well in advance (at least 49 days) to capture early planners.
- Monitor your own booking lead times against these Darlinghurst averages to identify opportunities for dynamic pricing adjustments.
Popular & Essential Airbnb Amenities in Darlinghurst (2026)
Amenity Prevalence
Amenity Insights for Darlinghurst
- Essential amenities in Darlinghurst that guests expect include: Kitchen, TV, Hair dryer, Hot water kettle, Smoke alarm. Lacking these (any) could significantly impact bookings.
- Popular amenities like Cooking basics, Heating, Hangers are common but not universal. Offering these can provide a competitive edge.
Recommendations for Hosts
- Ensure your listing includes all essential amenities for Darlinghurst: Kitchen, TV, Hair dryer, Hot water kettle, Smoke alarm.
- Prioritize adding missing essentials: TV, Hair dryer, Hot water kettle, Smoke alarm.
- Consider adding popular differentiators like Cooking basics or Heating to increase appeal.
- Highlight unique or less common amenities you offer (e.g., hot tub, dedicated workspace, EV charger) in your listing description and photos.
- Regularly check competitor amenities in Darlinghurst to stay competitive.
Darlinghurst Airbnb Guest Demographics & Profile Analysis (2026)
Guest Profile Summary for Darlinghurst
- The typical guest profile for Airbnb in Darlinghurst consists of a mix of domestic (53%) and international guests, often arriving from nearby Melbourne, typically belonging to the Post-2000s (Gen Z/Alpha) group (50%), primarily speaking English or French.
- Domestic travelers account for 52.8% of guests.
- Key international markets include Australia (52.8%) and United States (14.4%).
- Top languages spoken are English (59%) followed by French (7%).
- A significant demographic segment is the Post-2000s (Gen Z/Alpha) group, representing 50% of guests.
Recommendations for Hosts
- Balance marketing efforts between domestic and international channels based on the guest mix.
- Tailor amenities and listing descriptions to appeal to the dominant Post-2000s (Gen Z/Alpha) demographic (e.g., highlight fast WiFi, smart home features, local guides).
- Highlight unique local experiences or amenities relevant to the primary guest profile.
- Consider seasonal promotions aligned with peak travel times for key origin markets.
Nearby Short-Term Rental Market Comparison
How does the Darlinghurst Airbnb market stack up against its neighbors? Compare key performance metrics like average monthly revenue, ADR, and occupancy rates in surrounding areas to understand the broader regional STR landscape.
| Market | Active Properties | Monthly Revenue | Daily Rate | Avg. Occupancy |
|---|---|---|---|---|
| Berry | 118 | $5,709 | $559.76 | 40% |
| Dawes Point | 10 | $5,632 | $415.45 | 62% |
| Millers Point | 16 | $5,345 | $388.13 | 62% |
| Burrawang | 12 | $5,242 | $557.61 | 38% |
| Penrose | 13 | $5,227 | $681.36 | 40% |
| Nulkaba | 41 | $4,609 | $574.24 | 31% |
| Exeter | 34 | $4,551 | $515.98 | 41% |
| Jaspers Brush | 15 | $4,452 | $445.36 | 34% |
| The Council of the Municipality of Kiama | 109 | $4,372 | $437.99 | 42% |
| Robertson | 46 | $4,320 | $396.04 | 39% |