East Jindabyne Airbnb Market Analysis 2026: Short Term Rental Data & Vacation Rental Statistics in New South Wales, Australia
Is Airbnb profitable in East Jindabyne in 2026? Explore comprehensive Airbnb analytics for East Jindabyne, New South Wales, Australia to uncover income potential. This 2026 STR market report for East Jindabyne, based on AirROI data from February 2025 to January 2026, reveals key trends in the niche market of 125 active listings.
Whether you're considering an Airbnb investment in East Jindabyne, optimizing your existing vacation rental, or exploring rental arbitrage opportunities, understanding the East Jindabyne Airbnb data is crucial. Navigating the high regulation landscape is key to maximizing your short term rental income potential. Let's dive into the specifics.
Key East Jindabyne Airbnb Performance Metrics Overview
Monthly Airbnb Revenue Variations & Income Potential in East Jindabyne (2026)
Understanding the monthly revenue variations for Airbnb listings in East Jindabyne is key to maximizing your short term rental income potential. Seasonality significantly impacts earnings. Our analysis, based on data from the past 12 months, shows that the peak revenue month for STRs in East Jindabyne is typically July, while February often presents the lowest earnings, highlighting opportunities for strategic pricing adjustments during shoulder and low seasons. Explore the typical Airbnb income in East Jindabyne across different performance tiers:
- Best-in-class properties (Top 10%) achieve $8,413+ monthly, often utilizing dynamic pricing and superior guest experiences.
- Strong performing properties (Top 25%) earn $5,438 or more, indicating effective management and desirable locations/amenities.
- Typical properties (Median) generate around $3,387 per month, representing the average market performance.
- Entry-level properties (Bottom 25%) see earnings around $1,915, often with potential for optimization.
Average Monthly Airbnb Earnings Trend in East Jindabyne
East Jindabyne Airbnb Occupancy Rate Trends (2026)
Maximize your bookings by understanding the East Jindabyne STR occupancy trends. Seasonal demand shifts significantly influence how often properties are booked. Typically, Julysees the highest demand (peak season occupancy), while November experiences the lowest (low season). Effective strategies, like adjusting minimum stays or offering promotions, can boost occupancy during slower periods. Here's how different property tiers perform in East Jindabyne:
- Best-in-class properties (Top 10%) achieve 68%+ occupancy, indicating high desirability and potentially optimized availability.
- Strong performing properties (Top 25%) maintain 49% or higher occupancy, suggesting good market fit and guest satisfaction.
- Typical properties (Median) have an occupancy rate around 31%.
- Entry-level properties (Bottom 25%) average 20% occupancy, potentially facing higher vacancy.
Average Monthly Occupancy Rate Trend in East Jindabyne
Average Daily Rate (ADR) Airbnb Trends in East Jindabyne (2026)
Effective short term rental pricing strategy in East Jindabyne involves understanding monthly ADR fluctuations. The Average Daily Rate (ADR) for Airbnb in East Jindabyne typically peaks in July and dips lowest during November. Leveraging Airbnb dynamic pricing tools or strategies based on this seasonality can significantly boost revenue. Here's a look at the typical nightly rates achieved:
- Best-in-class properties (Top 10%) command rates of $736+ per night, often due to premium features or locations.
- Strong performing properties (Top 25%) achieve nightly rates of $515 or more.
- Typical properties (Median) charge around $332 per night.
- Entry-level properties (Bottom 25%) earn around $216 per night.
Average Daily Rate (ADR) Trend by Month in East Jindabyne
Get Live East Jindabyne Market Intelligence 👇

Explore Real-time Analytics
Airbnb Seasonality Analysis & Trends in East Jindabyne (2026)
Peak Season (July, August, June)
- Revenue averages $8,955 per month
- Occupancy rates average 56.0%
- Daily rates average $490
Shoulder Season
- Revenue averages $2,926 per month
- Occupancy maintains around 31.3%
- Daily rates hold near $376
Low Season (January, February, November)
- Revenue drops to average $2,118 per month
- Occupancy decreases to average 25.5%
- Daily rates adjust to average $362
Seasonality Insights for East Jindabyne
- The Airbnb seasonality in East Jindabyne shows highly seasonal trends requiring careful strategy. While the sections above show seasonal averages, it's also insightful to look at the extremes:
- During the high season, the absolute peak month showcases East Jindabyne's highest earning potential, with monthly revenues capable of climbing to $12,728, occupancy reaching a high of 74.2%, and ADRs peaking at $525.
- Conversely, the slowest single month of the year, typically falling within the low season, marks the market's lowest point. In this month, revenue might dip to $1,744, occupancy could drop to 24.2%, and ADRs may adjust down to $348.
- Understanding both the seasonal averages and these monthly peaks and troughs in revenue, occupancy, and ADR is crucial for maximizing your Airbnb profit potential in East Jindabyne.
Seasonal Strategies for Maximizing Profit
- Peak Season: Maximize revenue through premium pricing and potentially longer minimum stays. Ensure high availability.
- Low Season: Offer competitive pricing, special promotions (e.g., extended stay discounts), and flexible cancellation policies. Target off-season travelers like remote workers or budget-conscious guests.
- Shoulder Seasons: Implement dynamic pricing that balances peak and low rates. Target weekend travelers or specific events. Offer slightly more flexible terms than peak season.
- Regularly analyze your own performance against these East Jindabyne seasonality benchmarks and adjust your pricing and availability strategy accordingly.
Best Areas for Airbnb Investment in East Jindabyne (2026)
Exploring the top neighborhoods for short-term rentals in East Jindabyne? This section highlights key areas, outlining why they are attractive for hosts and guests, along with notable local attractions. Consider these locations based on your target guest profile and investment strategy.
| Neighborhood / Area | Why Host Here? (Target Guests & Appeal) | Key Attractions & Landmarks |
|---|---|---|
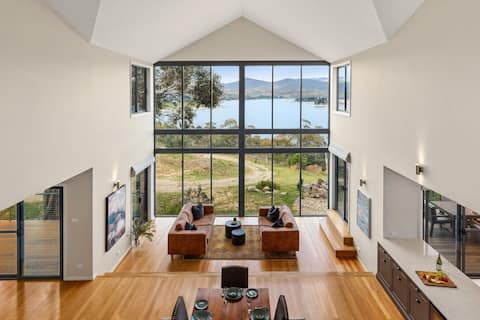
| East Jindabyne | A scenic spot near the Snowy Mountains, East Jindabyne is popular for its stunning lake views and access to outdoor activities. Ideal for adventure seekers and those wanting a serene environment while still being close to skiing and hiking. | Lake Jindabyne, Kosciuszko National Park, Thredbo Resort, Perisher Ski Resort, Snowy Mountains activities, Fishing and boating on the lake |
| Jindabyne Town Center | The bustling heart of Jindabyne offers a mix of shops, cafes, and restaurants, along with easy access to ski resorts. It's a popular destination for visitors year-round, making it a prime Airbnb location. | Jindabyne Sport and Recreation Centre, Lake Jindabyne foreshore, Jindabyne Brewery, Shopping at Nuggets Crossing, Winter sports rentals |
| Thredbo | A famous ski resort village that transforms into a hiking paradise in summer. Thredbo attracts tourists throughout the year and offers top-notch facilities and amenities for guests. | Thredbo Alpine Resort, Kosciuszko Walk, Chairlifts, Thredbo Village shops and dining, Summer hiking trails |
| Perisher | One of Australia's largest ski resorts, Perisher offers winter sports enthusiasts a variety of ski runs and accommodations. It draws a large number of tourists during the ski season, making it a lucrative Airbnb option. | Perisher Ski Resort, Skiing and snowboarding, Cross-country skiing trails, Snowshoe tours, Resort dining options |
| Berridale | A charming township close to the Snowy Mountains, Berridale offers a more relaxed atmosphere while still being a short drive from the ski resorts. This area appeals to families and those looking for budget-friendly accommodations. | Berridale Historical Society Museum, Local cafes and shops, Snowy River hiking trails, Scenic drives, Proximity to ski resorts |
| Mount Kosciuszko | Home to Australia's highest peak, this area appeals to nature lovers and adventure seekers. It offers unparalleled hiking and stunning views, making it attractive for Airbnb hosts targeting outdoor enthusiasts. | Mount Kosciuszko, Kosciuszko National Park, Hiking trails, Wildlife spotting, Scenic drives |
| Smiggin Holes | A quieter alternative for ski accommodation, Smiggin Holes is known for its family-friendly slopes and close-knit community feel. It's great for families looking for easy access to snow activities. | Family ski slopes, Ski schools, Less crowded ski runs, Proximity to Perisher, Snowplay areas |
| DalGETY | A small town offering a peaceful country environment, Dalgety is close to nature and outdoor activities, ideal for guests looking to escape the hustle and bustle. Its proximity to fishing and river activities adds to its appeal. | Snowy River, Fishing, Scenic countryside, Bushwalking, Charming local experiences |
Understanding Airbnb License Requirements & STR Laws in East Jindabyne (2026)
Yes, East Jindabyne, New South Wales, Australia enforces high STR regulations. Obtaining a license and ensuring compliance is almost certainly required according to current 2026 STR laws. Always verify the latest short term rental regulations and Airbnb license requirements directly with local government authorities for East Jindabyne to ensure full compliance before hosting.
(Source: AirROI data, 2026, based on 90% licensed listings)
Top Performing Airbnb Properties in East Jindabyne (2026)
Benchmark your potential! Explore examples of top-performing Airbnb properties in East Jindabynebased on Trailing Twelve Month (TTM) revenue. Analyze their characteristics, revenue, occupancy rate, and ADR to understand what drives success in this market.
Lake View Retreat
Entire Place • 6 bedrooms

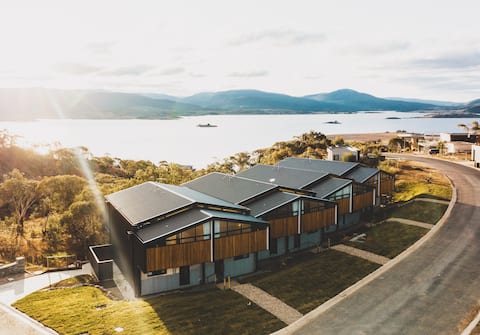
3 new eco cabins with great views
Entire Place • 6 bedrooms
Kunama Townhouses, Jindabyne #6
Entire Place • 3 bedrooms
2 x beautiful new eco cabin with amazing views
Entire Place • 4 bedrooms

10 Kanangra Crescent - Entire
Entire Place • 7 bedrooms
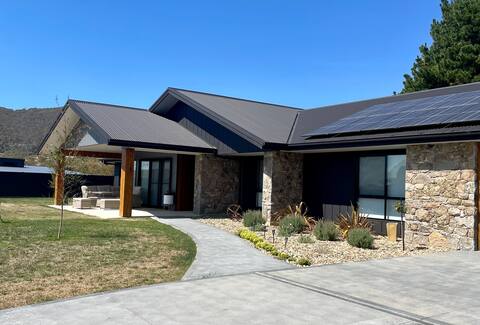
Bella Casa - Brand new spacious four bedroom home
Entire Place • 4 bedrooms
Note: Performance varies based on location, size, amenities, seasonality, and management quality. Data reflects the past 12 months.
Top Performing Airbnb Hosts in East Jindabyne (2026)
Learn from the best! This table showcases top-performing Airbnb hosts in East Jindabyne based on the number of properties managed and estimated total revenue over the past year. Analyze their scale and performance metrics.
| Host Name | Properties | Grossing Revenue | Stay Reviews | Avg Rating |
|---|---|---|---|---|
| Luke | 13 | $542,506 | 209 | 4.92/5.0 |
| Hygge Eco Cabins | 8 | $475,108 | 298 | 4.96/5.0 |
| Belle Property Escapes Snowy M | 9 | $420,106 | 137 | 4.45/5.0 |
| Accommodation Jindabyne | 8 | $349,172 | 37 | 4.58/5.0 |
| Snowy Mountains Accommodation | 5 | $254,150 | 28 | 4.57/5.0 |
| Mel | 2 | $154,772 | 461 | 4.92/5.0 |
| Lesa | 3 | $153,792 | 466 | 4.95/5.0 |
| Jindabyne Ski | 4 | $129,817 | 14 | 4.58/5.0 |
| Craig, Luka+Willow | 3 | $102,034 | 515 | 4.81/5.0 |
| Brooke | 2 | $97,654 | 99 | 4.97/5.0 |
Analyzing the strategies of top hosts, such as their property selection, pricing, and guest communication, can offer valuable lessons for optimizing your own Airbnb operations in East Jindabyne.
Dive Deeper: Advanced East Jindabyne STR Market Data (2026)
Ready to unlock more insights? AirROI provides access to advanced metrics and comprehensive Airbnb data for East Jindabyne. Explore detailed analytics beyond this report to refine your investment strategy, optimize pricing, and maximize your vacation rental profits.
Explore Advanced MetricsEast Jindabyne Short-Term Rental Market Composition (2026): Property & Room Types
Room Type Distribution
Property Type Distribution
Market Composition Insights for East Jindabyne
- The East Jindabyne Airbnb market composition is heavily skewed towards Entire Home/Apt listings, which make up 97.6% of the 125 active rentals. This indicates strong guest preference for privacy and space.
- Looking at the property type distribution in East Jindabyne, House properties are the most common (51.2%), reflecting the local real estate landscape.
- Houses represent a significant 51.2% portion, catering likely to families or larger groups.
- The presence of 8% Hotel/Boutique listings indicates integration with traditional hospitality.
- Smaller segments like others (combined 1.6%) offer potential for unique stay experiences.
East Jindabyne Airbnb Room Capacity Analysis (2026): Bedroom Distribution
Distribution of Listings by Number of Bedrooms
Room Capacity Insights for East Jindabyne
- The dominant room capacity in East Jindabyne is 3 bedrooms listings, making up 30.4% of the market. This suggests a strong demand for properties suitable for families or small groups.
- Together, 3 bedrooms and 1 bedroom properties represent 52.0% of the active Airbnb listings in East Jindabyne, indicating a high concentration in these sizes.
- A significant 52.0% of listings offer 3+ bedrooms, catering to larger groups and families seeking more space in East Jindabyne.
East Jindabyne Vacation Rental Guest Capacity Trends (2026)
Distribution of Listings by Guest Capacity
Guest Capacity Insights for East Jindabyne
- The most common guest capacity trend in East Jindabyne vacation rentals is listings accommodating 8+ guests (40%). This suggests the primary traveler segment is likely larger groups.
- Properties designed for 8+ guests and 4 guests dominate the East Jindabyne STR market, accounting for 61.6% of listings.
- 56.8% of properties accommodate 6+ guests, serving the market segment for larger families or group travel in East Jindabyne.
- On average, properties in East Jindabyne are equipped to host 5.8 guests.
East Jindabyne Airbnb Booking Patterns (2026): Available vs. Booked Days
Available Days Distribution
Booked Days Distribution
Booking Pattern Insights for East Jindabyne
- The most common availability pattern in East Jindabyne falls within the 271-366 days range, representing 56% of listings. This suggests many properties have significant open periods on their calendars.
- Approximately 91.2% of listings show high availability (181+ days open annually), indicating potential for increased bookings or specific owner usage patterns.
- For booked days, the 31-90 days range is most frequent in East Jindabyne (47.2%), reflecting common guest stay durations or potential owner blocking patterns.
- A notable 9.6% of properties secure long booking periods (181+ days booked per year), highlighting successful long-term rental strategies or significant owner usage.
East Jindabyne Airbnb Minimum Stay Requirements Analysis
Distribution of Listings by Minimum Night Requirement
1 Night
13 listings
10.4% of total
2 Nights
46 listings
36.8% of total
3 Nights
3 listings
2.4% of total
4-6 Nights
2 listings
1.6% of total
7-29 Nights
6 listings
4.8% of total
30+ Nights
55 listings
44% of total
Key Insights
- The most prevalent minimum stay requirement in East Jindabyne is 30+ Nights, adopted by 44% of listings. This highlights the market's preference for longer commitments.
- A significant segment (44%) caters to monthly stays (30+ nights) in East Jindabyne, pointing to opportunities in the extended-stay market.
Recommendations
- Align with the market by considering a 30+ Nights minimum stay, as 44% of East Jindabyne hosts use this setting.
- If feasible, allowing 1-night stays, especially midweek or during low season, could capture last-minute bookings, as only 10.4% currently do.
- A 2-night minimum appears standard (36.8%). Consider this for weekends or peak periods.
- Explore offering discounts for stays of 30+ nights to attract the 44% of the market seeking extended stays.
- Adjust minimum nights based on seasonality – potentially shorter during low season and longer during peak demand periods in East Jindabyne.
East Jindabyne Airbnb Cancellation Policy Trends Analysis (2026)
Super Strict 30 Days
19 listings
15.2% of total
Super Strict 60 Days
14 listings
11.2% of total
Flexible
3 listings
2.4% of total
Moderate
11 listings
8.8% of total
Firm
52 listings
41.6% of total
Strict
26 listings
20.8% of total
Cancellation Policy Insights for East Jindabyne
- The prevailing Airbnb cancellation policy trend in East Jindabyne is Firm, used by 41.6% of listings.
- A majority (62.4%) of hosts in East Jindabyne utilize Firm or Strict policies, indicating a market where hosts prioritize booking security.
Recommendations for Hosts
- Consider adopting a Firm policy to align with the 41.6% market standard in East Jindabyne.
- Regularly review your cancellation policy against competitors and market demand shifts in East Jindabyne.
East Jindabyne STR Booking Lead Time Analysis (2026)
Average Booking Lead Time by Month
Booking Lead Time Insights for East Jindabyne
- The overall average booking lead time for vacation rentals in East Jindabyne is 59 days.
- Guests book furthest in advance for stays during November (average 96 days), likely coinciding with peak travel demand or local events.
- The shortest booking windows occur for stays in February (average 19 days), indicating more last-minute travel plans during this time.
- Seasonally, Summer (68 days avg.) sees the longest lead times, while Winter (45 days avg.) has the shortest, reflecting typical travel planning cycles.
Recommendations for Hosts
- Use the overall average lead time (59 days) as a baseline for your pricing and availability strategy in East Jindabyne.
- For November stays, consider implementing length-of-stay discounts or slightly higher rates for bookings made less than 96 days out to capitalize on advance planning.
- Target marketing efforts for the Summer season well in advance (at least 68 days) to capture early planners.
- Monitor your own booking lead times against these East Jindabyne averages to identify opportunities for dynamic pricing adjustments.
Popular & Essential Airbnb Amenities in East Jindabyne (2026)
Amenity Prevalence
Amenity Insights for East Jindabyne
- Essential amenities in East Jindabyne that guests expect include: Heating, TV, Smoke alarm. Lacking these (any) could significantly impact bookings.
- Popular amenities like Free parking on premises, Kitchen, Dishes and silverware are common but not universal. Offering these can provide a competitive edge.
Recommendations for Hosts
- Ensure your listing includes all essential amenities for East Jindabyne: Heating, TV, Smoke alarm.
- Prioritize adding missing essentials: Heating, TV, Smoke alarm.
- Consider adding popular differentiators like Free parking on premises or Kitchen to increase appeal.
- Highlight unique or less common amenities you offer (e.g., hot tub, dedicated workspace, EV charger) in your listing description and photos.
- Regularly check competitor amenities in East Jindabyne to stay competitive.
East Jindabyne Airbnb Guest Demographics & Profile Analysis (2026)
Guest Profile Summary for East Jindabyne
- The typical guest profile for Airbnb in East Jindabyne consists of primarily domestic travelers (92%), often arriving from nearby Sydney, typically belonging to the Post-2000s (Gen Z/Alpha) group (50%), primarily speaking English or Chinese.
- Domestic travelers account for 92.3% of guests.
- Key international markets include Australia (92.3%) and United Kingdom (1.4%).
- Top languages spoken are English (62.3%) followed by Chinese (9.9%).
- A significant demographic segment is the Post-2000s (Gen Z/Alpha) group, representing 50% of guests.
Recommendations for Hosts
- Target domestic marketing efforts towards travelers from Sydney and New South Wales.
- Tailor amenities and listing descriptions to appeal to the dominant Post-2000s (Gen Z/Alpha) demographic (e.g., highlight fast WiFi, smart home features, local guides).
- Highlight unique local experiences or amenities relevant to the primary guest profile.
- Consider seasonal promotions aligned with peak travel times for key origin markets.
Nearby Short-Term Rental Market Comparison
How does the East Jindabyne Airbnb market stack up against its neighbors? Compare key performance metrics like average monthly revenue, ADR, and occupancy rates in surrounding areas to understand the broader regional STR landscape.
| Market | Active Properties | Monthly Revenue | Daily Rate | Avg. Occupancy |
|---|---|---|---|---|
| Snowy Monaro Regional Council | 228 | $3,405 | $386.39 | 35% |
| Yass Valley Council | 34 | $3,328 | $326.40 | 32% |
| Gundaroo | 11 | $3,101 | $351.70 | 37% |
| Braidwood | 28 | $2,925 | $474.51 | 35% |
| Thredbo | 283 | $2,767 | $518.96 | 27% |
| Falls Creek | 48 | $2,589 | $433.92 | 31% |
| Anglers Reach | 12 | $2,537 | $247.74 | 41% |
| Jindabyne | 586 | $2,391 | $397.02 | 31% |
| Merimbula | 219 | $2,137 | $250.38 | 39% |
| Tumbarumba | 14 | $2,117 | $161.66 | 46% |