Katoomba Airbnb Market Analysis 2026: Short Term Rental Data & Vacation Rental Statistics in New South Wales, Australia
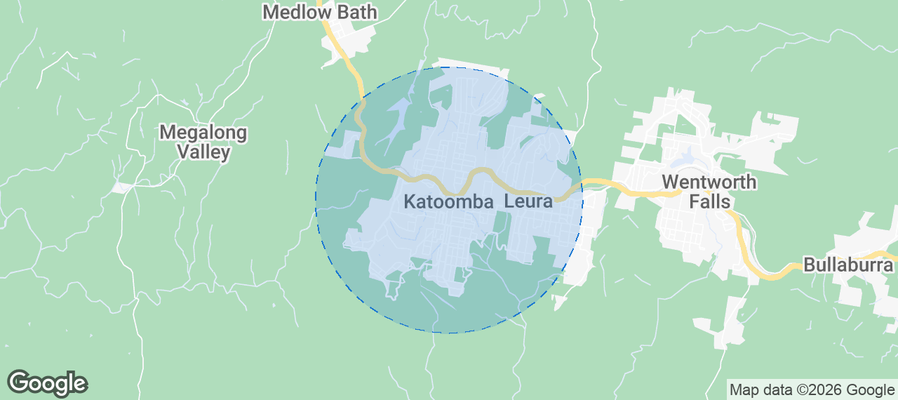
Is Airbnb profitable in Katoomba in 2026? Explore comprehensive Airbnb analytics for Katoomba, New South Wales, Australia to uncover income potential. This 2026 STR market report for Katoomba, based on AirROI data from February 2025 to January 2026, reveals key trends in the niche market of 21 active listings.
Whether you're considering an Airbnb investment in Katoomba, optimizing your existing vacation rental, or exploring rental arbitrage opportunities, understanding the Katoomba Airbnb data is crucial. Navigating the high regulation landscape is key to maximizing your short term rental income potential. Let's dive into the specifics.
Key Katoomba Airbnb Performance Metrics Overview
Monthly Airbnb Revenue Variations & Income Potential in Katoomba (2026)
Understanding the monthly revenue variations for Airbnb listings in Katoomba is key to maximizing your short term rental income potential. Seasonality significantly impacts earnings. Our analysis, based on data from the past 12 months, shows that the peak revenue month for STRs in Katoomba is typically October, while May often presents the lowest earnings, highlighting opportunities for strategic pricing adjustments during shoulder and low seasons. Explore the typical Airbnb income in Katoomba across different performance tiers:
- Best-in-class properties (Top 10%) achieve $5,775+ monthly, often utilizing dynamic pricing and superior guest experiences.
- Strong performing properties (Top 25%) earn $3,694 or more, indicating effective management and desirable locations/amenities.
- Typical properties (Median) generate around $2,494 per month, representing the average market performance.
- Entry-level properties (Bottom 25%) see earnings around $1,341, often with potential for optimization.
Average Monthly Airbnb Earnings Trend in Katoomba
Katoomba Airbnb Occupancy Rate Trends (2026)
Maximize your bookings by understanding the Katoomba STR occupancy trends. Seasonal demand shifts significantly influence how often properties are booked. Typically, Julysees the highest demand (peak season occupancy), while May experiences the lowest (low season). Effective strategies, like adjusting minimum stays or offering promotions, can boost occupancy during slower periods. Here's how different property tiers perform in Katoomba:
- Best-in-class properties (Top 10%) achieve 68%+ occupancy, indicating high desirability and potentially optimized availability.
- Strong performing properties (Top 25%) maintain 51% or higher occupancy, suggesting good market fit and guest satisfaction.
- Typical properties (Median) have an occupancy rate around 28%.
- Entry-level properties (Bottom 25%) average 18% occupancy, potentially facing higher vacancy.
Average Monthly Occupancy Rate Trend in Katoomba
Average Daily Rate (ADR) Airbnb Trends in Katoomba (2026)
Effective short term rental pricing strategy in Katoomba involves understanding monthly ADR fluctuations. The Average Daily Rate (ADR) for Airbnb in Katoomba typically peaks in September and dips lowest during November. Leveraging Airbnb dynamic pricing tools or strategies based on this seasonality can significantly boost revenue. Here's a look at the typical nightly rates achieved:
- Best-in-class properties (Top 10%) command rates of $460+ per night, often due to premium features or locations.
- Strong performing properties (Top 25%) achieve nightly rates of $345 or more.
- Typical properties (Median) charge around $263 per night.
- Entry-level properties (Bottom 25%) earn around $159 per night.
Average Daily Rate (ADR) Trend by Month in Katoomba
Get Live Katoomba Market Intelligence 👇
Explore Real-time Analytics
Airbnb Seasonality Analysis & Trends in Katoomba (2026)
Peak Season (October, June, July)
- Revenue averages $3,932 per month
- Occupancy rates average 43.5%
- Daily rates average $279
Shoulder Season
- Revenue averages $2,459 per month
- Occupancy maintains around 31.5%
- Daily rates hold near $275
Low Season (February, March, April)
- Revenue drops to average $0 per month
- Occupancy decreases to average 0.0%
- Daily rates adjust to average $287
Seasonality Insights for Katoomba
- The Airbnb seasonality in Katoomba shows highly seasonal trends requiring careful strategy. While the sections above show seasonal averages, it's also insightful to look at the extremes:
- During the high season, the absolute peak month showcases Katoomba's highest earning potential, with monthly revenues capable of climbing to $4,177, occupancy reaching a high of 45.8%, and ADRs peaking at $298.
- Conversely, the slowest single month of the year, typically falling within the low season, marks the market's lowest point. In this month, revenue might dip to $0, occupancy could drop to 0.0%, and ADRs may adjust down to $261.
- Understanding both the seasonal averages and these monthly peaks and troughs in revenue, occupancy, and ADR is crucial for maximizing your Airbnb profit potential in Katoomba.
Seasonal Strategies for Maximizing Profit
- Peak Season: Maximize revenue through premium pricing and potentially longer minimum stays. Ensure high availability.
- Low Season: Offer competitive pricing, special promotions (e.g., extended stay discounts), and flexible cancellation policies. Target off-season travelers like remote workers or budget-conscious guests.
- Shoulder Seasons: Implement dynamic pricing that balances peak and low rates. Target weekend travelers or specific events. Offer slightly more flexible terms than peak season.
- Regularly analyze your own performance against these Katoomba seasonality benchmarks and adjust your pricing and availability strategy accordingly.
Best Areas for Airbnb Investment in Katoomba (2026)
Exploring the top neighborhoods for short-term rentals in Katoomba? This section highlights key areas, outlining why they are attractive for hosts and guests, along with notable local attractions. Consider these locations based on your target guest profile and investment strategy.
| Neighborhood / Area | Why Host Here? (Target Guests & Appeal) | Key Attractions & Landmarks |
|---|---|---|
| Scenic World | Famous for its breathtaking views of the Blue Mountains and thrilling rides. A must-visit for nature lovers and adventure seekers. | Scenic Railway, Scenic Skyway, Scenic Walkway, Eco Tours, Blue Mountains National Park |
| Three Sisters | A legendary rock formation that is a popular tourist attraction in the Blue Mountains. Excellent for families and photographers. | Three Sisters Lookout, Giant Steps Walk, Echo Point, Katoomba Falls, Hiking Trails |
| Katoomba Town Centre | The vibrant heart of Katoomba with shops, restaurants, and cafes. It's a hub for visitors looking to experience local life. | Katoomba Street, The Carrington Hotel, Australian Blue Mountains Tours, Local Markets, Galleries and Art Shops |
| Leura Village | Known for its charming streets, boutique shopping, and lovely gardens. Great for travelers looking for a quaint experience. | Leura Mall, Everglades Gardens, Leura Cascades, Gordon Falls, Local Cafes |
| Echo Point | Offers breathtaking vistas and is a key location for viewing the Three Sisters. Popular among tourists for its stunning views. | Panorama of the Jamison Valley, Lookouts, Walking Trails, Information Center, Picnic Areas |
| Katoomba Falls | A stunning waterfall in a beautiful park setting, ideal for nature lovers and hikers. | Katoomba Falls Lookout, Hiking Trails, Wetlands, Picnic Areas, Photography Spots |
| Megalong Valley | A picturesque valley known for its scenery and tranquility. Attracts visitors looking for a peaceful retreat. | Megalong Valley Tea Rooms, Horse Riding Trails, Walking Trails, Scenic Views, Wildlife Watching |
| High Street | A hub of restaurants, cafes, and shops. Conveniently located near public transport and attractions, ideal for visitors wanting to explore Katoomba. | Shopping District, Public Transport Access, Dining Options, Local Art Galleries, Street Performances |
Understanding Airbnb License Requirements & STR Laws in Katoomba (2026)
Yes, Katoomba, New South Wales, Australia enforces high STR regulations. Obtaining a license and ensuring compliance is almost certainly required according to current 2026 STR laws. Always verify the latest short term rental regulations and Airbnb license requirements directly with local government authorities for Katoomba to ensure full compliance before hosting.
(Source: AirROI data, 2026, based on 95% licensed listings)
Top Performing Airbnb Properties in Katoomba (2026)
Benchmark your potential! Explore examples of top-performing Airbnb properties in Katoombabased on Trailing Twelve Month (TTM) revenue. Analyze their characteristics, revenue, occupancy rate, and ADR to understand what drives success in this market.
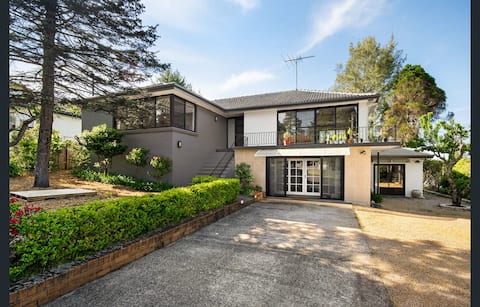
Spacious 5BR Retreat | Walk to Three Sisters
Entire Place • 5 bedrooms
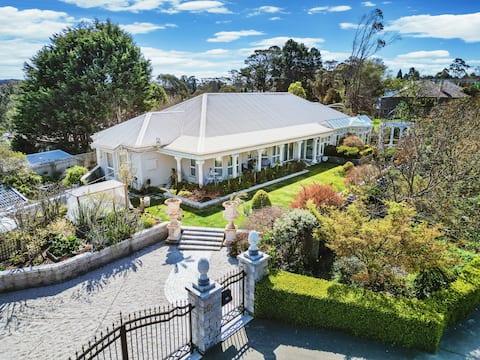
Katoomba Estate 5 Bdr 5 Bth Luxury - Home Cinema
Entire Place • 5 bedrooms
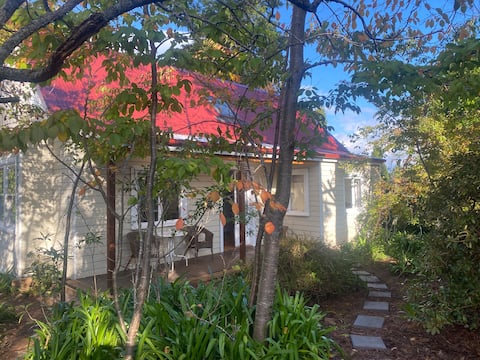
Pinetrees Mountain Retreat
Entire Place • 2 bedrooms
Bisham Cottage Fully renovated
Entire Place • 2 bedrooms
Heart of the Blue Mountains
Entire Place • 4 bedrooms
The Last Straw
Entire Place • 4 bedrooms
Note: Performance varies based on location, size, amenities, seasonality, and management quality. Data reflects the past 12 months.
Top Performing Airbnb Hosts in Katoomba (2026)
Learn from the best! This table showcases top-performing Airbnb hosts in Katoomba based on the number of properties managed and estimated total revenue over the past year. Analyze their scale and performance metrics.
| Host Name | Properties | Grossing Revenue | Stay Reviews | Avg Rating |
|---|---|---|---|---|
| Blue Mountains Escapes | 8 | $114,425 | 220 | 4.71/5.0 |
| Daniel | 2 | $73,365 | 31 | 4.86/5.0 |
| Rudi | 1 | $48,457 | 17 | 4.82/5.0 |
| Holidaybluemountains.Com | 3 | $42,132 | 9 | 4.90/5.0 |
| Rosalie | 1 | $34,715 | 37 | 5.00/5.0 |
| Simone | 1 | $34,653 | 64 | 4.98/5.0 |
| Matthew | 1 | $18,820 | 14 | 4.79/5.0 |
| Ally & Blake | 1 | $18,286 | 29 | 4.83/5.0 |
| Maya | 1 | $14,549 | 33 | 4.42/5.0 |
| Frank | 1 | $13,160 | 7 | 3.71/5.0 |
Analyzing the strategies of top hosts, such as their property selection, pricing, and guest communication, can offer valuable lessons for optimizing your own Airbnb operations in Katoomba.
Dive Deeper: Advanced Katoomba STR Market Data (2026)
Ready to unlock more insights? AirROI provides access to advanced metrics and comprehensive Airbnb data for Katoomba. Explore detailed analytics beyond this report to refine your investment strategy, optimize pricing, and maximize your vacation rental profits.
Explore Advanced MetricsKatoomba Short-Term Rental Market Composition (2026): Property & Room Types
Room Type Distribution
Property Type Distribution
Market Composition Insights for Katoomba
- The Katoomba Airbnb market composition is heavily skewed towards Entire Home/Apt listings, which make up 100% of the 21 active rentals. This indicates strong guest preference for privacy and space.
- Looking at the property type distribution in Katoomba, House properties are the most common (81%), reflecting the local real estate landscape.
- Houses represent a significant 81% portion, catering likely to families or larger groups.
- Smaller segments like hotel/boutique, others (combined 9.6%) offer potential for unique stay experiences.
Katoomba Airbnb Room Capacity Analysis (2026): Bedroom Distribution
Distribution of Listings by Number of Bedrooms
Room Capacity Insights for Katoomba
- The dominant room capacity in Katoomba is 2 bedrooms listings, making up 33.3% of the market. This suggests a strong demand for properties suitable for couples or solo travelers.
- Together, 2 bedrooms and 3 bedrooms properties represent 61.9% of the active Airbnb listings in Katoomba, indicating a high concentration in these sizes.
- A significant 52.4% of listings offer 3+ bedrooms, catering to larger groups and families seeking more space in Katoomba.
Katoomba Vacation Rental Guest Capacity Trends (2026)
Distribution of Listings by Guest Capacity
Guest Capacity Insights for Katoomba
- The most common guest capacity trend in Katoomba vacation rentals is listings accommodating 6 guests (28.6%). This suggests the primary traveler segment is likely larger groups.
- Properties designed for 6 guests and 8+ guests dominate the Katoomba STR market, accounting for 52.4% of listings.
- 52.4% of properties accommodate 6+ guests, serving the market segment for larger families or group travel in Katoomba.
- On average, properties in Katoomba are equipped to host 5.5 guests.
Katoomba Airbnb Booking Patterns (2026): Available vs. Booked Days
Available Days Distribution
Booked Days Distribution
Booking Pattern Insights for Katoomba
- The most common availability pattern in Katoomba falls within the 271-366 days range, representing 71.4% of listings. This suggests many properties have significant open periods on their calendars.
- Approximately 90.4% of listings show high availability (181+ days open annually), indicating potential for increased bookings or specific owner usage patterns.
- For booked days, the 31-90 days range is most frequent in Katoomba (61.9%), reflecting common guest stay durations or potential owner blocking patterns.
- A notable 9.5% of properties secure long booking periods (181+ days booked per year), highlighting successful long-term rental strategies or significant owner usage.
Katoomba Airbnb Minimum Stay Requirements Analysis
Distribution of Listings by Minimum Night Requirement
1 Night
1 listings
4.8% of total
2 Nights
12 listings
57.1% of total
30+ Nights
8 listings
38.1% of total
Key Insights
- The most prevalent minimum stay requirement in Katoomba is 2 Nights, adopted by 57.1% of listings. This highlights the market's preference for shorter, flexible bookings.
- A strong majority (61.9%) of the Katoomba Airbnb data shows acceptance of very short stays (1-2 nights), indicating a dynamic, high-turnover market.
- A significant segment (38.1%) caters to monthly stays (30+ nights) in Katoomba, pointing to opportunities in the extended-stay market.
Recommendations
- Align with the market by considering a 2 Nights minimum stay, as 57.1% of Katoomba hosts use this setting.
- If feasible, allowing 1-night stays, especially midweek or during low season, could capture last-minute bookings, as only 4.8% currently do.
- A 2-night minimum appears standard (57.1%). Consider this for weekends or peak periods.
- Explore offering discounts for stays of 30+ nights to attract the 38.1% of the market seeking extended stays.
- Adjust minimum nights based on seasonality – potentially shorter during low season and longer during peak demand periods in Katoomba.
Katoomba Airbnb Cancellation Policy Trends Analysis (2026)
Super Strict 30 Days
3 listings
14.3% of total
Super Strict 60 Days
9 listings
42.9% of total
Flexible
1 listings
4.8% of total
Moderate
4 listings
19% of total
Firm
4 listings
19% of total
Cancellation Policy Insights for Katoomba
- The prevailing Airbnb cancellation policy trend in Katoomba is Super Strict 60 Days, used by 42.9% of listings.
- There's a relatively balanced mix between guest-friendly (23.8%) and stricter (19.0%) policies, offering choices for different guest needs.
Recommendations for Hosts
- Consider adopting a Super Strict 60 Days policy to align with the 42.9% market standard in Katoomba.
- Regularly review your cancellation policy against competitors and market demand shifts in Katoomba.
Katoomba STR Booking Lead Time Analysis (2026)
Average Booking Lead Time by Month
Booking Lead Time Insights for Katoomba
- The overall average booking lead time for vacation rentals in Katoomba is 35 days.
- Guests book furthest in advance for stays during January (average 59 days), likely coinciding with peak travel demand or local events.
- The shortest booking windows occur for stays in April (average 0 days), indicating more last-minute travel plans during this time.
- Seasonally, Fall (33 days avg.) sees the longest lead times, while Spring (1 days avg.) has the shortest, reflecting typical travel planning cycles.
Recommendations for Hosts
- Use the overall average lead time (35 days) as a baseline for your pricing and availability strategy in Katoomba.
- For January stays, consider implementing length-of-stay discounts or slightly higher rates for bookings made less than 59 days out to capitalize on advance planning.
- During April, focus on last-minute booking availability and promotions, as guests book with very short notice (0 days avg.).
- Target marketing efforts for the Fall season well in advance (at least 33 days) to capture early planners.
- Monitor your own booking lead times against these Katoomba averages to identify opportunities for dynamic pricing adjustments.
Popular & Essential Airbnb Amenities in Katoomba (2026)
Amenity Prevalence
Amenity Insights for Katoomba
- Essential amenities in Katoomba that guests expect include: Hot water, Wifi, Smoke alarm. Lacking these (any) could significantly impact bookings.
- Popular amenities like Kitchen, Refrigerator, Hot water kettle are common but not universal. Offering these can provide a competitive edge.
Recommendations for Hosts
- Ensure your listing includes all essential amenities for Katoomba: Hot water, Wifi, Smoke alarm.
- Prioritize adding missing essentials: Smoke alarm.
- Consider adding popular differentiators like Kitchen or Refrigerator to increase appeal.
- Highlight unique or less common amenities you offer (e.g., hot tub, dedicated workspace, EV charger) in your listing description and photos.
- Regularly check competitor amenities in Katoomba to stay competitive.
Katoomba Airbnb Guest Demographics & Profile Analysis (2026)
Guest Profile Summary for Katoomba
- The typical guest profile for Airbnb in Katoomba consists of primarily domestic travelers (74%), often arriving from nearby Sydney, typically belonging to the Post-2000s (Gen Z/Alpha) group (50%), primarily speaking Spanish or French.
- Domestic travelers account for 74.2% of guests.
- Key international markets include Australia (74.2%) and United Kingdom (5.5%).
- Top languages spoken are Spanish (9.1%) followed by French (5.2%).
- A significant demographic segment is the Post-2000s (Gen Z/Alpha) group, representing 50% of guests.
Recommendations for Hosts
- Target domestic marketing efforts towards travelers from Sydney and New South Wales.
- Tailor amenities and listing descriptions to appeal to the dominant Post-2000s (Gen Z/Alpha) demographic (e.g., highlight fast WiFi, smart home features, local guides).
- Highlight unique local experiences or amenities relevant to the primary guest profile.
- Consider seasonal promotions aligned with peak travel times for key origin markets.
Nearby Short-Term Rental Market Comparison
How does the Katoomba Airbnb market stack up against its neighbors? Compare key performance metrics like average monthly revenue, ADR, and occupancy rates in surrounding areas to understand the broader regional STR landscape.
| Market | Active Properties | Monthly Revenue | Daily Rate | Avg. Occupancy |
|---|---|---|---|---|
| Berry | 118 | $5,709 | $559.76 | 40% |
| Dawes Point | 10 | $5,632 | $415.45 | 62% |
| Millers Point | 16 | $5,345 | $388.13 | 62% |
| Burrawang | 12 | $5,242 | $557.61 | 38% |
| Penrose | 13 | $5,227 | $681.36 | 40% |
| Nulkaba | 41 | $4,609 | $574.24 | 31% |
| Exeter | 34 | $4,551 | $515.98 | 41% |
| Jaspers Brush | 15 | $4,452 | $445.36 | 34% |
| The Council of the Municipality of Kiama | 109 | $4,372 | $437.99 | 42% |
| Robertson | 46 | $4,320 | $396.04 | 39% |