Lidcombe Airbnb Market Analysis 2026: Short Term Rental Data & Vacation Rental Statistics in New South Wales, Australia
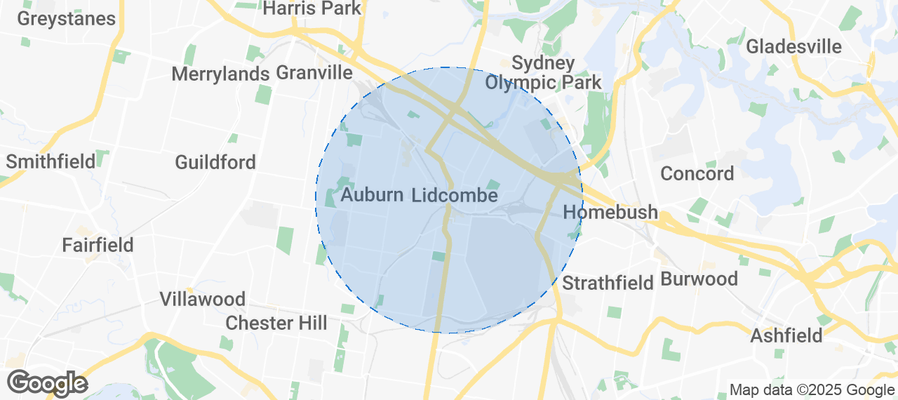
Is Airbnb profitable in Lidcombe in 2026? Explore comprehensive Airbnb analytics for Lidcombe, New South Wales, Australia to uncover income potential. This 2026 STR market report for Lidcombe, based on AirROI data from February 2025 to January 2026, reveals key trends in the niche market of 31 active listings.
Whether you're considering an Airbnb investment in Lidcombe, optimizing your existing vacation rental, or exploring rental arbitrage opportunities, understanding the Lidcombe Airbnb data is crucial. Navigating the high regulation landscape is key to maximizing your short term rental income potential. Let's dive into the specifics.
Key Lidcombe Airbnb Performance Metrics Overview
Monthly Airbnb Revenue Variations & Income Potential in Lidcombe (2026)
Understanding the monthly revenue variations for Airbnb listings in Lidcombe is key to maximizing your short term rental income potential. Seasonality significantly impacts earnings. Our analysis, based on data from the past 12 months, shows that the peak revenue month for STRs in Lidcombe is typically December, while May often presents the lowest earnings, highlighting opportunities for strategic pricing adjustments during shoulder and low seasons. Explore the typical Airbnb income in Lidcombe across different performance tiers:
- Best-in-class properties (Top 10%) achieve $4,710+ monthly, often utilizing dynamic pricing and superior guest experiences.
- Strong performing properties (Top 25%) earn $3,517 or more, indicating effective management and desirable locations/amenities.
- Typical properties (Median) generate around $2,095 per month, representing the average market performance.
- Entry-level properties (Bottom 25%) see earnings around $1,119, often with potential for optimization.
Average Monthly Airbnb Earnings Trend in Lidcombe
Lidcombe Airbnb Occupancy Rate Trends (2026)
Maximize your bookings by understanding the Lidcombe STR occupancy trends. Seasonal demand shifts significantly influence how often properties are booked. Typically, Decembersees the highest demand (peak season occupancy), while May experiences the lowest (low season). Effective strategies, like adjusting minimum stays or offering promotions, can boost occupancy during slower periods. Here's how different property tiers perform in Lidcombe:
- Best-in-class properties (Top 10%) achieve 68%+ occupancy, indicating high desirability and potentially optimized availability.
- Strong performing properties (Top 25%) maintain 58% or higher occupancy, suggesting good market fit and guest satisfaction.
- Typical properties (Median) have an occupancy rate around 35%.
- Entry-level properties (Bottom 25%) average 20% occupancy, potentially facing higher vacancy.
Average Monthly Occupancy Rate Trend in Lidcombe
Average Daily Rate (ADR) Airbnb Trends in Lidcombe (2026)
Effective short term rental pricing strategy in Lidcombe involves understanding monthly ADR fluctuations. The Average Daily Rate (ADR) for Airbnb in Lidcombe typically peaks in December and dips lowest during August. Leveraging Airbnb dynamic pricing tools or strategies based on this seasonality can significantly boost revenue. Here's a look at the typical nightly rates achieved:
- Best-in-class properties (Top 10%) command rates of $269+ per night, often due to premium features or locations.
- Strong performing properties (Top 25%) achieve nightly rates of $228 or more.
- Typical properties (Median) charge around $187 per night.
- Entry-level properties (Bottom 25%) earn around $147 per night.
Average Daily Rate (ADR) Trend by Month in Lidcombe
Get Live Lidcombe Market Intelligence 👇
Explore Real-time Analytics
Airbnb Seasonality Analysis & Trends in Lidcombe (2026)
Peak Season (December, November, October)
- Revenue averages $3,299 per month
- Occupancy rates average 45.2%
- Daily rates average $229
Shoulder Season
- Revenue averages $2,006 per month
- Occupancy maintains around 35.3%
- Daily rates hold near $189
Low Season (February, March, April)
- Revenue drops to average $0 per month
- Occupancy decreases to average 0.0%
- Daily rates adjust to average $183
Seasonality Insights for Lidcombe
- The Airbnb seasonality in Lidcombe shows highly seasonal trends requiring careful strategy. While the sections above show seasonal averages, it's also insightful to look at the extremes:
- During the high season, the absolute peak month showcases Lidcombe's highest earning potential, with monthly revenues capable of climbing to $3,773, occupancy reaching a high of 49.1%, and ADRs peaking at $242.
- Conversely, the slowest single month of the year, typically falling within the low season, marks the market's lowest point. In this month, revenue might dip to $0, occupancy could drop to 0.0%, and ADRs may adjust down to $170.
- Understanding both the seasonal averages and these monthly peaks and troughs in revenue, occupancy, and ADR is crucial for maximizing your Airbnb profit potential in Lidcombe.
Seasonal Strategies for Maximizing Profit
- Peak Season: Maximize revenue through premium pricing and potentially longer minimum stays. Ensure high availability.
- Low Season: Offer competitive pricing, special promotions (e.g., extended stay discounts), and flexible cancellation policies. Target off-season travelers like remote workers or budget-conscious guests.
- Shoulder Seasons: Implement dynamic pricing that balances peak and low rates. Target weekend travelers or specific events. Offer slightly more flexible terms than peak season.
- Regularly analyze your own performance against these Lidcombe seasonality benchmarks and adjust your pricing and availability strategy accordingly.
Best Areas for Airbnb Investment in Lidcombe (2026)
Exploring the top neighborhoods for short-term rentals in Lidcombe? This section highlights key areas, outlining why they are attractive for hosts and guests, along with notable local attractions. Consider these locations based on your target guest profile and investment strategy.
| Neighborhood / Area | Why Host Here? (Target Guests & Appeal) | Key Attractions & Landmarks |
|---|---|---|
| Lidcombe Central | Lidcombe Central is a vibrant area with a range of shopping and dining options. Its proximity to public transport, especially the Lidcombe train station, makes it a prime location for visitors exploring Sydney. | Lidcombe Shopping Centre, Lidcombe Railway Station, Hyde Park, Sydney Olympic Park, Digger's Club |
| Sydney Olympic Park | Located just a short distance from Lidcombe, this area is known for the major sports and entertainment venues. It attracts both event attendees and families looking for accommodation during large events. | ANZ Stadium, Sydney Showground, Bicentennial Park, Australian PlantBank, The Armory |
| Auburn | Auburn is a diverse suburb with rich cultural offerings and a bustling food scene. Its close proximity to Lidcombe makes it an attractive investment area for Airbnb hosts targeting international visitors. | Auburn Botanic Gardens, Auburn Central Shopping Centre, Local Food Markets, Auburn Gallipoli Mosque, Parramatta River |
| Berala | Berala is a quieter suburb that provides a local experience while being easily accessible via train. It's a preferred option for travelers looking for affordable accommodations near Sydney without the chaos of the city. | Berala Village, Local parks, Easy public transport access to Sydney, Westfield Parramatta, Sefton Golf Club |
| Regents Park | Known for its residential charm and proximity to parks, this area appeals to families and visitors seeking a suburban feel while remaining close to urban conveniences. | Regents Park, Regents Park Golf Course, Local cafes, Public transport access, Historical sites |
| Chipping Norton | This suburb along the Georges River offers scenic views and recreational activities. It attracts families and nature lovers who want a peaceful getaway near Lidcombe. | Chipping Norton Lakes, George’s River National Park, Local dining options, Fishing spots, Cycling trails |
| Strathfield | Strathfield is known for its high diversity and access to amenities including parks and shopping centers. It’s a sought-after suburb for both holidaymakers and business travelers. | Strathfield Plaza, Centennial Plaza, Local parks and gardens, Strathfield Station, Barker Street |
| Granville | Granville is a bustling area with great food options and cultural diversity. Its high visibility and transport links make it a strategic choice for renting on platforms like Airbnb. | Granville Town Centre, Local markets, Granville Railway Station, Parramatta River, Community events |
Understanding Airbnb License Requirements & STR Laws in Lidcombe (2026)
Yes, Lidcombe, New South Wales, Australia enforces high STR regulations. Obtaining a license and ensuring compliance is almost certainly required according to current 2026 STR laws. Always verify the latest short term rental regulations and Airbnb license requirements directly with local government authorities for Lidcombe to ensure full compliance before hosting.
(Source: AirROI data, 2026, based on 74% licensed listings)
Top Performing Airbnb Properties in Lidcombe (2026)
Benchmark your potential! Explore examples of top-performing Airbnb properties in Lidcombebased on Trailing Twelve Month (TTM) revenue. Analyze their characteristics, revenue, occupancy rate, and ADR to understand what drives success in this market.
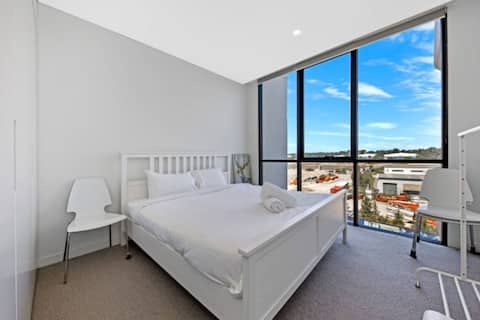
2BR Apartment in Lidcombe – Near Olympic Park
Entire Place • 2 bedrooms
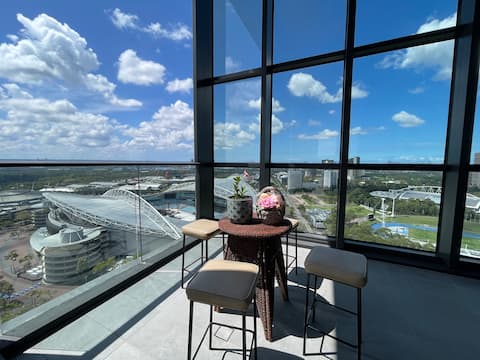
Skyline&Stadium views 3b2b2p Apt in Olympic Park
Entire Place • 3 bedrooms
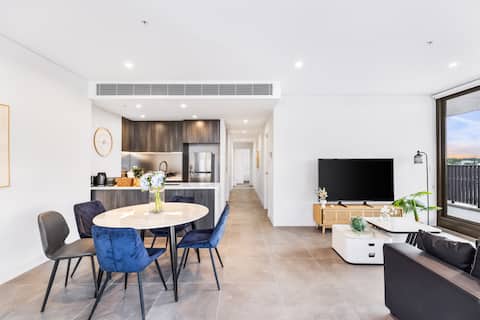
3BR apartment close to Accor Stadium
Entire Place • 3 bedrooms

Stadium View Oasis 2BRwParking
Entire Place • 2 bedrooms
Olympic Park Delight -2 Bdrm - Parking- Aircon
Entire Place • 2 bedrooms
2BR apartment close to Accor Stadium
Entire Place • 2 bedrooms
Note: Performance varies based on location, size, amenities, seasonality, and management quality. Data reflects the past 12 months.
Top Performing Airbnb Hosts in Lidcombe (2026)
Learn from the best! This table showcases top-performing Airbnb hosts in Lidcombe based on the number of properties managed and estimated total revenue over the past year. Analyze their scale and performance metrics.
| Host Name | Properties | Grossing Revenue | Stay Reviews | Avg Rating |
|---|---|---|---|---|
| Jiajing | 2 | $73,053 | 42 | 4.79/5.0 |
| Karolyn | 2 | $60,685 | 40 | 4.99/5.0 |
| Xian | 2 | $55,426 | 42 | 4.89/5.0 |
| Vb | 1 | $48,435 | 39 | 4.46/5.0 |
| Sophia | 1 | $47,874 | 26 | 4.96/5.0 |
| Claire | 3 | $38,347 | 15 | 5.00/5.0 |
| Alexi Stays | 1 | $33,225 | 13 | 5.00/5.0 |
| Ma | 1 | $30,366 | 13 | 4.85/5.0 |
| David | 1 | $23,745 | 29 | 5.00/5.0 |
| Stella | 2 | $20,602 | 8 | 5.00/5.0 |
Analyzing the strategies of top hosts, such as their property selection, pricing, and guest communication, can offer valuable lessons for optimizing your own Airbnb operations in Lidcombe.
Dive Deeper: Advanced Lidcombe STR Market Data (2026)
Ready to unlock more insights? AirROI provides access to advanced metrics and comprehensive Airbnb data for Lidcombe. Explore detailed analytics beyond this report to refine your investment strategy, optimize pricing, and maximize your vacation rental profits.
Explore Advanced MetricsLidcombe Short-Term Rental Market Composition (2026): Property & Room Types
Room Type Distribution
Property Type Distribution
Market Composition Insights for Lidcombe
- The Lidcombe Airbnb market composition is heavily skewed towards Entire Home/Apt listings, which make up 96.8% of the 31 active rentals. This indicates strong guest preference for privacy and space.
- Looking at the property type distribution in Lidcombe, Apartment/Condo properties are the most common (100%), reflecting the local real estate landscape.
Lidcombe Airbnb Room Capacity Analysis (2026): Bedroom Distribution
Distribution of Listings by Number of Bedrooms
Room Capacity Insights for Lidcombe
- The dominant room capacity in Lidcombe is 2 bedrooms listings, making up 74.2% of the market. This suggests a strong demand for properties suitable for couples or solo travelers.
- Together, 2 bedrooms and 1 bedroom properties represent 90.3% of the active Airbnb listings in Lidcombe, indicating a high concentration in these sizes.
- Listings with 3+ bedrooms (9.7%) represent a smaller niche, potentially indicating an underserved market for larger group accommodations in Lidcombe.
Lidcombe Vacation Rental Guest Capacity Trends (2026)
Distribution of Listings by Guest Capacity
Guest Capacity Insights for Lidcombe
- The most common guest capacity trend in Lidcombe vacation rentals is listings accommodating 4 guests (54.8%). This suggests the primary traveler segment is likely small families or groups.
- Properties designed for 4 guests and 5 guests dominate the Lidcombe STR market, accounting for 74.2% of listings.
- 12.9% of properties accommodate 6+ guests, serving the market segment for larger families or group travel in Lidcombe.
- On average, properties in Lidcombe are equipped to host 4.2 guests.
Lidcombe Airbnb Booking Patterns (2026): Available vs. Booked Days
Available Days Distribution
Booked Days Distribution
Booking Pattern Insights for Lidcombe
- The most common availability pattern in Lidcombe falls within the 271-366 days range, representing 64.5% of listings. This suggests many properties have significant open periods on their calendars.
- Approximately 93.5% of listings show high availability (181+ days open annually), indicating potential for increased bookings or specific owner usage patterns.
- For booked days, the 31-90 days range is most frequent in Lidcombe (54.8%), reflecting common guest stay durations or potential owner blocking patterns.
- A notable 9.7% of properties secure long booking periods (181+ days booked per year), highlighting successful long-term rental strategies or significant owner usage.
Lidcombe Airbnb Minimum Stay Requirements Analysis
Distribution of Listings by Minimum Night Requirement
1 Night
7 listings
22.6% of total
2 Nights
3 listings
9.7% of total
7-29 Nights
9 listings
29% of total
30+ Nights
12 listings
38.7% of total
Key Insights
- The most prevalent minimum stay requirement in Lidcombe is 30+ Nights, adopted by 38.7% of listings. This highlights the market's preference for longer commitments.
- A significant segment (38.7%) caters to monthly stays (30+ nights) in Lidcombe, pointing to opportunities in the extended-stay market.
Recommendations
- Align with the market by considering a 30+ Nights minimum stay, as 38.7% of Lidcombe hosts use this setting.
- If feasible, allowing 1-night stays, especially midweek or during low season, could capture last-minute bookings, as only 22.6% currently do.
- Explore offering discounts for stays of 30+ nights to attract the 38.7% of the market seeking extended stays.
- Adjust minimum nights based on seasonality – potentially shorter during low season and longer during peak demand periods in Lidcombe.
Lidcombe Airbnb Cancellation Policy Trends Analysis (2026)
Limited
1 listings
3.2% of total
Flexible
2 listings
6.5% of total
Firm
19 listings
61.3% of total
Strict
9 listings
29% of total
Cancellation Policy Insights for Lidcombe
- The prevailing Airbnb cancellation policy trend in Lidcombe is Firm, used by 61.3% of listings.
- A majority (90.3%) of hosts in Lidcombe utilize Firm or Strict policies, indicating a market where hosts prioritize booking security.
Recommendations for Hosts
- Consider adopting a Firm policy to align with the 61.3% market standard in Lidcombe.
- Regularly review your cancellation policy against competitors and market demand shifts in Lidcombe.
Lidcombe STR Booking Lead Time Analysis (2026)
Average Booking Lead Time by Month
Booking Lead Time Insights for Lidcombe
- The overall average booking lead time for vacation rentals in Lidcombe is 47 days.
- Guests book furthest in advance for stays during November (average 98 days), likely coinciding with peak travel demand or local events.
- The shortest booking windows occur for stays in April (average 0 days), indicating more last-minute travel plans during this time.
- Seasonally, Fall (75 days avg.) sees the longest lead times, while Spring (1 days avg.) has the shortest, reflecting typical travel planning cycles.
Recommendations for Hosts
- Use the overall average lead time (47 days) as a baseline for your pricing and availability strategy in Lidcombe.
- For November stays, consider implementing length-of-stay discounts or slightly higher rates for bookings made less than 98 days out to capitalize on advance planning.
- During April, focus on last-minute booking availability and promotions, as guests book with very short notice (0 days avg.).
- Target marketing efforts for the Fall season well in advance (at least 75 days) to capture early planners.
- Monitor your own booking lead times against these Lidcombe averages to identify opportunities for dynamic pricing adjustments.
Popular & Essential Airbnb Amenities in Lidcombe (2026)
Amenity Prevalence
Amenity Insights for Lidcombe
- Essential amenities in Lidcombe that guests expect include: Kitchen, Wifi, Smoke alarm, Washer, Microwave, Air conditioning, Refrigerator. Lacking these (any) could significantly impact bookings.
- Popular amenities like Dryer, TV, Shampoo are common but not universal. Offering these can provide a competitive edge.
Recommendations for Hosts
- Ensure your listing includes all essential amenities for Lidcombe: Kitchen, Wifi, Smoke alarm, Washer, Microwave, Air conditioning, Refrigerator.
- Prioritize adding missing essentials: Microwave, Air conditioning, Refrigerator.
- Consider adding popular differentiators like Dryer or TV to increase appeal.
- Highlight unique or less common amenities you offer (e.g., hot tub, dedicated workspace, EV charger) in your listing description and photos.
- Regularly check competitor amenities in Lidcombe to stay competitive.
Lidcombe Airbnb Guest Demographics & Profile Analysis (2026)
Guest Profile Summary for Lidcombe
- The typical guest profile for Airbnb in Lidcombe consists of primarily domestic travelers (79%), often arriving from nearby Canberra, typically belonging to the Post-2000s (Gen Z/Alpha) group (50%), primarily speaking English or Chinese.
- Domestic travelers account for 79.1% of guests.
- Key international markets include Australia (79.1%) and China (4.9%).
- Top languages spoken are English (59.3%) followed by Chinese (12.3%).
- A significant demographic segment is the Post-2000s (Gen Z/Alpha) group, representing 50% of guests.
Recommendations for Hosts
- Target domestic marketing efforts towards travelers from Canberra and New South Wales.
- Tailor amenities and listing descriptions to appeal to the dominant Post-2000s (Gen Z/Alpha) demographic (e.g., highlight fast WiFi, smart home features, local guides).
- Highlight unique local experiences or amenities relevant to the primary guest profile.
- Consider seasonal promotions aligned with peak travel times for key origin markets.
Nearby Short-Term Rental Market Comparison
How does the Lidcombe Airbnb market stack up against its neighbors? Compare key performance metrics like average monthly revenue, ADR, and occupancy rates in surrounding areas to understand the broader regional STR landscape.
| Market | Active Properties | Monthly Revenue | Daily Rate | Avg. Occupancy |
|---|---|---|---|---|
| Berry | 118 | $5,709 | $559.76 | 40% |
| Dawes Point | 10 | $5,632 | $415.45 | 62% |
| Millers Point | 16 | $5,345 | $388.13 | 62% |
| Burrawang | 12 | $5,242 | $557.61 | 38% |
| Penrose | 13 | $5,227 | $681.36 | 40% |
| Nulkaba | 41 | $4,609 | $574.24 | 31% |
| Exeter | 34 | $4,551 | $515.98 | 41% |
| Jaspers Brush | 15 | $4,452 | $445.36 | 34% |
| The Council of the Municipality of Kiama | 109 | $4,372 | $437.99 | 42% |
| Robertson | 46 | $4,320 | $396.04 | 39% |