Lightning Ridge Airbnb Market Analysis 2025: Short Term Rental Data & Vacation Rental Statistics in New South Wales, Australia
Is Airbnb profitable in Lightning Ridge in 2025? Explore comprehensive Airbnb analytics for Lightning Ridge, New South Wales, Australia to uncover income potential. This 2025 STR market report for Lightning Ridge, based on AirROI data from October 2024 to September 2025, reveals key trends in the niche market of 17 active listings.
Whether you're considering an Airbnb investment in Lightning Ridge, optimizing your existing vacation rental, or exploring rental arbitrage opportunities, understanding the Lightning Ridge Airbnb data is crucial. Navigating the high regulation landscape is key to maximizing your short term rental income potential. Let's dive into the specifics.
Key Lightning Ridge Airbnb Performance Metrics Overview
Monthly Airbnb Revenue Variations & Income Potential in Lightning Ridge (2025)
Understanding the monthly revenue variations for Airbnb listings in Lightning Ridge is key to maximizing your short term rental income potential. Seasonality significantly impacts earnings. Our analysis, based on data from the past 12 months, shows that the peak revenue month for STRs in Lightning Ridge is typically July, while November often presents the lowest earnings, highlighting opportunities for strategic pricing adjustments during shoulder and low seasons. Explore the typical Airbnb income in Lightning Ridge across different performance tiers:
- Best-in-class properties (Top 10%) achieve $3,123+ monthly, often utilizing dynamic pricing and superior guest experiences.
- Strong performing properties (Top 25%) earn $2,289 or more, indicating effective management and desirable locations/amenities.
- Typical properties (Median) generate around $1,415 per month, representing the average market performance.
- Entry-level properties (Bottom 25%) see earnings around $850, often with potential for optimization.
Average Monthly Airbnb Earnings Trend in Lightning Ridge
Lightning Ridge Airbnb Occupancy Rate Trends (2025)
Maximize your bookings by understanding the Lightning Ridge STR occupancy trends. Seasonal demand shifts significantly influence how often properties are booked. Typically, Julysees the highest demand (peak season occupancy), while November experiences the lowest (low season). Effective strategies, like adjusting minimum stays or offering promotions, can boost occupancy during slower periods. Here's how different property tiers perform in Lightning Ridge:
- Best-in-class properties (Top 10%) achieve 75%+ occupancy, indicating high desirability and potentially optimized availability.
- Strong performing properties (Top 25%) maintain 61% or higher occupancy, suggesting good market fit and guest satisfaction.
- Typical properties (Median) have an occupancy rate around 43%.
- Entry-level properties (Bottom 25%) average 24% occupancy, potentially facing higher vacancy.
Average Monthly Occupancy Rate Trend in Lightning Ridge
Average Daily Rate (ADR) Airbnb Trends in Lightning Ridge (2025)
Effective short term rental pricing strategy in Lightning Ridge involves understanding monthly ADR fluctuations. The Average Daily Rate (ADR) for Airbnb in Lightning Ridge typically peaks in September and dips lowest during February. Leveraging Airbnb dynamic pricing tools or strategies based on this seasonality can significantly boost revenue. Here's a look at the typical nightly rates achieved:
- Best-in-class properties (Top 10%) command rates of $193+ per night, often due to premium features or locations.
- Strong performing properties (Top 25%) achieve nightly rates of $139 or more.
- Typical properties (Median) charge around $119 per night.
- Entry-level properties (Bottom 25%) earn around $94 per night.
Average Daily Rate (ADR) Trend by Month in Lightning Ridge
Get Live Lightning Ridge Market Intelligence 👇
Explore Real-time Analytics
Airbnb Seasonality Analysis & Trends in Lightning Ridge (2025)
Peak Season (July, October, September)
- Revenue averages $2,264 per month
- Occupancy rates average 56.9%
- Daily rates average $128
Shoulder Season
- Revenue averages $1,627 per month
- Occupancy maintains around 43.5%
- Daily rates hold near $125
Low Season (March, August, November)
- Revenue drops to average $1,190 per month
- Occupancy decreases to average 33.6%
- Daily rates adjust to average $125
Seasonality Insights for Lightning Ridge
- The Airbnb seasonality in Lightning Ridge shows highly seasonal trends requiring careful strategy. While the sections above show seasonal averages, it's also insightful to look at the extremes:
- During the high season, the absolute peak month showcases Lightning Ridge's highest earning potential, with monthly revenues capable of climbing to $2,472, occupancy reaching a high of 60.1%, and ADRs peaking at $130.
- Conversely, the slowest single month of the year, typically falling within the low season, marks the market's lowest point. In this month, revenue might dip to $1,044, occupancy could drop to 30.0%, and ADRs may adjust down to $120.
- Understanding both the seasonal averages and these monthly peaks and troughs in revenue, occupancy, and ADR is crucial for maximizing your Airbnb profit potential in Lightning Ridge.
Seasonal Strategies for Maximizing Profit
- Peak Season: Maximize revenue through premium pricing and potentially longer minimum stays. Ensure high availability.
- Low Season: Offer competitive pricing, special promotions (e.g., extended stay discounts), and flexible cancellation policies. Target off-season travelers like remote workers or budget-conscious guests.
- Shoulder Seasons: Implement dynamic pricing that balances peak and low rates. Target weekend travelers or specific events. Offer slightly more flexible terms than peak season.
- Regularly analyze your own performance against these Lightning Ridge seasonality benchmarks and adjust your pricing and availability strategy accordingly.
Best Areas for Airbnb Investment in Lightning Ridge (2025)
Exploring the top neighborhoods for short-term rentals in Lightning Ridge? This section highlights key areas, outlining why they are attractive for hosts and guests, along with notable local attractions. Consider these locations based on your target guest profile and investment strategy.
| Neighborhood / Area | Why Host Here? (Target Guests & Appeal) | Key Attractions & Landmarks |
|---|---|---|
| Lightning Ridge Village | The heart of Lightning Ridge, known for its opal mining and unique underground homes. A popular destination for tourists interested in gem hunting and experiencing the town's quirky culture. | Big Opal, Lightning Ridge Opal Mines, The Artesian Baths, The Underground Motel, The Lightning Ridge Historical Society |
| Johns Hill | A scenic area offering stunning views of the surrounding opal fields, ideal for visitors looking for a tranquil stay close to nature. Great for nature enthusiasts and families. | Johns Hill Lookout, Opal Mine Tours, Nature Walks, Picnic Spots |
| Glen Innes Road | A convenient area for travelers passing through Lightning Ridge, with access to essential services and accommodations. Ideal for short stops and quick visits. | Shops and local services, Easy access to nearby attractions |
| Border Loop | Nestled on the outskirts, this area provides a more secluded experience, perfect for visitors seeking quiet and privacy in their stay while being close to town. | Scenic views, Wildlife watching, Camping spots |
| The Ridge Opal Fields | This area is famous for its opal mining sites and is perfect for adventurous tourists looking to dig for opals themselves. Offers unique lodging opportunities. | Opal mining experiences, Dig Your Own Opal sites, Opal festivals, Community events |
| The Cowra Sands | A less commercialized area with a focus on nature and outdoor activities, attracting those looking for a rustic Australian experience. | Nature walks, Bird watching, Fishing |
| Lightning Ridge Hot Springs | A popular relaxing destination featuring natural thermal spring baths, attracting visitors looking to unwind and experience local wellness culture. | Hot Springs, Spa resorts, Natural pools |
| Opal Caravan Park | A budget-friendly option for families and groups, this area provides basic amenities and a sense of community among fellow travelers, making it an ideal choice for longer stays. | Caravan facilities, Community events, Close to opal fields |
Understanding Airbnb License Requirements & STR Laws in Lightning Ridge (2025)
Yes, Lightning Ridge, New South Wales, Australia enforces high STR regulations. Obtaining a license and ensuring compliance is almost certainly required according to current 2025 STR laws. Always verify the latest short term rental regulations and Airbnb license requirements directly with local government authorities for Lightning Ridge to ensure full compliance before hosting.
(Source: AirROI data, 2025, based on 82% licensed listings)
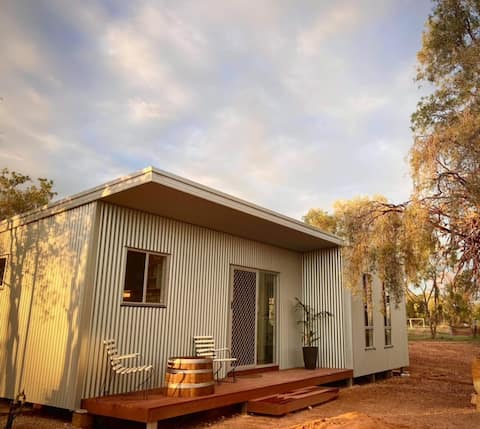
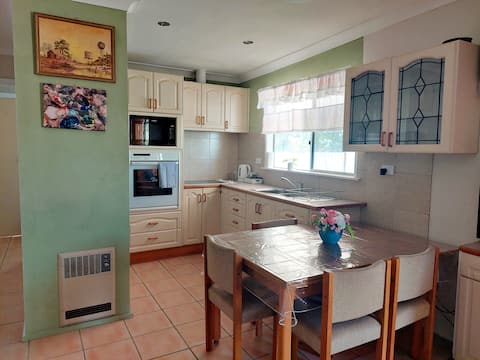
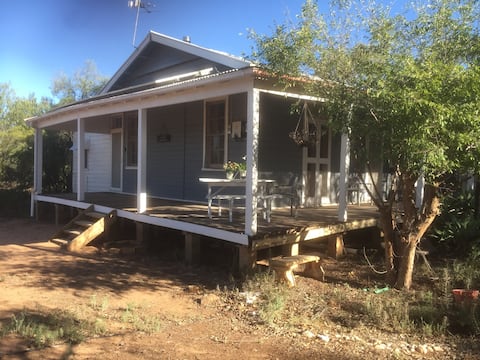
Top Performing Airbnb Properties in Lightning Ridge (2025)
Benchmark your potential! Explore examples of top-performing Airbnb properties in Lightning Ridgebased on Trailing Twelve Month (TTM) revenue. Analyze their characteristics, revenue, occupancy rate, and ADR to understand what drives success in this market.
"Bagala Cottage" 5 star comfort on an opal field!
Entire Place • N/A
The Weekender
Entire Place • 2 bedrooms
The Old School House
Entire Place • 4 bedrooms
Comfy & Spacious 3 Bedroom Private Home
Entire Place • 3 bedrooms
Pet friendly cheerful home
Entire Place • 2 bedrooms
♜ Experience rustic Royalty in your Castle kingdom
Entire Place • 4 bedrooms
Note: Performance varies based on location, size, amenities, seasonality, and management quality. Data reflects the past 12 months.
Top Performing Airbnb Hosts in Lightning Ridge (2025)
Learn from the best! This table showcases top-performing Airbnb hosts in Lightning Ridge based on the number of properties managed and estimated total revenue over the past year. Analyze their scale and performance metrics.
| Host Name | Properties | Grossing Revenue | Stay Reviews | Avg Rating |
|---|---|---|---|---|
| Rebel | 5 | $51,694 | 570 | 4.79/5.0 |
| Leigh | 1 | $37,209 | 84 | 4.95/5.0 |
| Richard | 1 | $27,463 | 68 | 4.93/5.0 |
| Marianne | 1 | $25,735 | 364 | 4.72/5.0 |
| Marina | 1 | $24,362 | 276 | 4.73/5.0 |
| Sonja | 1 | $22,936 | 129 | 4.85/5.0 |
| Cindy | 1 | $19,678 | 54 | 4.94/5.0 |
| Carinya | 3 | $19,159 | 6 | 5.00/5.0 |
| Marija | 1 | $8,633 | 4 | 5.00/5.0 |
| Rebecca | 1 | $5,946 | 80 | 4.61/5.0 |
Analyzing the strategies of top hosts, such as their property selection, pricing, and guest communication, can offer valuable lessons for optimizing your own Airbnb operations in Lightning Ridge.
Dive Deeper: Advanced Lightning Ridge STR Market Data (2025)
Ready to unlock more insights? AirROI provides access to advanced metrics and comprehensive Airbnb data for Lightning Ridge. Explore detailed analytics beyond this report to refine your investment strategy, optimize pricing, and maximize your vacation rental profits.
Explore Advanced MetricsLightning Ridge Short-Term Rental Market Composition (2025): Property & Room Types
Room Type Distribution
Property Type Distribution
Market Composition Insights for Lightning Ridge
- The Lightning Ridge Airbnb market composition is heavily skewed towards Entire Home/Apt listings, which make up 100% of the 17 active rentals. This indicates strong guest preference for privacy and space.
- Looking at the property type distribution in Lightning Ridge, House properties are the most common (52.9%), reflecting the local real estate landscape.
- Houses represent a significant 52.9% portion, catering likely to families or larger groups.
- The presence of 11.8% Hotel/Boutique listings indicates integration with traditional hospitality.
Lightning Ridge Airbnb Room Capacity Analysis (2025): Bedroom Distribution
Distribution of Listings by Number of Bedrooms
Room Capacity Insights for Lightning Ridge
- The dominant room capacity in Lightning Ridge is 2 bedrooms listings, making up 41.2% of the market. This suggests a strong demand for properties suitable for couples or solo travelers.
- Together, 2 bedrooms and 1 bedroom properties represent 70.6% of the active Airbnb listings in Lightning Ridge, indicating a high concentration in these sizes.
Lightning Ridge Vacation Rental Guest Capacity Trends (2025)
Distribution of Listings by Guest Capacity
Guest Capacity Insights for Lightning Ridge
- The most common guest capacity trend in Lightning Ridge vacation rentals is listings accommodating 4 guests (35.3%). This suggests the primary traveler segment is likely small families or groups.
- Properties designed for 4 guests and 6 guests dominate the Lightning Ridge STR market, accounting for 52.9% of listings.
- 29.4% of properties accommodate 6+ guests, serving the market segment for larger families or group travel in Lightning Ridge.
- On average, properties in Lightning Ridge are equipped to host 4.2 guests.
Lightning Ridge Airbnb Booking Patterns (2025): Available vs. Booked Days
Available Days Distribution
Booked Days Distribution
Booking Pattern Insights for Lightning Ridge
- The most common availability pattern in Lightning Ridge falls within the 271-366 days range, representing 58.8% of listings. This suggests many properties have significant open periods on their calendars.
- Approximately 76.4% of listings show high availability (181+ days open annually), indicating potential for increased bookings or specific owner usage patterns.
- For booked days, the 31-90 days range is most frequent in Lightning Ridge (41.2%), reflecting common guest stay durations or potential owner blocking patterns.
- A notable 29.4% of properties secure long booking periods (181+ days booked per year), highlighting successful long-term rental strategies or significant owner usage.
Lightning Ridge Airbnb Minimum Stay Requirements Analysis
Distribution of Listings by Minimum Night Requirement
1 Night
2 listings
11.8% of total
2 Nights
8 listings
47.1% of total
4-6 Nights
1 listings
5.9% of total
30+ Nights
6 listings
35.3% of total
Key Insights
- The most prevalent minimum stay requirement in Lightning Ridge is 2 Nights, adopted by 47.1% of listings. This highlights the market's preference for shorter, flexible bookings.
- A significant segment (35.3%) caters to monthly stays (30+ nights) in Lightning Ridge, pointing to opportunities in the extended-stay market.
Recommendations
- Align with the market by considering a 2 Nights minimum stay, as 47.1% of Lightning Ridge hosts use this setting.
- If feasible, allowing 1-night stays, especially midweek or during low season, could capture last-minute bookings, as only 11.8% currently do.
- A 2-night minimum appears standard (47.1%). Consider this for weekends or peak periods.
- Explore offering discounts for stays of 30+ nights to attract the 35.3% of the market seeking extended stays.
- Adjust minimum nights based on seasonality – potentially shorter during low season and longer during peak demand periods in Lightning Ridge.
Lightning Ridge Airbnb Cancellation Policy Trends Analysis (2025)
Flexible
3 listings
17.6% of total
Moderate
10 listings
58.8% of total
Firm
1 listings
5.9% of total
Strict
3 listings
17.6% of total
Cancellation Policy Insights for Lightning Ridge
- The prevailing Airbnb cancellation policy trend in Lightning Ridge is Moderate, used by 58.8% of listings.
- The market strongly favors guest-friendly terms, with 76.4% of listings offering Flexible or Moderate policies. This suggests guests in Lightning Ridge may expect booking flexibility.
Recommendations for Hosts
- Consider adopting a Moderate policy to align with the 58.8% market standard in Lightning Ridge.
- Regularly review your cancellation policy against competitors and market demand shifts in Lightning Ridge.
Lightning Ridge STR Booking Lead Time Analysis (2025)
Average Booking Lead Time by Month
Booking Lead Time Insights for Lightning Ridge
- The overall average booking lead time for vacation rentals in Lightning Ridge is 49 days.
- Guests book furthest in advance for stays during July (average 77 days), likely coinciding with peak travel demand or local events.
- The shortest booking windows occur for stays in November (average 18 days), indicating more last-minute travel plans during this time.
- Seasonally, Summer (57 days avg.) sees the longest lead times, while Winter (33 days avg.) has the shortest, reflecting typical travel planning cycles.
Recommendations for Hosts
- Use the overall average lead time (49 days) as a baseline for your pricing and availability strategy in Lightning Ridge.
- For July stays, consider implementing length-of-stay discounts or slightly higher rates for bookings made less than 77 days out to capitalize on advance planning.
- Target marketing efforts for the Summer season well in advance (at least 57 days) to capture early planners.
- Monitor your own booking lead times against these Lightning Ridge averages to identify opportunities for dynamic pricing adjustments.
Popular & Essential Airbnb Amenities in Lightning Ridge (2025)
Amenity Prevalence
Amenity Insights for Lightning Ridge
- Essential amenities in Lightning Ridge that guests expect include: Dishes and silverware, Smoke alarm, Free parking on premises. Lacking these (any) could significantly impact bookings.
- Popular amenities like Cooking basics, Hot water, Refrigerator are common but not universal. Offering these can provide a competitive edge.
Recommendations for Hosts
- Ensure your listing includes all essential amenities for Lightning Ridge: Dishes and silverware, Smoke alarm, Free parking on premises.
- Consider adding popular differentiators like Cooking basics or Hot water to increase appeal.
- Highlight unique or less common amenities you offer (e.g., hot tub, dedicated workspace, EV charger) in your listing description and photos.
- Regularly check competitor amenities in Lightning Ridge to stay competitive.
Lightning Ridge Airbnb Guest Demographics & Profile Analysis (2025)
Guest Profile Summary for Lightning Ridge
- The typical guest profile for Airbnb in Lightning Ridge consists of primarily domestic travelers (92%), often arriving from nearby Sydney, typically belonging to the Post-2000s (Gen Z/Alpha) group (50%), primarily speaking English or German.
- Domestic travelers account for 91.9% of guests.
- Key international markets include Australia (91.9%) and United Kingdom (3%).
- Top languages spoken are English (65.7%) followed by German (4.5%).
- A significant demographic segment is the Post-2000s (Gen Z/Alpha) group, representing 50% of guests.
Recommendations for Hosts
- Target domestic marketing efforts towards travelers from Sydney and New South Wales.
- Tailor amenities and listing descriptions to appeal to the dominant Post-2000s (Gen Z/Alpha) demographic (e.g., highlight fast WiFi, smart home features, local guides).
- Highlight unique local experiences or amenities relevant to the primary guest profile.
- Consider seasonal promotions aligned with peak travel times for key origin markets.
Nearby Short-Term Rental Market Comparison
How does the Lightning Ridge Airbnb market stack up against its neighbors? Compare key performance metrics like average monthly revenue, ADR, and occupancy rates in surrounding areas to understand the broader regional STR landscape.
| Market | Active Properties | Monthly Revenue | Daily Rate | Avg. Occupancy |
|---|---|---|---|---|
| Narrabri | 14 | $1,542 | $163.92 | 36% |