Liverpool Airbnb Market Analysis 2026: Short Term Rental Data & Vacation Rental Statistics in New South Wales, Australia
Is Airbnb profitable in Liverpool in 2026? Explore comprehensive Airbnb analytics for Liverpool, New South Wales, Australia to uncover income potential. This 2026 STR market report for Liverpool, based on AirROI data from February 2025 to January 2026, reveals key trends in the niche market of 21 active listings.
Whether you're considering an Airbnb investment in Liverpool, optimizing your existing vacation rental, or exploring rental arbitrage opportunities, understanding the Liverpool Airbnb data is crucial. Navigating the high regulation landscape is key to maximizing your short term rental income potential. Let's dive into the specifics.
Key Liverpool Airbnb Performance Metrics Overview
Monthly Airbnb Revenue Variations & Income Potential in Liverpool (2026)
Understanding the monthly revenue variations for Airbnb listings in Liverpool is key to maximizing your short term rental income potential. Seasonality significantly impacts earnings. Our analysis, based on data from the past 12 months, shows that the peak revenue month for STRs in Liverpool is typically June, while May often presents the lowest earnings, highlighting opportunities for strategic pricing adjustments during shoulder and low seasons. Explore the typical Airbnb income in Liverpool across different performance tiers:
- Best-in-class properties (Top 10%) achieve $4,114+ monthly, often utilizing dynamic pricing and superior guest experiences.
- Strong performing properties (Top 25%) earn $2,547 or more, indicating effective management and desirable locations/amenities.
- Typical properties (Median) generate around $1,219 per month, representing the average market performance.
- Entry-level properties (Bottom 25%) see earnings around $616, often with potential for optimization.
Average Monthly Airbnb Earnings Trend in Liverpool
Liverpool Airbnb Occupancy Rate Trends (2026)
Maximize your bookings by understanding the Liverpool STR occupancy trends. Seasonal demand shifts significantly influence how often properties are booked. Typically, Octobersees the highest demand (peak season occupancy), while May experiences the lowest (low season). Effective strategies, like adjusting minimum stays or offering promotions, can boost occupancy during slower periods. Here's how different property tiers perform in Liverpool:
- Best-in-class properties (Top 10%) achieve 71%+ occupancy, indicating high desirability and potentially optimized availability.
- Strong performing properties (Top 25%) maintain 59% or higher occupancy, suggesting good market fit and guest satisfaction.
- Typical properties (Median) have an occupancy rate around 33%.
- Entry-level properties (Bottom 25%) average 21% occupancy, potentially facing higher vacancy.
Average Monthly Occupancy Rate Trend in Liverpool
Average Daily Rate (ADR) Airbnb Trends in Liverpool (2026)
Effective short term rental pricing strategy in Liverpool involves understanding monthly ADR fluctuations. The Average Daily Rate (ADR) for Airbnb in Liverpool typically peaks in December and dips lowest during August. Leveraging Airbnb dynamic pricing tools or strategies based on this seasonality can significantly boost revenue. Here's a look at the typical nightly rates achieved:
- Best-in-class properties (Top 10%) command rates of $272+ per night, often due to premium features or locations.
- Strong performing properties (Top 25%) achieve nightly rates of $176 or more.
- Typical properties (Median) charge around $126 per night.
- Entry-level properties (Bottom 25%) earn around $52 per night.
Average Daily Rate (ADR) Trend by Month in Liverpool
Get Live Liverpool Market Intelligence 👇
Explore Real-time Analytics
Airbnb Seasonality Analysis & Trends in Liverpool (2026)
Peak Season (June, October, November)
- Revenue averages $2,433 per month
- Occupancy rates average 47.9%
- Daily rates average $151
Shoulder Season
- Revenue averages $1,315 per month
- Occupancy maintains around 35.0%
- Daily rates hold near $143
Low Season (February, March, April)
- Revenue drops to average $0 per month
- Occupancy decreases to average 0.0%
- Daily rates adjust to average $133
Seasonality Insights for Liverpool
- The Airbnb seasonality in Liverpool shows highly seasonal trends requiring careful strategy. While the sections above show seasonal averages, it's also insightful to look at the extremes:
- During the high season, the absolute peak month showcases Liverpool's highest earning potential, with monthly revenues capable of climbing to $2,802, occupancy reaching a high of 49.4%, and ADRs peaking at $172.
- Conversely, the slowest single month of the year, typically falling within the low season, marks the market's lowest point. In this month, revenue might dip to $0, occupancy could drop to 0.0%, and ADRs may adjust down to $122.
- Understanding both the seasonal averages and these monthly peaks and troughs in revenue, occupancy, and ADR is crucial for maximizing your Airbnb profit potential in Liverpool.
Seasonal Strategies for Maximizing Profit
- Peak Season: Maximize revenue through premium pricing and potentially longer minimum stays. Ensure high availability.
- Low Season: Offer competitive pricing, special promotions (e.g., extended stay discounts), and flexible cancellation policies. Target off-season travelers like remote workers or budget-conscious guests.
- Shoulder Seasons: Implement dynamic pricing that balances peak and low rates. Target weekend travelers or specific events. Offer slightly more flexible terms than peak season.
- Regularly analyze your own performance against these Liverpool seasonality benchmarks and adjust your pricing and availability strategy accordingly.
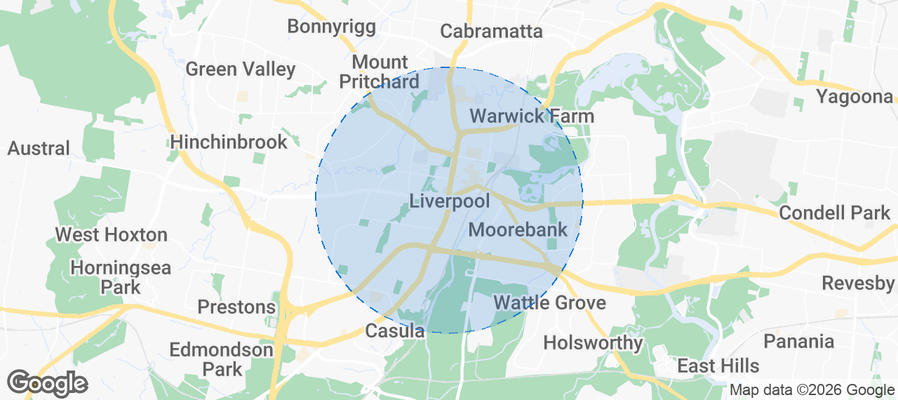
Best Areas for Airbnb Investment in Liverpool (2026)
Exploring the top neighborhoods for short-term rentals in Liverpool? This section highlights key areas, outlining why they are attractive for hosts and guests, along with notable local attractions. Consider these locations based on your target guest profile and investment strategy.
| Neighborhood / Area | Why Host Here? (Target Guests & Appeal) | Key Attractions & Landmarks |
|---|---|---|
| Liverpool City Centre | The vibrant heart of Liverpool, bustling with shops, restaurants and entertainment. A popular spot for tourists visiting the numerous attractions nearby. | Westfield Liverpool, Liverpool Hospital, Bigge Park, Catherine Fields, The Liverpool Golf Club |
| Carnes Hill | A family-friendly suburb with access to parks and local amenities. Ideal for families and longer stays with a laid-back atmosphere. | Carnes Hill Marketplace, Eagle Vale Marketplace, Sports Fields, Parks, Local cafes |
| Hoxton Park | A suburban area offering good transport links to the city and surrounding areas. Attractive for travelers looking for quieter stays with local charm. | Hoxton Park Reserve, Local Shopping Centres, Transport Facilities, Parks and Leisure Areas |
| Lurnea | A peaceful residential area with a mix of families and retirees. Offers a homey feel and access to local amenities. | Lurnea High School, Local Shops, Parks, Reserves, Community Centre |
| Chipping Norton | Known for its waterfront parklands and recreational facilities, it's a great spot for outdoor lovers and families. | Chipping Norton Lake, Local Parks, Exercise Trails, Sports Facilities |
| Warwick Farm | An emerging suburb with a mix of old and new, offering good access to public transport and local amenities. | Warwick Farm Racecourse, Local Parks, Shopping Options, Community Services, Transport Links |
| Milperra | A quiet suburb that offers a mix of residential living and nature, making it ideal for travelers seeking peace and quiet. | Milperra Nature Reserve, Local Shops, Transport Access, Community Parks |
| Casula | A growing suburb close to major roads and public transport, making it convenient for travelers to explore greater Sydney. | Casula Mall, Local Parks, Transport Connections, Community Facilities |
Understanding Airbnb License Requirements & STR Laws in Liverpool (2026)
Yes, Liverpool, New South Wales, Australia enforces high STR regulations. Obtaining a license and ensuring compliance is almost certainly required according to current 2026 STR laws. Always verify the latest short term rental regulations and Airbnb license requirements directly with local government authorities for Liverpool to ensure full compliance before hosting.
(Source: AirROI data, 2026, based on 86% licensed listings)
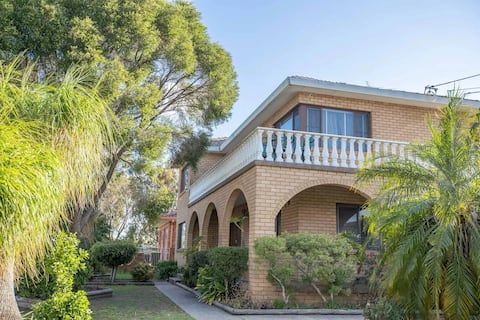
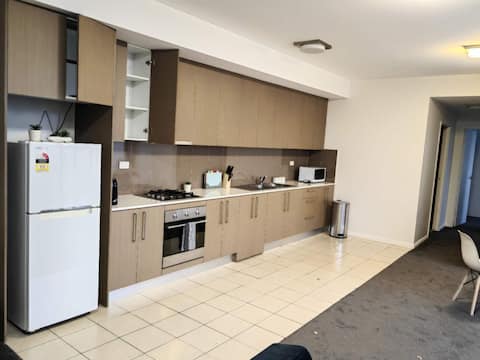
Top Performing Airbnb Properties in Liverpool (2026)
Benchmark your potential! Explore examples of top-performing Airbnb properties in Liverpoolbased on Trailing Twelve Month (TTM) revenue. Analyze their characteristics, revenue, occupancy rate, and ADR to understand what drives success in this market.
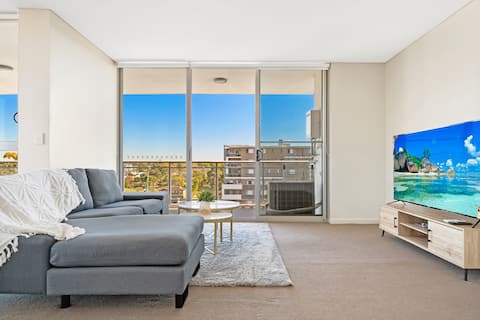
Amazing scene/ 2Br Apt / Shopping/Train/Hospital
Entire Place • 2 bedrooms
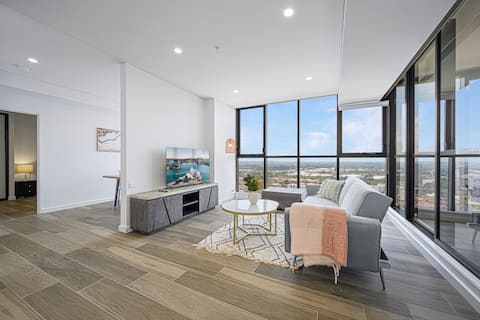
Liverpool Central Apartment | 2 Bedrooms 2 Bathrooms | Free WiFi & Parking | Near Train Station & Sh
Entire Place • 2 bedrooms
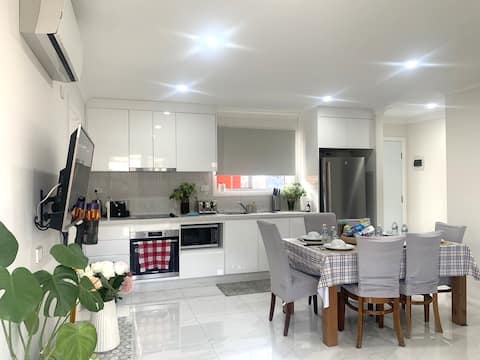
Helen's Cosy House In Liverpool
Entire Place • 3 bedrooms
Grand Family Group Holiday House Free Parking MU
Entire Place • 5 bedrooms

Spacious 3 bedrooms House Free on site parking AN
Entire Place • 3 bedrooms
Two-bedroom apartment in Liverpool
Entire Place • 2 bedrooms
Note: Performance varies based on location, size, amenities, seasonality, and management quality. Data reflects the past 12 months.
Top Performing Airbnb Hosts in Liverpool (2026)
Learn from the best! This table showcases top-performing Airbnb hosts in Liverpool based on the number of properties managed and estimated total revenue over the past year. Analyze their scale and performance metrics.
| Host Name | Properties | Grossing Revenue | Stay Reviews | Avg Rating |
|---|---|---|---|---|
| Warren | 6 | $72,252 | 22 | 3.95/5.0 |
| Liquan | 9 | $35,574 | 44 | 4.34/5.0 |
| Miranda | 1 | $29,849 | 15 | 4.87/5.0 |
| Vivian | 1 | $26,884 | 9 | 3.89/5.0 |
| Helen'S House | 1 | $23,846 | 13 | 4.92/5.0 |
| Anita | 1 | $14,111 | 15 | 4.40/5.0 |
| Chun | 1 | $2,358 | 3 | 3.00/5.0 |
| Xian | 1 | $1,988 | 2 | Not Rated |
Analyzing the strategies of top hosts, such as their property selection, pricing, and guest communication, can offer valuable lessons for optimizing your own Airbnb operations in Liverpool.
Dive Deeper: Advanced Liverpool STR Market Data (2026)
Ready to unlock more insights? AirROI provides access to advanced metrics and comprehensive Airbnb data for Liverpool. Explore detailed analytics beyond this report to refine your investment strategy, optimize pricing, and maximize your vacation rental profits.
Explore Advanced MetricsLiverpool Short-Term Rental Market Composition (2026): Property & Room Types
Room Type Distribution
Property Type Distribution
Market Composition Insights for Liverpool
- The Liverpool Airbnb market composition is heavily skewed towards Entire Home/Apt listings, which make up 57.1% of the 21 active rentals. This indicates strong guest preference for privacy and space.
- However, a notable 42.9% share for Private Rooms suggests opportunities for budget-conscious travelers or hosts renting out spare rooms.
- Looking at the property type distribution in Liverpool, House properties are the most common (57.1%), reflecting the local real estate landscape.
- Houses represent a significant 57.1% portion, catering likely to families or larger groups.
- The presence of 19% Hotel/Boutique listings indicates integration with traditional hospitality.
Liverpool Airbnb Room Capacity Analysis (2026): Bedroom Distribution
Distribution of Listings by Number of Bedrooms
Room Capacity Insights for Liverpool
- The dominant room capacity in Liverpool is 2 bedrooms listings, making up 23.8% of the market. This suggests a strong demand for properties suitable for couples or solo travelers.
- Together, 2 bedrooms and 1 bedroom properties represent 38.1% of the active Airbnb listings in Liverpool, indicating a high concentration in these sizes.
Liverpool Vacation Rental Guest Capacity Trends (2026)
Distribution of Listings by Guest Capacity
Guest Capacity Insights for Liverpool
- The most common guest capacity trend in Liverpool vacation rentals is listings accommodating 5 guests (19%). This suggests the primary traveler segment is likely larger groups.
- Properties designed for 5 guests and 4 guests dominate the Liverpool STR market, accounting for 33.3% of listings.
- 14.3% of properties accommodate 6+ guests, serving the market segment for larger families or group travel in Liverpool.
- On average, properties in Liverpool are equipped to host 2.9 guests.
Liverpool Airbnb Booking Patterns (2026): Available vs. Booked Days
Available Days Distribution
Booked Days Distribution
Booking Pattern Insights for Liverpool
- The most common availability pattern in Liverpool falls within the 271-366 days range, representing 76.2% of listings. This suggests many properties have significant open periods on their calendars.
- Approximately 100.0% of listings show high availability (181+ days open annually), indicating potential for increased bookings or specific owner usage patterns.
- For booked days, the 31-90 days range is most frequent in Liverpool (61.9%), reflecting common guest stay durations or potential owner blocking patterns.
Liverpool Airbnb Minimum Stay Requirements Analysis
Distribution of Listings by Minimum Night Requirement
1 Night
6 listings
28.6% of total
2 Nights
5 listings
23.8% of total
30+ Nights
10 listings
47.6% of total
Key Insights
- The most prevalent minimum stay requirement in Liverpool is 30+ Nights, adopted by 47.6% of listings. This highlights the market's preference for longer commitments.
- A significant segment (47.6%) caters to monthly stays (30+ nights) in Liverpool, pointing to opportunities in the extended-stay market.
Recommendations
- Align with the market by considering a 30+ Nights minimum stay, as 47.6% of Liverpool hosts use this setting.
- If feasible, allowing 1-night stays, especially midweek or during low season, could capture last-minute bookings, as only 28.6% currently do.
- Explore offering discounts for stays of 30+ nights to attract the 47.6% of the market seeking extended stays.
- Adjust minimum nights based on seasonality – potentially shorter during low season and longer during peak demand periods in Liverpool.
Liverpool Airbnb Cancellation Policy Trends Analysis (2026)
Flexible
9 listings
42.9% of total
Moderate
7 listings
33.3% of total
Firm
5 listings
23.8% of total
Cancellation Policy Insights for Liverpool
- The prevailing Airbnb cancellation policy trend in Liverpool is Flexible, used by 42.9% of listings.
- The market strongly favors guest-friendly terms, with 76.2% of listings offering Flexible or Moderate policies. This suggests guests in Liverpool may expect booking flexibility.
Recommendations for Hosts
- Consider adopting a Flexible policy to align with the 42.9% market standard in Liverpool.
- Regularly review your cancellation policy against competitors and market demand shifts in Liverpool.
Liverpool STR Booking Lead Time Analysis (2026)
Average Booking Lead Time by Month
Booking Lead Time Insights for Liverpool
- The overall average booking lead time for vacation rentals in Liverpool is 11 days.
- Guests book furthest in advance for stays during January (average 26 days), likely coinciding with peak travel demand or local events.
- The shortest booking windows occur for stays in April (average 0 days), indicating more last-minute travel plans during this time.
- Seasonally, Winter (17 days avg.) sees the longest lead times, while Spring (0 days avg.) has the shortest, reflecting typical travel planning cycles.
Recommendations for Hosts
- Use the overall average lead time (11 days) as a baseline for your pricing and availability strategy in Liverpool.
- For January stays, consider implementing length-of-stay discounts or slightly higher rates for bookings made less than 26 days out to capitalize on advance planning.
- During April, focus on last-minute booking availability and promotions, as guests book with very short notice (0 days avg.).
- Target marketing efforts for the Winter season well in advance (at least 17 days) to capture early planners.
- Monitor your own booking lead times against these Liverpool averages to identify opportunities for dynamic pricing adjustments.
Popular & Essential Airbnb Amenities in Liverpool (2026)
Amenity Prevalence
Amenity Insights for Liverpool
- Essential amenities in Liverpool that guests expect include: Washer, Wifi, Hot water, Microwave, Dishes and silverware, Smoke alarm, Hair dryer, Kitchen, Shampoo. Lacking these (any) could significantly impact bookings.
- Popular amenities like Shower gel are common but not universal. Offering these can provide a competitive edge.
Recommendations for Hosts
- Ensure your listing includes all essential amenities for Liverpool: Washer, Wifi, Hot water, Microwave, Dishes and silverware, Smoke alarm, Hair dryer, Kitchen, Shampoo.
- Prioritize adding missing essentials: Microwave, Dishes and silverware, Smoke alarm, Hair dryer, Kitchen, Shampoo.
- Consider adding popular differentiators like Shower gel to increase appeal.
- Highlight unique or less common amenities you offer (e.g., hot tub, dedicated workspace, EV charger) in your listing description and photos.
- Regularly check competitor amenities in Liverpool to stay competitive.
Liverpool Airbnb Guest Demographics & Profile Analysis (2026)
Guest Profile Summary for Liverpool
- The typical guest profile for Airbnb in Liverpool consists of primarily domestic travelers (80%), often arriving from nearby Brisbane City, typically belonging to the Post-2000s (Gen Z/Alpha) group (50%), primarily speaking English or Hindi.
- Domestic travelers account for 80.0% of guests.
- Key international markets include Australia (80%) and Brazil (2.9%).
- Top languages spoken are English (61.1%) followed by Hindi (11.1%).
- A significant demographic segment is the Post-2000s (Gen Z/Alpha) group, representing 50% of guests.
Recommendations for Hosts
- Target domestic marketing efforts towards travelers from Brisbane City and Cocoroc.
- Tailor amenities and listing descriptions to appeal to the dominant Post-2000s (Gen Z/Alpha) demographic (e.g., highlight fast WiFi, smart home features, local guides).
- Highlight unique local experiences or amenities relevant to the primary guest profile.
- Consider seasonal promotions aligned with peak travel times for key origin markets.
Nearby Short-Term Rental Market Comparison
How does the Liverpool Airbnb market stack up against its neighbors? Compare key performance metrics like average monthly revenue, ADR, and occupancy rates in surrounding areas to understand the broader regional STR landscape.
| Market | Active Properties | Monthly Revenue | Daily Rate | Avg. Occupancy |
|---|---|---|---|---|
| Berry | 118 | $5,709 | $559.76 | 40% |
| Dawes Point | 10 | $5,632 | $415.45 | 62% |
| Millers Point | 16 | $5,345 | $388.13 | 62% |
| Burrawang | 12 | $5,242 | $557.61 | 38% |
| Penrose | 13 | $5,227 | $681.36 | 40% |
| Nulkaba | 41 | $4,609 | $574.24 | 31% |
| Exeter | 34 | $4,551 | $515.98 | 41% |
| Jaspers Brush | 15 | $4,452 | $445.36 | 34% |
| The Council of the Municipality of Kiama | 109 | $4,372 | $437.99 | 42% |
| Robertson | 46 | $4,320 | $396.04 | 39% |