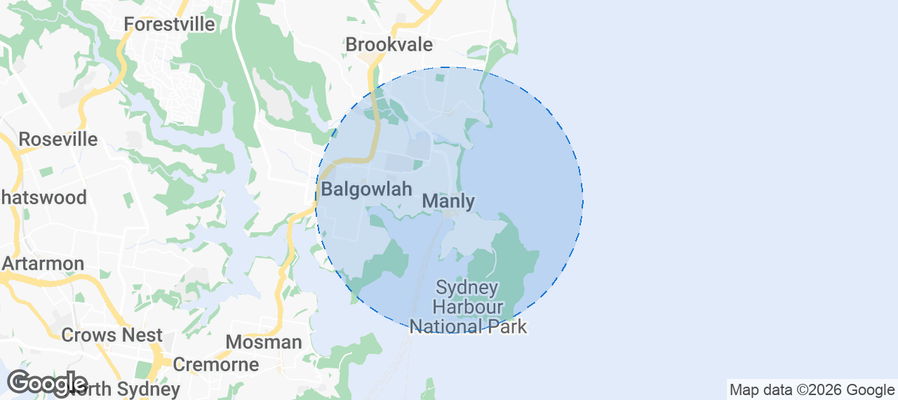
Manly Airbnb Market Analysis 2026: Short Term Rental Data & Vacation Rental Statistics in New South Wales, Australia
Is Airbnb profitable in Manly in 2026? Explore comprehensive Airbnb analytics for Manly, New South Wales, Australia to uncover income potential. This 2026 STR market report for Manly, based on AirROI data from February 2025 to January 2026, reveals key trends in the niche market of 25 active listings.
Whether you're considering an Airbnb investment in Manly, optimizing your existing vacation rental, or exploring rental arbitrage opportunities, understanding the Manly Airbnb data is crucial. Navigating the high regulation landscape is key to maximizing your short term rental income potential. Let's dive into the specifics.
Key Manly Airbnb Performance Metrics Overview
Monthly Airbnb Revenue Variations & Income Potential in Manly (2026)
Understanding the monthly revenue variations for Airbnb listings in Manly is key to maximizing your short term rental income potential. Seasonality significantly impacts earnings. Our analysis, based on data from the past 12 months, shows that the peak revenue month for STRs in Manly is typically November, while May often presents the lowest earnings, highlighting opportunities for strategic pricing adjustments during shoulder and low seasons. Explore the typical Airbnb income in Manly across different performance tiers:
- Best-in-class properties (Top 10%) achieve $7,639+ monthly, often utilizing dynamic pricing and superior guest experiences.
- Strong performing properties (Top 25%) earn $5,100 or more, indicating effective management and desirable locations/amenities.
- Typical properties (Median) generate around $3,700 per month, representing the average market performance.
- Entry-level properties (Bottom 25%) see earnings around $2,042, often with potential for optimization.
Average Monthly Airbnb Earnings Trend in Manly
Manly Airbnb Occupancy Rate Trends (2026)
Maximize your bookings by understanding the Manly STR occupancy trends. Seasonal demand shifts significantly influence how often properties are booked. Typically, Novembersees the highest demand (peak season occupancy), while May experiences the lowest (low season). Effective strategies, like adjusting minimum stays or offering promotions, can boost occupancy during slower periods. Here's how different property tiers perform in Manly:
- Best-in-class properties (Top 10%) achieve 76%+ occupancy, indicating high desirability and potentially optimized availability.
- Strong performing properties (Top 25%) maintain 67% or higher occupancy, suggesting good market fit and guest satisfaction.
- Typical properties (Median) have an occupancy rate around 52%.
- Entry-level properties (Bottom 25%) average 29% occupancy, potentially facing higher vacancy.
Average Monthly Occupancy Rate Trend in Manly
Average Daily Rate (ADR) Airbnb Trends in Manly (2026)
Effective short term rental pricing strategy in Manly involves understanding monthly ADR fluctuations. The Average Daily Rate (ADR) for Airbnb in Manly typically peaks in December and dips lowest during August. Leveraging Airbnb dynamic pricing tools or strategies based on this seasonality can significantly boost revenue. Here's a look at the typical nightly rates achieved:
- Best-in-class properties (Top 10%) command rates of $412+ per night, often due to premium features or locations.
- Strong performing properties (Top 25%) achieve nightly rates of $297 or more.
- Typical properties (Median) charge around $227 per night.
- Entry-level properties (Bottom 25%) earn around $171 per night.
Average Daily Rate (ADR) Trend by Month in Manly
Get Live Manly Market Intelligence 👇
Explore Real-time Analytics
Airbnb Seasonality Analysis & Trends in Manly (2026)
Peak Season (November, December, October)
- Revenue averages $6,139 per month
- Occupancy rates average 63.9%
- Daily rates average $316
Shoulder Season
- Revenue averages $3,017 per month
- Occupancy maintains around 41.5%
- Daily rates hold near $230
Low Season (February, March, April)
- Revenue drops to average $0 per month
- Occupancy decreases to average 0.0%
- Daily rates adjust to average $213
Seasonality Insights for Manly
- The Airbnb seasonality in Manly shows highly seasonal trends requiring careful strategy. While the sections above show seasonal averages, it's also insightful to look at the extremes:
- During the high season, the absolute peak month showcases Manly's highest earning potential, with monthly revenues capable of climbing to $6,189, occupancy reaching a high of 67.3%, and ADRs peaking at $329.
- Conversely, the slowest single month of the year, typically falling within the low season, marks the market's lowest point. In this month, revenue might dip to $0, occupancy could drop to 0.0%, and ADRs may adjust down to $192.
- Understanding both the seasonal averages and these monthly peaks and troughs in revenue, occupancy, and ADR is crucial for maximizing your Airbnb profit potential in Manly.
Seasonal Strategies for Maximizing Profit
- Peak Season: Maximize revenue through premium pricing and potentially longer minimum stays. Ensure high availability.
- Low Season: Offer competitive pricing, special promotions (e.g., extended stay discounts), and flexible cancellation policies. Target off-season travelers like remote workers or budget-conscious guests.
- Shoulder Seasons: Implement dynamic pricing that balances peak and low rates. Target weekend travelers or specific events. Offer slightly more flexible terms than peak season.
- Regularly analyze your own performance against these Manly seasonality benchmarks and adjust your pricing and availability strategy accordingly.
Best Areas for Airbnb Investment in Manly (2026)
Exploring the top neighborhoods for short-term rentals in Manly? This section highlights key areas, outlining why they are attractive for hosts and guests, along with notable local attractions. Consider these locations based on your target guest profile and investment strategy.
| Neighborhood / Area | Why Host Here? (Target Guests & Appeal) | Key Attractions & Landmarks |
|---|---|---|
| Manly Beach | Famous for its stunning beaches, surf culture, and vibrant atmosphere. Ideal for tourists and beach lovers looking for a seaside getaway with plenty of outdoor activities. | Manly Beach, North Head Sanctuary, Shelly Beach, Manly Sea Life Sanctuary, Manly Corso |
| Manly Harbour | A picturesque spot with beautiful views of the harbour and access to various water activities. Great for families and those interested in a quieter, more scenic experience. | Manly Wharf, Manly Scenic Walkway, The Spit, Fairy Bower, Manly Art Gallery and Museum |
| The Corso | A lively thoroughfare that connects Manly Beach to the ferry terminal. Offers shopping, dining, and entertainment, making it a vibrant area for tourists. | The Corso, Manly Markets, Restaurants and cafes, Manly Beach Esplanade, Manly Oceanly |
| Shelly Beach | A more serene beach experience known for its snorkeling and marine life. Attracts visitors looking for relaxation and nature. | Shelly Beach, Cabbage Tree Bay, Snorkeling tours, Coastal walks, The Bower Restaurant |
| North Manly | A residential area with proximity to both beaches and local amenities, perfect for families and long-term visitors looking for a less touristy experience. | North Manly Beach, Local parks, Freshwater Beach, Shopping centers, Cafes and restaurants |
| Queenscliff | Close to Manly Beach yet quieter, this area is favored by surfers and locals. Great for those looking to stay near the beach without the hustle and bustle. | Queenscliff Beach, North Steyne Beach, Surf clubs, Local cafes, Coastal walks |
| Collaroy | A bit further north, this suburb offers beautiful beaches and a family-friendly vibe. It attracts surfers and visitors looking for a peaceful retreat. | Collaroy Beach, Long Reef, Collaroy Cinema, Local shops, Families parks |
| Little Manly | A hidden gem with a relaxed atmosphere and family-friendly areas. It's perfect for those wanting a quieter stay close to the beach. | Little Manly Beach, Manly Yacht Club, Local parks, Coastal walks, Picnic areas |
Understanding Airbnb License Requirements & STR Laws in Manly (2026)
Yes, Manly, New South Wales, Australia enforces high STR regulations. Obtaining a license and ensuring compliance is almost certainly required according to current 2026 STR laws. Always verify the latest short term rental regulations and Airbnb license requirements directly with local government authorities for Manly to ensure full compliance before hosting.
(Source: AirROI data, 2026, based on 92% licensed listings)
Top Performing Airbnb Properties in Manly (2026)
Benchmark your potential! Explore examples of top-performing Airbnb properties in Manlybased on Trailing Twelve Month (TTM) revenue. Analyze their characteristics, revenue, occupancy rate, and ADR to understand what drives success in this market.
Ocean Vistas, Manly IH
Entire Place • 4 bedrooms
Aquamarine on Fairy Bower
Entire Place • 2 bedrooms
Marvelous Manly Home moments from the Beach - NEW
Entire Place • 3 bedrooms

Beachfront Getaway
Entire Place • 2 bedrooms
Best Beachfront Location - Beach Views Every Room
Entire Place • 2 bedrooms
Sunny Manly Escape | 2 min walk to beach
Entire Place • 2 bedrooms
Note: Performance varies based on location, size, amenities, seasonality, and management quality. Data reflects the past 12 months.
Top Performing Airbnb Hosts in Manly (2026)
Learn from the best! This table showcases top-performing Airbnb hosts in Manly based on the number of properties managed and estimated total revenue over the past year. Analyze their scale and performance metrics.
| Host Name | Properties | Grossing Revenue | Stay Reviews | Avg Rating |
|---|---|---|---|---|
| Ashlee | 3 | $148,481 | 56 | 4.95/5.0 |
| Wonder View Stays | 3 | $92,666 | 55 | 4.69/5.0 |
| L'Abode Accommodation Speciali | 1 | $75,196 | 7 | 4.86/5.0 |
| Short Term Accommodation Manag | 1 | $65,676 | 6 | 5.00/5.0 |
| Beach Stays | 1 | $59,924 | 2 | Not Rated |
| Toni | 1 | $53,354 | 8 | 5.00/5.0 |
| Elena | 1 | $48,965 | 16 | 4.94/5.0 |
| Laurie | 2 | $41,749 | 78 | 4.57/5.0 |
| Cash | 1 | $38,202 | 27 | 4.74/5.0 |
| Julien | 1 | $36,243 | 15 | 4.80/5.0 |
Analyzing the strategies of top hosts, such as their property selection, pricing, and guest communication, can offer valuable lessons for optimizing your own Airbnb operations in Manly.
Dive Deeper: Advanced Manly STR Market Data (2026)
Ready to unlock more insights? AirROI provides access to advanced metrics and comprehensive Airbnb data for Manly. Explore detailed analytics beyond this report to refine your investment strategy, optimize pricing, and maximize your vacation rental profits.
Explore Advanced MetricsManly Short-Term Rental Market Composition (2026): Property & Room Types
Room Type Distribution
Property Type Distribution
Market Composition Insights for Manly
- The Manly Airbnb market composition is heavily skewed towards Entire Home/Apt listings, which make up 96% of the 25 active rentals. This indicates strong guest preference for privacy and space.
- Looking at the property type distribution in Manly, Apartment/Condo properties are the most common (88%), reflecting the local real estate landscape.
- Smaller segments like others (combined 4.0%) offer potential for unique stay experiences.
Manly Airbnb Room Capacity Analysis (2026): Bedroom Distribution
Distribution of Listings by Number of Bedrooms
Room Capacity Insights for Manly
- The dominant room capacity in Manly is 1 bedroom listings, making up 48% of the market. This suggests a strong demand for properties suitable for couples or solo travelers.
- Together, 1 bedroom and 2 bedrooms properties represent 84.0% of the active Airbnb listings in Manly, indicating a high concentration in these sizes.
- Listings with 3+ bedrooms (8.0%) represent a smaller niche, potentially indicating an underserved market for larger group accommodations in Manly.
Manly Vacation Rental Guest Capacity Trends (2026)
Distribution of Listings by Guest Capacity
Guest Capacity Insights for Manly
- The most common guest capacity trend in Manly vacation rentals is listings accommodating 4 guests (40%). This suggests the primary traveler segment is likely small families or groups.
- Properties designed for 4 guests and 2 guests dominate the Manly STR market, accounting for 72.0% of listings.
- 12.0% of properties accommodate 6+ guests, serving the market segment for larger families or group travel in Manly.
- On average, properties in Manly are equipped to host 3.4 guests.
Manly Airbnb Booking Patterns (2026): Available vs. Booked Days
Available Days Distribution
Booked Days Distribution
Booking Pattern Insights for Manly
- The most common availability pattern in Manly falls within the 181-270 days range, representing 60% of listings. This suggests many properties have significant open periods on their calendars.
- Approximately 88.0% of listings show high availability (181+ days open annually), indicating potential for increased bookings or specific owner usage patterns.
- For booked days, the 91-180 days range is most frequent in Manly (60%), reflecting common guest stay durations or potential owner blocking patterns.
- A notable 12.0% of properties secure long booking periods (181+ days booked per year), highlighting successful long-term rental strategies or significant owner usage.
Manly Airbnb Minimum Stay Requirements Analysis
Distribution of Listings by Minimum Night Requirement
1 Night
3 listings
12% of total
2 Nights
4 listings
16% of total
3 Nights
2 listings
8% of total
4-6 Nights
1 listings
4% of total
7-29 Nights
1 listings
4% of total
30+ Nights
14 listings
56% of total
Key Insights
- The most prevalent minimum stay requirement in Manly is 30+ Nights, adopted by 56% of listings. This highlights the market's preference for longer commitments.
- A significant segment (56%) caters to monthly stays (30+ nights) in Manly, pointing to opportunities in the extended-stay market.
Recommendations
- Align with the market by considering a 30+ Nights minimum stay, as 56% of Manly hosts use this setting.
- If feasible, allowing 1-night stays, especially midweek or during low season, could capture last-minute bookings, as only 12% currently do.
- Explore offering discounts for stays of 30+ nights to attract the 56% of the market seeking extended stays.
- Adjust minimum nights based on seasonality – potentially shorter during low season and longer during peak demand periods in Manly.
Manly Airbnb Cancellation Policy Trends Analysis (2026)
Super Strict 30 Days
1 listings
4% of total
Limited
1 listings
4% of total
Super Strict 60 Days
1 listings
4% of total
Flexible
3 listings
12% of total
Moderate
5 listings
20% of total
Firm
13 listings
52% of total
Strict
1 listings
4% of total
Cancellation Policy Insights for Manly
- The prevailing Airbnb cancellation policy trend in Manly is Firm, used by 52% of listings.
- A majority (56.0%) of hosts in Manly utilize Firm or Strict policies, indicating a market where hosts prioritize booking security.
- Strict cancellation policies are quite rare (4%), potentially making listings with this policy less competitive unless justified by high demand or property type.
Recommendations for Hosts
- Consider adopting a Firm policy to align with the 52% market standard in Manly.
- Using a Strict policy might deter some guests, as only 4% of listings use it. Evaluate if potential revenue protection outweighs possible lower booking rates.
- Regularly review your cancellation policy against competitors and market demand shifts in Manly.
Manly STR Booking Lead Time Analysis (2026)
Average Booking Lead Time by Month
Booking Lead Time Insights for Manly
- The overall average booking lead time for vacation rentals in Manly is 44 days.
- Guests book furthest in advance for stays during November (average 51 days), likely coinciding with peak travel demand or local events.
- The shortest booking windows occur for stays in April (average 0 days), indicating more last-minute travel plans during this time.
- Seasonally, Fall (41 days avg.) sees the longest lead times, while Spring (1 days avg.) has the shortest, reflecting typical travel planning cycles.
Recommendations for Hosts
- Use the overall average lead time (44 days) as a baseline for your pricing and availability strategy in Manly.
- During April, focus on last-minute booking availability and promotions, as guests book with very short notice (0 days avg.).
- Target marketing efforts for the Fall season well in advance (at least 41 days) to capture early planners.
- Monitor your own booking lead times against these Manly averages to identify opportunities for dynamic pricing adjustments.
Popular & Essential Airbnb Amenities in Manly (2026)
Amenity Prevalence
Amenity Insights for Manly
- Essential amenities in Manly that guests expect include: TV. Lacking these (this) could significantly impact bookings.
- Popular amenities like Kitchen, Bed linens, Hair dryer are common but not universal. Offering these can provide a competitive edge.
- Warning: Wifi is not universally provided but is considered essential globally. Ensure reliable Wifi is offered.
Recommendations for Hosts
- Ensure your listing includes all essential amenities for Manly: TV.
- Consider adding popular differentiators like Kitchen or Bed linens to increase appeal.
- Highlight unique or less common amenities you offer (e.g., hot tub, dedicated workspace, EV charger) in your listing description and photos.
- Regularly check competitor amenities in Manly to stay competitive.
Manly Airbnb Guest Demographics & Profile Analysis (2026)
Guest Profile Summary for Manly
- The typical guest profile for Airbnb in Manly consists of a mix of domestic (65%) and international guests, often arriving from nearby Sydney, typically belonging to the Post-2000s (Gen Z/Alpha) group (50%), primarily speaking English or French.
- Domestic travelers account for 65.0% of guests.
- Key international markets include Australia (65%) and United Kingdom (13.4%).
- Top languages spoken are English (61.8%) followed by French (8.2%).
- A significant demographic segment is the Post-2000s (Gen Z/Alpha) group, representing 50% of guests.
Recommendations for Hosts
- Target domestic marketing efforts towards travelers from Sydney and Melbourne.
- Tailor amenities and listing descriptions to appeal to the dominant Post-2000s (Gen Z/Alpha) demographic (e.g., highlight fast WiFi, smart home features, local guides).
- Highlight unique local experiences or amenities relevant to the primary guest profile.
- Consider seasonal promotions aligned with peak travel times for key origin markets.
Nearby Short-Term Rental Market Comparison
How does the Manly Airbnb market stack up against its neighbors? Compare key performance metrics like average monthly revenue, ADR, and occupancy rates in surrounding areas to understand the broader regional STR landscape.
| Market | Active Properties | Monthly Revenue | Daily Rate | Avg. Occupancy |
|---|---|---|---|---|
| Berry | 118 | $5,709 | $559.76 | 40% |
| Dawes Point | 10 | $5,632 | $415.45 | 62% |
| Millers Point | 16 | $5,345 | $388.13 | 62% |
| Burrawang | 12 | $5,242 | $557.61 | 38% |
| Penrose | 13 | $5,227 | $681.36 | 40% |
| Nulkaba | 41 | $4,609 | $574.24 | 31% |
| Exeter | 34 | $4,551 | $515.98 | 41% |
| Jaspers Brush | 15 | $4,452 | $445.36 | 34% |
| The Council of the Municipality of Kiama | 109 | $4,372 | $437.99 | 42% |
| Robertson | 46 | $4,320 | $396.04 | 39% |