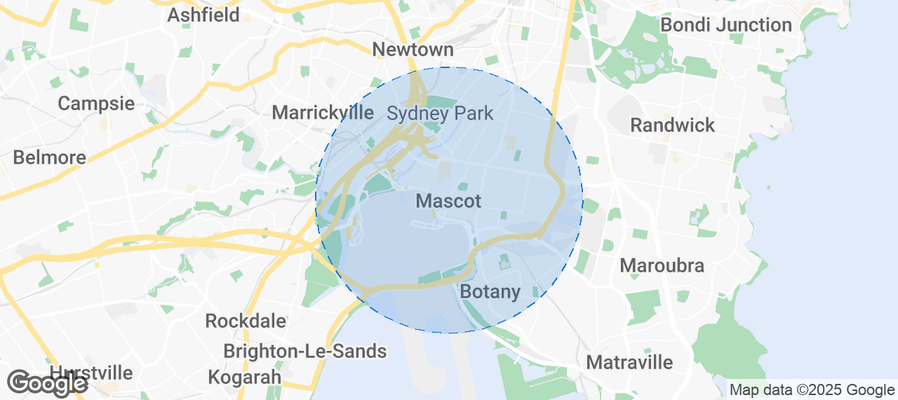
Mascot Airbnb Market Analysis 2026: Short Term Rental Data & Vacation Rental Statistics in New South Wales, Australia
Is Airbnb profitable in Mascot in 2026? Explore comprehensive Airbnb analytics for Mascot, New South Wales, Australia to uncover income potential. This 2026 STR market report for Mascot, based on AirROI data from February 2025 to January 2026, reveals key trends in the niche market of 25 active listings.
Whether you're considering an Airbnb investment in Mascot, optimizing your existing vacation rental, or exploring rental arbitrage opportunities, understanding the Mascot Airbnb data is crucial. Navigating the high regulation landscape is key to maximizing your short term rental income potential. Let's dive into the specifics.
Key Mascot Airbnb Performance Metrics Overview
Monthly Airbnb Revenue Variations & Income Potential in Mascot (2026)
Understanding the monthly revenue variations for Airbnb listings in Mascot is key to maximizing your short term rental income potential. Seasonality significantly impacts earnings. Our analysis, based on data from the past 12 months, shows that the peak revenue month for STRs in Mascot is typically November, while May often presents the lowest earnings, highlighting opportunities for strategic pricing adjustments during shoulder and low seasons. Explore the typical Airbnb income in Mascot across different performance tiers:
- Best-in-class properties (Top 10%) achieve $5,701+ monthly, often utilizing dynamic pricing and superior guest experiences.
- Strong performing properties (Top 25%) earn $4,262 or more, indicating effective management and desirable locations/amenities.
- Typical properties (Median) generate around $3,158 per month, representing the average market performance.
- Entry-level properties (Bottom 25%) see earnings around $1,306, often with potential for optimization.
Average Monthly Airbnb Earnings Trend in Mascot
Mascot Airbnb Occupancy Rate Trends (2026)
Maximize your bookings by understanding the Mascot STR occupancy trends. Seasonal demand shifts significantly influence how often properties are booked. Typically, Novembersees the highest demand (peak season occupancy), while May experiences the lowest (low season). Effective strategies, like adjusting minimum stays or offering promotions, can boost occupancy during slower periods. Here's how different property tiers perform in Mascot:
- Best-in-class properties (Top 10%) achieve 76%+ occupancy, indicating high desirability and potentially optimized availability.
- Strong performing properties (Top 25%) maintain 64% or higher occupancy, suggesting good market fit and guest satisfaction.
- Typical properties (Median) have an occupancy rate around 43%.
- Entry-level properties (Bottom 25%) average 20% occupancy, potentially facing higher vacancy.
Average Monthly Occupancy Rate Trend in Mascot
Average Daily Rate (ADR) Airbnb Trends in Mascot (2026)
Effective short term rental pricing strategy in Mascot involves understanding monthly ADR fluctuations. The Average Daily Rate (ADR) for Airbnb in Mascot typically peaks in December and dips lowest during August. Leveraging Airbnb dynamic pricing tools or strategies based on this seasonality can significantly boost revenue. Here's a look at the typical nightly rates achieved:
- Best-in-class properties (Top 10%) command rates of $303+ per night, often due to premium features or locations.
- Strong performing properties (Top 25%) achieve nightly rates of $278 or more.
- Typical properties (Median) charge around $202 per night.
- Entry-level properties (Bottom 25%) earn around $169 per night.
Average Daily Rate (ADR) Trend by Month in Mascot
Get Live Mascot Market Intelligence 👇
Explore Real-time Analytics
Airbnb Seasonality Analysis & Trends in Mascot (2026)
Peak Season (November, December, October)
- Revenue averages $4,255 per month
- Occupancy rates average 52.5%
- Daily rates average $242
Shoulder Season
- Revenue averages $2,551 per month
- Occupancy maintains around 39.0%
- Daily rates hold near $220
Low Season (February, March, April)
- Revenue drops to average $0 per month
- Occupancy decreases to average 0.0%
- Daily rates adjust to average $213
Seasonality Insights for Mascot
- The Airbnb seasonality in Mascot shows highly seasonal trends requiring careful strategy. While the sections above show seasonal averages, it's also insightful to look at the extremes:
- During the high season, the absolute peak month showcases Mascot's highest earning potential, with monthly revenues capable of climbing to $4,642, occupancy reaching a high of 62.9%, and ADRs peaking at $269.
- Conversely, the slowest single month of the year, typically falling within the low season, marks the market's lowest point. In this month, revenue might dip to $0, occupancy could drop to 0.0%, and ADRs may adjust down to $206.
- Understanding both the seasonal averages and these monthly peaks and troughs in revenue, occupancy, and ADR is crucial for maximizing your Airbnb profit potential in Mascot.
Seasonal Strategies for Maximizing Profit
- Peak Season: Maximize revenue through premium pricing and potentially longer minimum stays. Ensure high availability.
- Low Season: Offer competitive pricing, special promotions (e.g., extended stay discounts), and flexible cancellation policies. Target off-season travelers like remote workers or budget-conscious guests.
- Shoulder Seasons: Implement dynamic pricing that balances peak and low rates. Target weekend travelers or specific events. Offer slightly more flexible terms than peak season.
- Regularly analyze your own performance against these Mascot seasonality benchmarks and adjust your pricing and availability strategy accordingly.
Best Areas for Airbnb Investment in Mascot (2026)
Exploring the top neighborhoods for short-term rentals in Mascot? This section highlights key areas, outlining why they are attractive for hosts and guests, along with notable local attractions. Consider these locations based on your target guest profile and investment strategy.
| Neighborhood / Area | Why Host Here? (Target Guests & Appeal) | Key Attractions & Landmarks |
|---|---|---|
| Mascot Central | The heart of Mascot, with easy access to the airport and major transport links. Popular with travelers and business professionals due to its convenience and proximity to amenities. | Westfield Eastgardens, Mascot Park, Sydney Airport, local cafes and restaurants, Public transport links to the city |
| Botany Bay | Close to the beautiful Botany Bay, this area offers a mix of beachside relaxation and suburban charm. Great for families and beach lovers. | Botany Bay National Park, Lady Robinsons Beach, Shark Island, Gardens by the Bay, local parks and playgrounds |
| Kingsford | A vibrant suburb with a bustling atmosphere and strong student presence due to its proximity to universities. Offers lively dining and entertainment options. | University of New South Wales, Kingsford Smith Airport, local markets, cafes and restaurants on Anzac Parade, community parks |
| Eastlakes | A residential area with growing popularity for short stays, thanks to its family-friendly environment and local amenities. | Eastlakes Shopping Centre, local parks, community events, public transport to Sydney, quiet neighborhoods |
| Rosebery | Known for its industrial vibe and hip eateries, Rosebery attracts young professionals and foodies. It’s becoming a trendy spot for short stays. | The Cannery, Rosebery Park, local breweries and restaurants, art galleries, easy access to public transport |
| Airport West | Strategically located near Sydney Airport, it’s ideal for travelers needing quick airport access, making it a practical choice for Airbnb hosts. | Sydney Airport, local cafes, short drive to Botany Bay, business hotels, transport connectivity |
| Daceyville | A quiet suburb with a tight-knit community, Daceyville is appealing to those looking for a peaceful stay while being close to amenities. | Dacey Gardens, local parks, community markets, short transport to city, family-friendly environment |
| Alexandria | A growing suburb with trendy cafes, parks, and easy access to the city center, making it a hotspot for tourists and young professionals. | Sydney Park, Erskineville Village, local dining options, public transport links, art spaces and galleries |
Understanding Airbnb License Requirements & STR Laws in Mascot (2026)
Yes, Mascot, New South Wales, Australia enforces high STR regulations. Obtaining a license and ensuring compliance is almost certainly required according to current 2026 STR laws. Always verify the latest short term rental regulations and Airbnb license requirements directly with local government authorities for Mascot to ensure full compliance before hosting.
(Source: AirROI data, 2026, based on 84% licensed listings)
Top Performing Airbnb Properties in Mascot (2026)
Benchmark your potential! Explore examples of top-performing Airbnb properties in Mascotbased on Trailing Twelve Month (TTM) revenue. Analyze their characteristics, revenue, occupancy rate, and ADR to understand what drives success in this market.
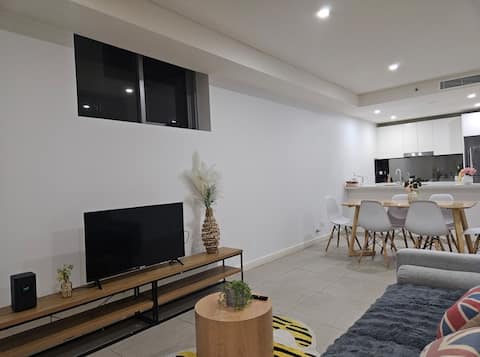
Mascot 2 bed 213 Close to station easy to anywhere
Entire Place • 2 bedrooms
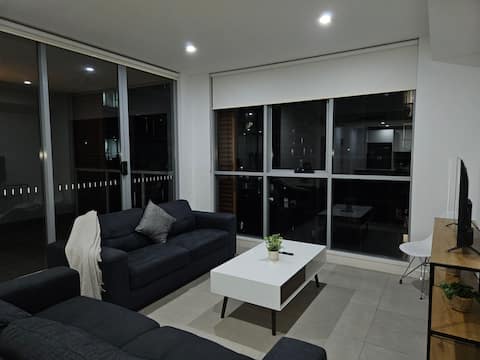
Mascot 2 beds 10 Close to station easy to anywhere
Entire Place • 2 bedrooms
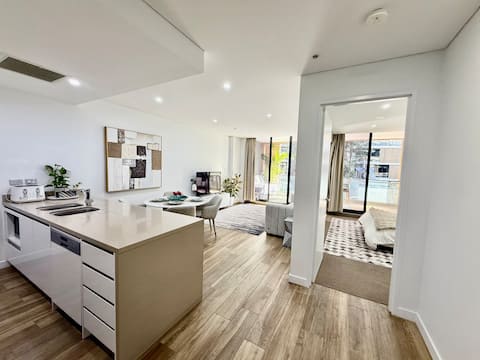
Modern 2BR near train- Food court. Free Parking
Entire Place • 2 bedrooms
Large 3-Brs Apt in a Mascot with 2x Parking
Entire Place • 3 bedrooms

Mascot 2 beds 04 Close to station easy to anywhere
Entire Place • 2 bedrooms

City - Train 5 Mins Rooftop Pool & Free Car Park
Entire Place • 2 bedrooms
Note: Performance varies based on location, size, amenities, seasonality, and management quality. Data reflects the past 12 months.
Top Performing Airbnb Hosts in Mascot (2026)
Learn from the best! This table showcases top-performing Airbnb hosts in Mascot based on the number of properties managed and estimated total revenue over the past year. Analyze their scale and performance metrics.
| Host Name | Properties | Grossing Revenue | Stay Reviews | Avg Rating |
|---|---|---|---|---|
| Vb | 5 | $171,386 | 90 | 4.41/5.0 |
| HL&JS Corporation Gallery | 3 | $78,725 | 20 | 4.30/5.0 |
| Tina | 1 | $37,723 | 46 | 4.96/5.0 |
| Milan | 1 | $35,751 | 42 | 4.48/5.0 |
| Joe | 1 | $32,672 | 17 | 4.94/5.0 |
| Jennie | 1 | $32,393 | 22 | 4.91/5.0 |
| Evan | 1 | $28,013 | 10 | 4.80/5.0 |
| Reina | 1 | $26,314 | 23 | 4.48/5.0 |
| Pan | 2 | $21,707 | 20 | 4.71/5.0 |
| Tim | 1 | $18,728 | 3 | 4.67/5.0 |
Analyzing the strategies of top hosts, such as their property selection, pricing, and guest communication, can offer valuable lessons for optimizing your own Airbnb operations in Mascot.
Dive Deeper: Advanced Mascot STR Market Data (2026)
Ready to unlock more insights? AirROI provides access to advanced metrics and comprehensive Airbnb data for Mascot. Explore detailed analytics beyond this report to refine your investment strategy, optimize pricing, and maximize your vacation rental profits.
Explore Advanced MetricsMascot Short-Term Rental Market Composition (2026): Property & Room Types
Room Type Distribution
Property Type Distribution
Market Composition Insights for Mascot
- The Mascot Airbnb market composition is heavily skewed towards Entire Home/Apt listings, which make up 96% of the 25 active rentals. This indicates strong guest preference for privacy and space.
- Looking at the property type distribution in Mascot, Apartment/Condo properties are the most common (96%), reflecting the local real estate landscape.
- Smaller segments like house (combined 4.0%) offer potential for unique stay experiences.
Mascot Airbnb Room Capacity Analysis (2026): Bedroom Distribution
Distribution of Listings by Number of Bedrooms
Room Capacity Insights for Mascot
- The dominant room capacity in Mascot is 2 bedrooms listings, making up 68% of the market. This suggests a strong demand for properties suitable for couples or solo travelers.
- Together, 2 bedrooms and 3 bedrooms properties represent 96.0% of the active Airbnb listings in Mascot, indicating a high concentration in these sizes.
- A significant 28.0% of listings offer 3+ bedrooms, catering to larger groups and families seeking more space in Mascot.
Mascot Vacation Rental Guest Capacity Trends (2026)
Distribution of Listings by Guest Capacity
Guest Capacity Insights for Mascot
- The most common guest capacity trend in Mascot vacation rentals is listings accommodating 6 guests (40%). This suggests the primary traveler segment is likely larger groups.
- Properties designed for 6 guests and 4 guests dominate the Mascot STR market, accounting for 72.0% of listings.
- 44.0% of properties accommodate 6+ guests, serving the market segment for larger families or group travel in Mascot.
- On average, properties in Mascot are equipped to host 5.0 guests.
Mascot Airbnb Booking Patterns (2026): Available vs. Booked Days
Available Days Distribution
Booked Days Distribution
Booking Pattern Insights for Mascot
- The most common availability pattern in Mascot falls within the 271-366 days range, representing 56% of listings. This suggests many properties have significant open periods on their calendars.
- Approximately 96.0% of listings show high availability (181+ days open annually), indicating potential for increased bookings or specific owner usage patterns.
- For booked days, the 31-90 days range is most frequent in Mascot (44%), reflecting common guest stay durations or potential owner blocking patterns.
- A notable 4.0% of properties secure long booking periods (181+ days booked per year), highlighting successful long-term rental strategies or significant owner usage.
Mascot Airbnb Minimum Stay Requirements Analysis
Distribution of Listings by Minimum Night Requirement
1 Night
13 listings
52% of total
2 Nights
5 listings
20% of total
4-6 Nights
1 listings
4% of total
7-29 Nights
1 listings
4% of total
30+ Nights
5 listings
20% of total
Key Insights
- The most prevalent minimum stay requirement in Mascot is 1 Night, adopted by 52% of listings. This highlights the market's preference for shorter, flexible bookings.
- A strong majority (72.0%) of the Mascot Airbnb data shows acceptance of very short stays (1-2 nights), indicating a dynamic, high-turnover market.
- A significant segment (20%) caters to monthly stays (30+ nights) in Mascot, pointing to opportunities in the extended-stay market.
Recommendations
- Align with the market by considering a 1 Night minimum stay, as 52% of Mascot hosts use this setting.
- Explore offering discounts for stays of 30+ nights to attract the 20% of the market seeking extended stays.
- Adjust minimum nights based on seasonality – potentially shorter during low season and longer during peak demand periods in Mascot.
Mascot Airbnb Cancellation Policy Trends Analysis (2026)
Flexible
1 listings
4% of total
Moderate
1 listings
4% of total
Firm
9 listings
36% of total
Strict
14 listings
56% of total
Cancellation Policy Insights for Mascot
- The prevailing Airbnb cancellation policy trend in Mascot is Strict, used by 56% of listings.
- A majority (92.0%) of hosts in Mascot utilize Firm or Strict policies, indicating a market where hosts prioritize booking security.
Recommendations for Hosts
- Consider adopting a Strict policy to align with the 56% market standard in Mascot.
- With 56% using Strict terms, this is a viable option in Mascot, particularly for high-value properties or during peak demand periods.
- Regularly review your cancellation policy against competitors and market demand shifts in Mascot.
Mascot STR Booking Lead Time Analysis (2026)
Average Booking Lead Time by Month
Booking Lead Time Insights for Mascot
- The overall average booking lead time for vacation rentals in Mascot is 29 days.
- Guests book furthest in advance for stays during December (average 71 days), likely coinciding with peak travel demand or local events.
- The shortest booking windows occur for stays in April (average 0 days), indicating more last-minute travel plans during this time.
- Seasonally, Winter (38 days avg.) sees the longest lead times, while Spring (0 days avg.) has the shortest, reflecting typical travel planning cycles.
Recommendations for Hosts
- Use the overall average lead time (29 days) as a baseline for your pricing and availability strategy in Mascot.
- For December stays, consider implementing length-of-stay discounts or slightly higher rates for bookings made less than 71 days out to capitalize on advance planning.
- During April, focus on last-minute booking availability and promotions, as guests book with very short notice (0 days avg.).
- Target marketing efforts for the Winter season well in advance (at least 38 days) to capture early planners.
- Monitor your own booking lead times against these Mascot averages to identify opportunities for dynamic pricing adjustments.
Popular & Essential Airbnb Amenities in Mascot (2026)
Amenity Prevalence
Amenity Insights for Mascot
- Essential amenities in Mascot that guests expect include: Washer, Hot water, Smoke alarm, Kitchen, Shower gel, Free parking on premises. Lacking these (any) could significantly impact bookings.
- Popular amenities like TV, Microwave, Bed linens are common but not universal. Offering these can provide a competitive edge.
Recommendations for Hosts
- Ensure your listing includes all essential amenities for Mascot: Washer, Hot water, Smoke alarm, Kitchen, Shower gel, Free parking on premises.
- Prioritize adding missing essentials: Smoke alarm, Kitchen, Shower gel, Free parking on premises.
- Consider adding popular differentiators like TV or Microwave to increase appeal.
- Highlight unique or less common amenities you offer (e.g., hot tub, dedicated workspace, EV charger) in your listing description and photos.
- Regularly check competitor amenities in Mascot to stay competitive.
Mascot Airbnb Guest Demographics & Profile Analysis (2026)
Guest Profile Summary for Mascot
- The typical guest profile for Airbnb in Mascot consists of a mix of domestic (59%) and international guests, often arriving from nearby Sydney, typically belonging to the Post-2000s (Gen Z/Alpha) group (50%), primarily speaking English or Chinese.
- Domestic travelers account for 58.5% of guests.
- Key international markets include Australia (58.5%) and China (4.9%).
- Top languages spoken are English (52%) followed by Chinese (10%).
- A significant demographic segment is the Post-2000s (Gen Z/Alpha) group, representing 50% of guests.
Recommendations for Hosts
- Balance marketing efforts between domestic and international channels based on the guest mix.
- Tailor amenities and listing descriptions to appeal to the dominant Post-2000s (Gen Z/Alpha) demographic (e.g., highlight fast WiFi, smart home features, local guides).
- Highlight unique local experiences or amenities relevant to the primary guest profile.
- Consider seasonal promotions aligned with peak travel times for key origin markets.
Nearby Short-Term Rental Market Comparison
How does the Mascot Airbnb market stack up against its neighbors? Compare key performance metrics like average monthly revenue, ADR, and occupancy rates in surrounding areas to understand the broader regional STR landscape.
| Market | Active Properties | Monthly Revenue | Daily Rate | Avg. Occupancy |
|---|---|---|---|---|
| Berry | 118 | $5,709 | $559.76 | 40% |
| Dawes Point | 10 | $5,632 | $415.45 | 62% |
| Millers Point | 16 | $5,345 | $388.13 | 62% |
| Burrawang | 12 | $5,242 | $557.61 | 38% |
| Penrose | 13 | $5,227 | $681.36 | 40% |
| Nulkaba | 41 | $4,609 | $574.24 | 31% |
| Exeter | 34 | $4,551 | $515.98 | 41% |
| Jaspers Brush | 15 | $4,452 | $445.36 | 34% |
| The Council of the Municipality of Kiama | 109 | $4,372 | $437.99 | 42% |
| Robertson | 46 | $4,320 | $396.04 | 39% |