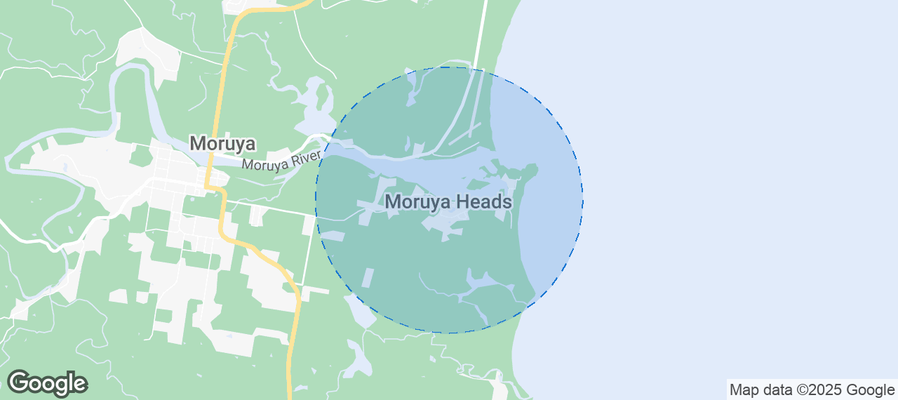
Moruya Heads Airbnb Market Analysis 2026: Short Term Rental Data & Vacation Rental Statistics in New South Wales, Australia
Is Airbnb profitable in Moruya Heads in 2026? Explore comprehensive Airbnb analytics for Moruya Heads, New South Wales, Australia to uncover income potential. This 2026 STR market report for Moruya Heads, based on AirROI data from February 2025 to January 2026, reveals key trends in the niche market of 21 active listings.
Whether you're considering an Airbnb investment in Moruya Heads, optimizing your existing vacation rental, or exploring rental arbitrage opportunities, understanding the Moruya Heads Airbnb data is crucial. Navigating the high regulation landscape is key to maximizing your short term rental income potential. Let's dive into the specifics.
Key Moruya Heads Airbnb Performance Metrics Overview
Monthly Airbnb Revenue Variations & Income Potential in Moruya Heads (2026)
Understanding the monthly revenue variations for Airbnb listings in Moruya Heads is key to maximizing your short term rental income potential. Seasonality significantly impacts earnings. Our analysis, based on data from the past 12 months, shows that the peak revenue month for STRs in Moruya Heads is typically January, while June often presents the lowest earnings, highlighting opportunities for strategic pricing adjustments during shoulder and low seasons. Explore the typical Airbnb income in Moruya Heads across different performance tiers:
- Best-in-class properties (Top 10%) achieve $6,441+ monthly, often utilizing dynamic pricing and superior guest experiences.
- Strong performing properties (Top 25%) earn $3,743 or more, indicating effective management and desirable locations/amenities.
- Typical properties (Median) generate around $1,994 per month, representing the average market performance.
- Entry-level properties (Bottom 25%) see earnings around $986, often with potential for optimization.
Average Monthly Airbnb Earnings Trend in Moruya Heads
Moruya Heads Airbnb Occupancy Rate Trends (2026)
Maximize your bookings by understanding the Moruya Heads STR occupancy trends. Seasonal demand shifts significantly influence how often properties are booked. Typically, Decembersees the highest demand (peak season occupancy), while June experiences the lowest (low season). Effective strategies, like adjusting minimum stays or offering promotions, can boost occupancy during slower periods. Here's how different property tiers perform in Moruya Heads:
- Best-in-class properties (Top 10%) achieve 78%+ occupancy, indicating high desirability and potentially optimized availability.
- Strong performing properties (Top 25%) maintain 62% or higher occupancy, suggesting good market fit and guest satisfaction.
- Typical properties (Median) have an occupancy rate around 35%.
- Entry-level properties (Bottom 25%) average 20% occupancy, potentially facing higher vacancy.
Average Monthly Occupancy Rate Trend in Moruya Heads
Average Daily Rate (ADR) Airbnb Trends in Moruya Heads (2026)
Effective short term rental pricing strategy in Moruya Heads involves understanding monthly ADR fluctuations. The Average Daily Rate (ADR) for Airbnb in Moruya Heads typically peaks in January and dips lowest during March. Leveraging Airbnb dynamic pricing tools or strategies based on this seasonality can significantly boost revenue. Here's a look at the typical nightly rates achieved:
- Best-in-class properties (Top 10%) command rates of $328+ per night, often due to premium features or locations.
- Strong performing properties (Top 25%) achieve nightly rates of $253 or more.
- Typical properties (Median) charge around $183 per night.
- Entry-level properties (Bottom 25%) earn around $125 per night.
Average Daily Rate (ADR) Trend by Month in Moruya Heads
Get Live Moruya Heads Market Intelligence 👇
Explore Real-time Analytics
Airbnb Seasonality Analysis & Trends in Moruya Heads (2026)
Peak Season (January, December, May)
- Revenue averages $3,771 per month
- Occupancy rates average 46.1%
- Daily rates average $211
Shoulder Season
- Revenue averages $2,598 per month
- Occupancy maintains around 41.7%
- Daily rates hold near $192
Low Season (June, August, September)
- Revenue drops to average $2,164 per month
- Occupancy decreases to average 33.0%
- Daily rates adjust to average $194
Seasonality Insights for Moruya Heads
- The Airbnb seasonality in Moruya Heads shows highly seasonal trends requiring careful strategy. While the sections above show seasonal averages, it's also insightful to look at the extremes:
- During the high season, the absolute peak month showcases Moruya Heads's highest earning potential, with monthly revenues capable of climbing to $4,235, occupancy reaching a high of 50.8%, and ADRs peaking at $231.
- Conversely, the slowest single month of the year, typically falling within the low season, marks the market's lowest point. In this month, revenue might dip to $1,887, occupancy could drop to 29.0%, and ADRs may adjust down to $183.
- Understanding both the seasonal averages and these monthly peaks and troughs in revenue, occupancy, and ADR is crucial for maximizing your Airbnb profit potential in Moruya Heads.
Seasonal Strategies for Maximizing Profit
- Peak Season: Maximize revenue through premium pricing and potentially longer minimum stays. Ensure high availability.
- Low Season: Offer competitive pricing, special promotions (e.g., extended stay discounts), and flexible cancellation policies. Target off-season travelers like remote workers or budget-conscious guests.
- Shoulder Seasons: Implement dynamic pricing that balances peak and low rates. Target weekend travelers or specific events. Offer slightly more flexible terms than peak season.
- Regularly analyze your own performance against these Moruya Heads seasonality benchmarks and adjust your pricing and availability strategy accordingly.
Best Areas for Airbnb Investment in Moruya Heads (2026)
Exploring the top neighborhoods for short-term rentals in Moruya Heads? This section highlights key areas, outlining why they are attractive for hosts and guests, along with notable local attractions. Consider these locations based on your target guest profile and investment strategy.
| Neighborhood / Area | Why Host Here? (Target Guests & Appeal) | Key Attractions & Landmarks |
|---|---|---|
| Moruya Heads Beach | A stunning beach location known for its pristine sand and water activities. Ideal for tourists looking for a relaxing seaside getaway and outdoor adventures. | Moruya Heads Beach, Moruya River, Fishing and surfing spots, Local cafes and restaurants, Nature trails |
| Moruya Township | The charming township offers a blend of local history, culture, and convenient amenities. Popular with families and travelers seeking a community experience. | Moruya Museum, Local markets, Historical architecture, Restaurants and shops, Moruya Golf Course |
| Deua National Park | A natural wonderland perfect for hiking, camping, and wildlife experiences. Attracts nature lovers and adventure seekers looking for beautiful landscapes. | Hiking trails, Scenic viewpoints, Camping facilities, Biodiversity, Wildlife observation |
| Broulee | A nearby coastal suburb known for its surf beaches and family-friendly activities. Popular with beachgoers and those looking for a laid-back vacation spot. | Broulee Beach, Surfing spots, Dolphin Beach, Local eateries, Swimming and beach activities |
| Tuross Head | A picturesque seaside village that offers stunning ocean views and a peaceful atmosphere. Ideal for couples and families looking for a quiet retreat. | Tuross Head Beach, Tuross Lake, Fishing and boating, Coastal walks, Local dining options |
| Kangaroo Valley | Known for its lush landscapes and rich indigenous history. Great for tourists interested in exploring the bush and experiencing the cultural heritage. | Kangaroo Valley Scenic Lookout, Historic bridge, Outdoor activities, Local markets, Nature trails |
| Moruya River | Offers a range of water-based activities and scenic views, making it an attractive location for outdoor enthusiasts and families. | Kayaking and fishing, Picnic areas, Scenic walks, Wildlife watching, Local fishing shops |
| Mogo | A small village rich in history and home to unique attractions. Draws in visitors who are interested in exploring local art, history, and culture. | Mogo Zoo, Local galleries, Historic sites, Mogo Markets, Artisan shops |
Understanding Airbnb License Requirements & STR Laws in Moruya Heads (2026)
Yes, Moruya Heads, New South Wales, Australia enforces high STR regulations. Obtaining a license and ensuring compliance is almost certainly required according to current 2026 STR laws. Always verify the latest short term rental regulations and Airbnb license requirements directly with local government authorities for Moruya Heads to ensure full compliance before hosting.
(Source: AirROI data, 2026, based on 95% licensed listings)
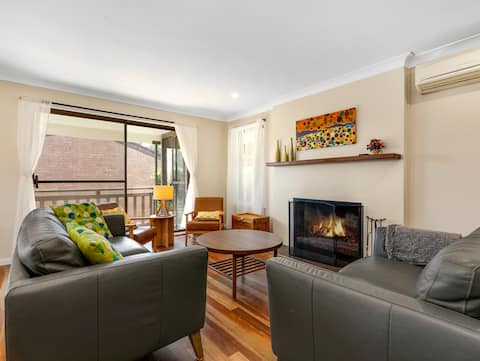
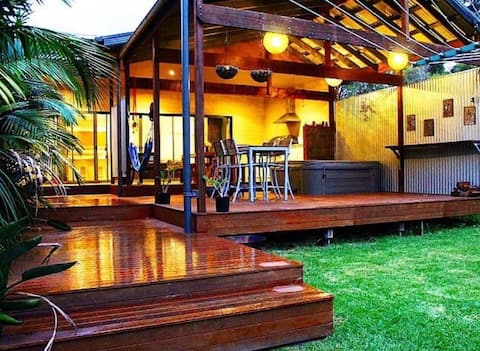
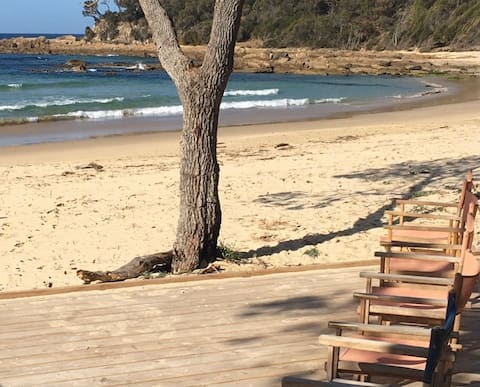
Top Performing Airbnb Properties in Moruya Heads (2026)
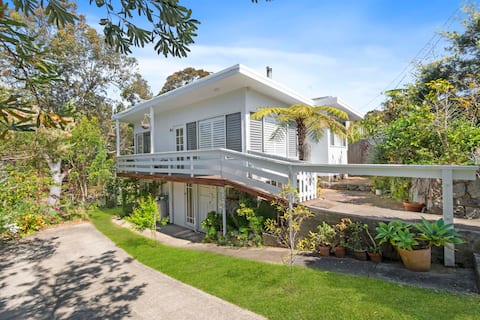
Benchmark your potential! Explore examples of top-performing Airbnb properties in Moruya Headsbased on Trailing Twelve Month (TTM) revenue. Analyze their characteristics, revenue, occupancy rate, and ADR to understand what drives success in this market.
Bertie's 3 beaches -Firepit, 5min Walk to Beaches
Entire Place • 5 bedrooms
Spacious Coastal Retreat beach & pets welcome
Entire Place • 5 bedrooms
Spacious Coastal Getaway walk to river or beach
Entire Place • 4 bedrooms
Manaia - A little bach near the beach
Entire Place • 2 bedrooms
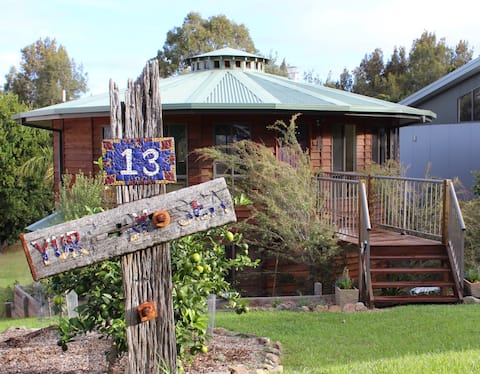
Yurt By Sea
Entire Place • 4 bedrooms

Moruya Heads Seaside Stay 4 mins to beach
Entire Place • 3 bedrooms
Note: Performance varies based on location, size, amenities, seasonality, and management quality. Data reflects the past 12 months.
Top Performing Airbnb Hosts in Moruya Heads (2026)
Learn from the best! This table showcases top-performing Airbnb hosts in Moruya Heads based on the number of properties managed and estimated total revenue over the past year. Analyze their scale and performance metrics.
| Host Name | Properties | Grossing Revenue | Stay Reviews | Avg Rating |
|---|---|---|---|---|
| Tracey | 2 | $134,610 | 363 | 4.97/5.0 |
| Judy | 1 | $85,363 | 38 | 5.00/5.0 |
| Greer | 1 | $34,870 | 30 | 4.93/5.0 |
| Carolyn | 1 | $29,096 | 70 | 4.93/5.0 |
| Fei | 1 | $27,949 | 15 | 4.93/5.0 |
| Justine | 1 | $26,437 | 34 | 4.82/5.0 |
| LJ Hooker | 1 | $17,984 | 2 | Not Rated |
| Suzie | 1 | $17,959 | 53 | 5.00/5.0 |
| Gretta | 1 | $17,564 | 280 | 4.90/5.0 |
| Kate | 1 | $10,012 | 1 | Not Rated |
Analyzing the strategies of top hosts, such as their property selection, pricing, and guest communication, can offer valuable lessons for optimizing your own Airbnb operations in Moruya Heads.
Dive Deeper: Advanced Moruya Heads STR Market Data (2026)
Ready to unlock more insights? AirROI provides access to advanced metrics and comprehensive Airbnb data for Moruya Heads. Explore detailed analytics beyond this report to refine your investment strategy, optimize pricing, and maximize your vacation rental profits.
Explore Advanced MetricsMoruya Heads Short-Term Rental Market Composition (2026): Property & Room Types
Room Type Distribution
Property Type Distribution
Market Composition Insights for Moruya Heads
- The Moruya Heads Airbnb market composition is heavily skewed towards Entire Home/Apt listings, which make up 90.5% of the 21 active rentals. This indicates strong guest preference for privacy and space.
- Looking at the property type distribution in Moruya Heads, House properties are the most common (71.4%), reflecting the local real estate landscape.
- Houses represent a significant 71.4% portion, catering likely to families or larger groups.
- Smaller segments like outdoor/unique, hotel/boutique (combined 9.6%) offer potential for unique stay experiences.
Moruya Heads Airbnb Room Capacity Analysis (2026): Bedroom Distribution
Distribution of Listings by Number of Bedrooms
Room Capacity Insights for Moruya Heads
- The dominant room capacity in Moruya Heads is 3 bedrooms listings, making up 33.3% of the market. This suggests a strong demand for properties suitable for families or small groups.
- Together, 3 bedrooms and 4 bedrooms properties represent 52.3% of the active Airbnb listings in Moruya Heads, indicating a high concentration in these sizes.
- A significant 61.8% of listings offer 3+ bedrooms, catering to larger groups and families seeking more space in Moruya Heads.
Moruya Heads Vacation Rental Guest Capacity Trends (2026)
Distribution of Listings by Guest Capacity
Guest Capacity Insights for Moruya Heads
- The most common guest capacity trend in Moruya Heads vacation rentals is listings accommodating 6 guests (33.3%). This suggests the primary traveler segment is likely larger groups.
- Properties designed for 6 guests and 8+ guests dominate the Moruya Heads STR market, accounting for 61.9% of listings.
- 61.9% of properties accommodate 6+ guests, serving the market segment for larger families or group travel in Moruya Heads.
- On average, properties in Moruya Heads are equipped to host 5.4 guests.
Moruya Heads Airbnb Booking Patterns (2026): Available vs. Booked Days
Available Days Distribution
Booked Days Distribution
Booking Pattern Insights for Moruya Heads
- The most common availability pattern in Moruya Heads falls within the 271-366 days range, representing 57.1% of listings. This suggests many properties have significant open periods on their calendars.
- Approximately 80.9% of listings show high availability (181+ days open annually), indicating potential for increased bookings or specific owner usage patterns.
- For booked days, the 1-30 days range is most frequent in Moruya Heads (28.6%), reflecting common guest stay durations or potential owner blocking patterns.
- A notable 19.0% of properties secure long booking periods (181+ days booked per year), highlighting successful long-term rental strategies or significant owner usage.
Moruya Heads Airbnb Minimum Stay Requirements Analysis
Distribution of Listings by Minimum Night Requirement
1 Night
2 listings
9.5% of total
2 Nights
7 listings
33.3% of total
7-29 Nights
1 listings
4.8% of total
30+ Nights
11 listings
52.4% of total
Key Insights
- The most prevalent minimum stay requirement in Moruya Heads is 30+ Nights, adopted by 52.4% of listings. This highlights the market's preference for longer commitments.
- A significant segment (52.4%) caters to monthly stays (30+ nights) in Moruya Heads, pointing to opportunities in the extended-stay market.
Recommendations
- Align with the market by considering a 30+ Nights minimum stay, as 52.4% of Moruya Heads hosts use this setting.
- If feasible, allowing 1-night stays, especially midweek or during low season, could capture last-minute bookings, as only 9.5% currently do.
- A 2-night minimum appears standard (33.3%). Consider this for weekends or peak periods.
- Explore offering discounts for stays of 30+ nights to attract the 52.4% of the market seeking extended stays.
- Adjust minimum nights based on seasonality – potentially shorter during low season and longer during peak demand periods in Moruya Heads.
Moruya Heads Airbnb Cancellation Policy Trends Analysis (2026)
Super Strict 60 Days
1 listings
4.8% of total
Limited
1 listings
4.8% of total
Flexible
3 listings
14.3% of total
Moderate
7 listings
33.3% of total
Firm
7 listings
33.3% of total
Strict
2 listings
9.5% of total
Cancellation Policy Insights for Moruya Heads
- The prevailing Airbnb cancellation policy trend in Moruya Heads is Moderate, used by 33.3% of listings.
- There's a relatively balanced mix between guest-friendly (47.6%) and stricter (42.8%) policies, offering choices for different guest needs.
- Strict cancellation policies are quite rare (9.5%), potentially making listings with this policy less competitive unless justified by high demand or property type.
Recommendations for Hosts
- Consider adopting a Moderate policy to align with the 33.3% market standard in Moruya Heads.
- Using a Strict policy might deter some guests, as only 9.5% of listings use it. Evaluate if potential revenue protection outweighs possible lower booking rates.
- Regularly review your cancellation policy against competitors and market demand shifts in Moruya Heads.
Moruya Heads STR Booking Lead Time Analysis (2026)
Average Booking Lead Time by Month
Booking Lead Time Insights for Moruya Heads
- The overall average booking lead time for vacation rentals in Moruya Heads is 45 days.
- Guests book furthest in advance for stays during December (average 97 days), likely coinciding with peak travel demand or local events.
- The shortest booking windows occur for stays in July (average 12 days), indicating more last-minute travel plans during this time.
- Seasonally, Winter (62 days avg.) sees the longest lead times, while Summer (24 days avg.) has the shortest, reflecting typical travel planning cycles.
Recommendations for Hosts
- Use the overall average lead time (45 days) as a baseline for your pricing and availability strategy in Moruya Heads.
- For December stays, consider implementing length-of-stay discounts or slightly higher rates for bookings made less than 97 days out to capitalize on advance planning.
- During July, focus on last-minute booking availability and promotions, as guests book with very short notice (12 days avg.).
- Target marketing efforts for the Winter season well in advance (at least 62 days) to capture early planners.
- Monitor your own booking lead times against these Moruya Heads averages to identify opportunities for dynamic pricing adjustments.
Popular & Essential Airbnb Amenities in Moruya Heads (2026)
Amenity Prevalence
Amenity Insights for Moruya Heads
- Essential amenities in Moruya Heads that guests expect include: Washer, Dishes and silverware, Smoke alarm, TV, Hot water. Lacking these (any) could significantly impact bookings.
- Popular amenities like Kitchen, Toaster, Microwave are common but not universal. Offering these can provide a competitive edge.
Recommendations for Hosts
- Ensure your listing includes all essential amenities for Moruya Heads: Washer, Dishes and silverware, Smoke alarm, TV, Hot water.
- Prioritize adding missing essentials: Hot water.
- Consider adding popular differentiators like Kitchen or Toaster to increase appeal.
- Highlight unique or less common amenities you offer (e.g., hot tub, dedicated workspace, EV charger) in your listing description and photos.
- Regularly check competitor amenities in Moruya Heads to stay competitive.
Moruya Heads Airbnb Guest Demographics & Profile Analysis (2026)
Guest Profile Summary for Moruya Heads
- The typical guest profile for Airbnb in Moruya Heads consists of primarily domestic travelers (91%), often arriving from nearby Canberra, typically belonging to the Post-2000s (Gen Z/Alpha) group (50%), primarily speaking English or Spanish.
- Domestic travelers account for 90.5% of guests.
- Key international markets include Australia (90.5%) and United States (1.9%).
- Top languages spoken are English (61.5%) followed by Spanish (5.8%).
- A significant demographic segment is the Post-2000s (Gen Z/Alpha) group, representing 50% of guests.
Recommendations for Hosts
- Target domestic marketing efforts towards travelers from Canberra and New South Wales.
- Tailor amenities and listing descriptions to appeal to the dominant Post-2000s (Gen Z/Alpha) demographic (e.g., highlight fast WiFi, smart home features, local guides).
- Highlight unique local experiences or amenities relevant to the primary guest profile.
- Consider seasonal promotions aligned with peak travel times for key origin markets.
Nearby Short-Term Rental Market Comparison
How does the Moruya Heads Airbnb market stack up against its neighbors? Compare key performance metrics like average monthly revenue, ADR, and occupancy rates in surrounding areas to understand the broader regional STR landscape.
| Market | Active Properties | Monthly Revenue | Daily Rate | Avg. Occupancy |
|---|---|---|---|---|
| Berry | 118 | $5,709 | $559.76 | 40% |
| Burrawang | 12 | $5,242 | $557.61 | 38% |
| Penrose | 13 | $5,227 | $681.36 | 40% |
| Exeter | 34 | $4,551 | $515.98 | 41% |
| Jaspers Brush | 15 | $4,452 | $445.36 | 34% |
| The Council of the Municipality of Kiama | 109 | $4,372 | $437.99 | 42% |
| Robertson | 46 | $4,320 | $396.04 | 39% |
| Bundanoon | 52 | $4,078 | $405.13 | 41% |
| Bowral | 194 | $3,956 | $389.30 | 43% |
| Glenquarry | 14 | $3,947 | $375.09 | 45% |