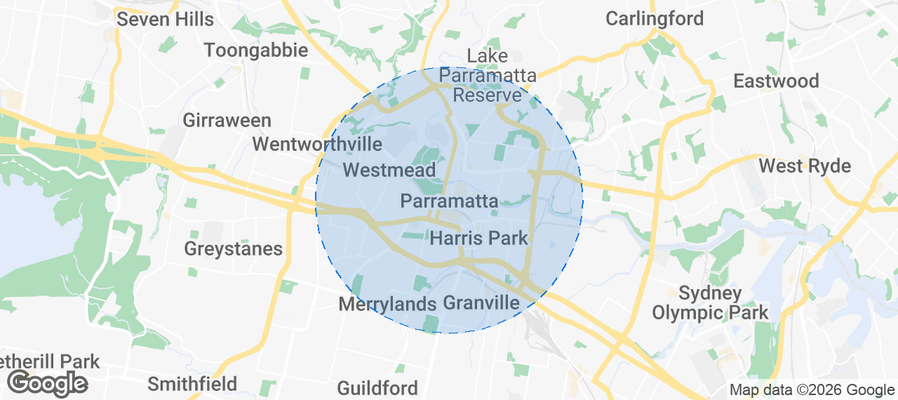
Parramatta Airbnb Market Analysis 2026: Short Term Rental Data & Vacation Rental Statistics in New South Wales, Australia
Is Airbnb profitable in Parramatta in 2026? Explore comprehensive Airbnb analytics for Parramatta, New South Wales, Australia to uncover income potential. This 2026 STR market report for Parramatta, based on AirROI data from February 2025 to January 2026, reveals key trends in the niche market of 20 active listings.
Whether you're considering an Airbnb investment in Parramatta, optimizing your existing vacation rental, or exploring rental arbitrage opportunities, understanding the Parramatta Airbnb data is crucial. Navigating the high regulation landscape is key to maximizing your short term rental income potential. Let's dive into the specifics.
Key Parramatta Airbnb Performance Metrics Overview
Monthly Airbnb Revenue Variations & Income Potential in Parramatta (2026)
Understanding the monthly revenue variations for Airbnb listings in Parramatta is key to maximizing your short term rental income potential. Seasonality significantly impacts earnings. Our analysis, based on data from the past 12 months, shows that the peak revenue month for STRs in Parramatta is typically October, while May often presents the lowest earnings, highlighting opportunities for strategic pricing adjustments during shoulder and low seasons. Explore the typical Airbnb income in Parramatta across different performance tiers:
- Best-in-class properties (Top 10%) achieve $4,018+ monthly, often utilizing dynamic pricing and superior guest experiences.
- Strong performing properties (Top 25%) earn $3,093 or more, indicating effective management and desirable locations/amenities.
- Typical properties (Median) generate around $2,132 per month, representing the average market performance.
- Entry-level properties (Bottom 25%) see earnings around $897, often with potential for optimization.
Average Monthly Airbnb Earnings Trend in Parramatta
Parramatta Airbnb Occupancy Rate Trends (2026)
Maximize your bookings by understanding the Parramatta STR occupancy trends. Seasonal demand shifts significantly influence how often properties are booked. Typically, Octobersees the highest demand (peak season occupancy), while May experiences the lowest (low season). Effective strategies, like adjusting minimum stays or offering promotions, can boost occupancy during slower periods. Here's how different property tiers perform in Parramatta:
- Best-in-class properties (Top 10%) achieve 72%+ occupancy, indicating high desirability and potentially optimized availability.
- Strong performing properties (Top 25%) maintain 57% or higher occupancy, suggesting good market fit and guest satisfaction.
- Typical properties (Median) have an occupancy rate around 39%.
- Entry-level properties (Bottom 25%) average 17% occupancy, potentially facing higher vacancy.
Average Monthly Occupancy Rate Trend in Parramatta
Average Daily Rate (ADR) Airbnb Trends in Parramatta (2026)
Effective short term rental pricing strategy in Parramatta involves understanding monthly ADR fluctuations. The Average Daily Rate (ADR) for Airbnb in Parramatta typically peaks in December and dips lowest during August. Leveraging Airbnb dynamic pricing tools or strategies based on this seasonality can significantly boost revenue. Here's a look at the typical nightly rates achieved:
- Best-in-class properties (Top 10%) command rates of $218+ per night, often due to premium features or locations.
- Strong performing properties (Top 25%) achieve nightly rates of $181 or more.
- Typical properties (Median) charge around $159 per night.
- Entry-level properties (Bottom 25%) earn around $141 per night.
Average Daily Rate (ADR) Trend by Month in Parramatta
Get Live Parramatta Market Intelligence 👇
Explore Real-time Analytics
Airbnb Seasonality Analysis & Trends in Parramatta (2026)
Peak Season (October, December, November)
- Revenue averages $2,762 per month
- Occupancy rates average 47.6%
- Daily rates average $177
Shoulder Season
- Revenue averages $1,874 per month
- Occupancy maintains around 36.4%
- Daily rates hold near $160
Low Season (February, March, April)
- Revenue drops to average $0 per month
- Occupancy decreases to average 0.0%
- Daily rates adjust to average $157
Seasonality Insights for Parramatta
- The Airbnb seasonality in Parramatta shows highly seasonal trends requiring careful strategy. While the sections above show seasonal averages, it's also insightful to look at the extremes:
- During the high season, the absolute peak month showcases Parramatta's highest earning potential, with monthly revenues capable of climbing to $2,969, occupancy reaching a high of 50.1%, and ADRs peaking at $182.
- Conversely, the slowest single month of the year, typically falling within the low season, marks the market's lowest point. In this month, revenue might dip to $0, occupancy could drop to 0.0%, and ADRs may adjust down to $148.
- Understanding both the seasonal averages and these monthly peaks and troughs in revenue, occupancy, and ADR is crucial for maximizing your Airbnb profit potential in Parramatta.
Seasonal Strategies for Maximizing Profit
- Peak Season: Maximize revenue through premium pricing and potentially longer minimum stays. Ensure high availability.
- Low Season: Offer competitive pricing, special promotions (e.g., extended stay discounts), and flexible cancellation policies. Target off-season travelers like remote workers or budget-conscious guests.
- Shoulder Seasons: Implement dynamic pricing that balances peak and low rates. Target weekend travelers or specific events. Offer slightly more flexible terms than peak season.
- Regularly analyze your own performance against these Parramatta seasonality benchmarks and adjust your pricing and availability strategy accordingly.
Best Areas for Airbnb Investment in Parramatta (2026)
Exploring the top neighborhoods for short-term rentals in Parramatta? This section highlights key areas, outlining why they are attractive for hosts and guests, along with notable local attractions. Consider these locations based on your target guest profile and investment strategy.
| Neighborhood / Area | Why Host Here? (Target Guests & Appeal) | Key Attractions & Landmarks |
|---|---|---|
| Parramatta CBD | The heart of Parramatta, bustling with business, shopping, and dining options. Its proximity to transport links and major attractions makes it a prime area for short-term rentals. | Parramatta Park, Westfield Parramatta, Elizabeth Farm, Parramatta Heritage and Visitor Centre, Sydney Olympic Park |
| North Parramatta | Known for its historic homes and charming suburbs, North Parramatta is attractive to families and tourists looking for a quieter stay with easy access to the city. | Parramatta Park, Old Government House, St Patrick's Cathedral, Catherine Hill Bay |
| Camellia | A developing area close to the Parramatta River with new residential developments. Ideal for those looking to invest in upcoming properties. | Parramatta River Foreshore, Civic Place, Domain Creek Reserve |
| Rosehill | Famous for its racecourse, Rosehill attracts visitors during race days and is convenient for those attending events at Sydney Olympic Park. | Rosehill Gardens Racecourse, Riverside Theatre, Rosehill Park |
| Granville | Granville's diverse cultural background and food scene make it a favorite for tourists wanting an authentic experience, with easy train access to Parramatta. | Granville Town Hall, Dural Park, Cabbage Tree Creek |
| Dundas | A suburban area that is becoming popular for its affordability and family-friendly environment, appealing to longer-term Airbnb rentals. | Dundas Park, Dundas Station, Close to local schools and amenities |
| Epping | Located further out but with good transport links, Epping is popular with families and professionals, providing a quieter alternative to city life. | Epping Community Centre, Boronia Park, Epping Oval |
| Rydalmere | A riverside suburb with a range of dining options and parks, Rydalmere is attractive for those wanting a peaceful stay near the river and close to transport. | Rydalmere Wharf, Parramatta River Walk, Local cafes and dining spots |
Understanding Airbnb License Requirements & STR Laws in Parramatta (2026)
Yes, Parramatta, New South Wales, Australia enforces high STR regulations. Obtaining a license and ensuring compliance is almost certainly required according to current 2026 STR laws. Always verify the latest short term rental regulations and Airbnb license requirements directly with local government authorities for Parramatta to ensure full compliance before hosting.
(Source: AirROI data, 2026, based on 85% licensed listings)
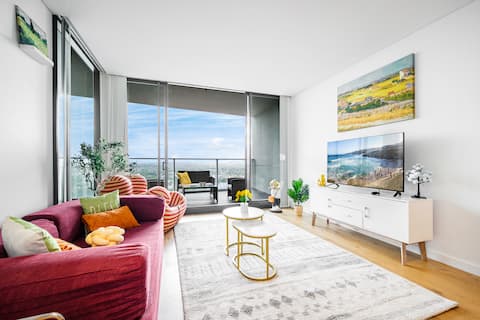
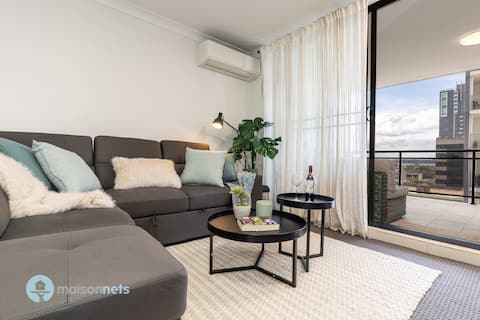
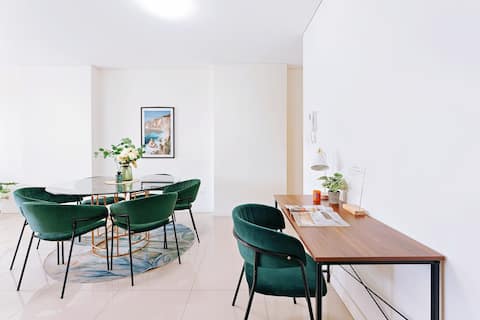
Top Performing Airbnb Properties in Parramatta (2026)
Benchmark your potential! Explore examples of top-performing Airbnb properties in Parramattabased on Trailing Twelve Month (TTM) revenue. Analyze their characteristics, revenue, occupancy rate, and ADR to understand what drives success in this market.
Parramatta 2br Apt Near Train Shopping Center
Entire Place • 2 bedrooms
2BR Central Parramatta Balcony and Parking
Entire Place • 2 bedrooms
Central location 5 beds 3 rooms apartment 8 min walk to train station, restaurant, mall, free parkin
Entire Place • 4 bedrooms
3BR | Free Parking + Pool| Near Mall & Station
Entire Place • 3 bedrooms
Stylish 1-Bed Apt with Free Parking in Parramatta
Entire Place • 1 bedroom
Convenient Two Bed Parramatta
Entire Place • 2 bedrooms
Note: Performance varies based on location, size, amenities, seasonality, and management quality. Data reflects the past 12 months.
Top Performing Airbnb Hosts in Parramatta (2026)
Learn from the best! This table showcases top-performing Airbnb hosts in Parramatta based on the number of properties managed and estimated total revenue over the past year. Analyze their scale and performance metrics.
| Host Name | Properties | Grossing Revenue | Stay Reviews | Avg Rating |
|---|---|---|---|---|
| Star | 4 | $60,483 | 19 | 4.83/5.0 |
| Xian | 1 | $41,398 | 29 | 4.83/5.0 |
| MaisonNets | 1 | $33,764 | 8 | 4.50/5.0 |
| Punthill Parramatta | 4 | $28,353 | 11 | 4.42/5.0 |
| Felicia | 1 | $24,370 | 3 | 4.67/5.0 |
| Luna | 1 | $24,215 | 49 | 4.84/5.0 |
| Eric | 2 | $18,927 | 33 | 4.66/5.0 |
| AirCabin | 1 | $18,225 | 11 | 4.45/5.0 |
| HostingPro | 1 | $16,692 | 16 | 4.50/5.0 |
| Donna | 1 | $15,305 | 7 | 5.00/5.0 |
Analyzing the strategies of top hosts, such as their property selection, pricing, and guest communication, can offer valuable lessons for optimizing your own Airbnb operations in Parramatta.
Dive Deeper: Advanced Parramatta STR Market Data (2026)
Ready to unlock more insights? AirROI provides access to advanced metrics and comprehensive Airbnb data for Parramatta. Explore detailed analytics beyond this report to refine your investment strategy, optimize pricing, and maximize your vacation rental profits.
Explore Advanced MetricsParramatta Short-Term Rental Market Composition (2026): Property & Room Types
Room Type Distribution
Property Type Distribution
Market Composition Insights for Parramatta
- The Parramatta Airbnb market composition is heavily skewed towards Entire Home/Apt listings, which make up 80% of the 20 active rentals. This indicates strong guest preference for privacy and space.
- Looking at the property type distribution in Parramatta, Apartment/Condo properties are the most common (100%), reflecting the local real estate landscape.
Parramatta Airbnb Room Capacity Analysis (2026): Bedroom Distribution
Distribution of Listings by Number of Bedrooms
Room Capacity Insights for Parramatta
- The dominant room capacity in Parramatta is 2 bedrooms listings, making up 70% of the market. This suggests a strong demand for properties suitable for couples or solo travelers.
- Together, 2 bedrooms and 1 bedroom properties represent 90.0% of the active Airbnb listings in Parramatta, indicating a high concentration in these sizes.
Parramatta Vacation Rental Guest Capacity Trends (2026)
Distribution of Listings by Guest Capacity
Guest Capacity Insights for Parramatta
- The most common guest capacity trend in Parramatta vacation rentals is listings accommodating 4 guests (45%). This suggests the primary traveler segment is likely small families or groups.
- Properties designed for 4 guests and 5 guests dominate the Parramatta STR market, accounting for 65.0% of listings.
- 15.0% of properties accommodate 6+ guests, serving the market segment for larger families or group travel in Parramatta.
- On average, properties in Parramatta are equipped to host 4.3 guests.
Parramatta Airbnb Booking Patterns (2026): Available vs. Booked Days
Available Days Distribution
Booked Days Distribution
Booking Pattern Insights for Parramatta
- The most common availability pattern in Parramatta falls within the 271-366 days range, representing 55% of listings. This suggests many properties have significant open periods on their calendars.
- Approximately 95.0% of listings show high availability (181+ days open annually), indicating potential for increased bookings or specific owner usage patterns.
- For booked days, the 31-90 days range is most frequent in Parramatta (50%), reflecting common guest stay durations or potential owner blocking patterns.
- A notable 5.0% of properties secure long booking periods (181+ days booked per year), highlighting successful long-term rental strategies or significant owner usage.
Parramatta Airbnb Minimum Stay Requirements Analysis
Distribution of Listings by Minimum Night Requirement
1 Night
3 listings
15% of total
2 Nights
2 listings
10% of total
3 Nights
1 listings
5% of total
7-29 Nights
3 listings
15% of total
30+ Nights
11 listings
55% of total
Key Insights
- The most prevalent minimum stay requirement in Parramatta is 30+ Nights, adopted by 55% of listings. This highlights the market's preference for longer commitments.
- A significant segment (55%) caters to monthly stays (30+ nights) in Parramatta, pointing to opportunities in the extended-stay market.
Recommendations
- Align with the market by considering a 30+ Nights minimum stay, as 55% of Parramatta hosts use this setting.
- If feasible, allowing 1-night stays, especially midweek or during low season, could capture last-minute bookings, as only 15% currently do.
- Explore offering discounts for stays of 30+ nights to attract the 55% of the market seeking extended stays.
- Adjust minimum nights based on seasonality – potentially shorter during low season and longer during peak demand periods in Parramatta.
Parramatta Airbnb Cancellation Policy Trends Analysis (2026)
Moderate
7 listings
35% of total
Firm
6 listings
30% of total
Strict
7 listings
35% of total
Cancellation Policy Insights for Parramatta
- The prevailing Airbnb cancellation policy trend in Parramatta is Moderate, used by 35% of listings.
- A majority (65.0%) of hosts in Parramatta utilize Firm or Strict policies, indicating a market where hosts prioritize booking security.
Recommendations for Hosts
- Consider adopting a Moderate policy to align with the 35% market standard in Parramatta.
- With 35% using Strict terms, this is a viable option in Parramatta, particularly for high-value properties or during peak demand periods.
- Regularly review your cancellation policy against competitors and market demand shifts in Parramatta.
Parramatta STR Booking Lead Time Analysis (2026)
Average Booking Lead Time by Month
Booking Lead Time Insights for Parramatta
- The overall average booking lead time for vacation rentals in Parramatta is 23 days.
- Guests book furthest in advance for stays during November (average 41 days), likely coinciding with peak travel demand or local events.
- The shortest booking windows occur for stays in April (average 0 days), indicating more last-minute travel plans during this time.
- Seasonally, Fall (31 days avg.) sees the longest lead times, while Spring (1 days avg.) has the shortest, reflecting typical travel planning cycles.
Recommendations for Hosts
- Use the overall average lead time (23 days) as a baseline for your pricing and availability strategy in Parramatta.
- For November stays, consider implementing length-of-stay discounts or slightly higher rates for bookings made less than 41 days out to capitalize on advance planning.
- During April, focus on last-minute booking availability and promotions, as guests book with very short notice (0 days avg.).
- Target marketing efforts for the Fall season well in advance (at least 31 days) to capture early planners.
- Monitor your own booking lead times against these Parramatta averages to identify opportunities for dynamic pricing adjustments.
Popular & Essential Airbnb Amenities in Parramatta (2026)
Amenity Prevalence
Amenity Insights for Parramatta
- Essential amenities in Parramatta that guests expect include: Wifi, Hot water, Washer, Shampoo, Smoke alarm, Air conditioning, Hair dryer, Kitchen, TV, Dryer. Lacking these (any) could significantly impact bookings.
Recommendations for Hosts
- Ensure your listing includes all essential amenities for Parramatta: Wifi, Hot water, Washer, Shampoo, Smoke alarm, Air conditioning, Hair dryer, Kitchen, TV, Dryer.
- Prioritize adding missing essentials: TV, Dryer.
- Highlight unique or less common amenities you offer (e.g., hot tub, dedicated workspace, EV charger) in your listing description and photos.
- Regularly check competitor amenities in Parramatta to stay competitive.
Parramatta Airbnb Guest Demographics & Profile Analysis (2026)
Guest Profile Summary for Parramatta
- The typical guest profile for Airbnb in Parramatta consists of primarily domestic travelers (85%), often arriving from nearby Sydney, typically belonging to the Post-2000s (Gen Z/Alpha) group (50%), primarily speaking English or Chinese.
- Domestic travelers account for 84.8% of guests.
- Key international markets include Australia (84.8%) and India (4%).
- Top languages spoken are English (68%) followed by Chinese (12%).
- A significant demographic segment is the Post-2000s (Gen Z/Alpha) group, representing 50% of guests.
Recommendations for Hosts
- Target domestic marketing efforts towards travelers from Sydney and New South Wales.
- Tailor amenities and listing descriptions to appeal to the dominant Post-2000s (Gen Z/Alpha) demographic (e.g., highlight fast WiFi, smart home features, local guides).
- Highlight unique local experiences or amenities relevant to the primary guest profile.
- Consider seasonal promotions aligned with peak travel times for key origin markets.
Nearby Short-Term Rental Market Comparison
How does the Parramatta Airbnb market stack up against its neighbors? Compare key performance metrics like average monthly revenue, ADR, and occupancy rates in surrounding areas to understand the broader regional STR landscape.
| Market | Active Properties | Monthly Revenue | Daily Rate | Avg. Occupancy |
|---|---|---|---|---|
| Berry | 118 | $5,709 | $559.76 | 40% |
| Dawes Point | 10 | $5,632 | $415.45 | 62% |
| Millers Point | 16 | $5,345 | $388.13 | 62% |
| Burrawang | 12 | $5,242 | $557.61 | 38% |
| Penrose | 13 | $5,227 | $681.36 | 40% |
| Nulkaba | 41 | $4,609 | $574.24 | 31% |
| Exeter | 34 | $4,551 | $515.98 | 41% |
| Jaspers Brush | 15 | $4,452 | $445.36 | 34% |
| The Council of the Municipality of Kiama | 109 | $4,372 | $437.99 | 42% |
| Robertson | 46 | $4,320 | $396.04 | 39% |