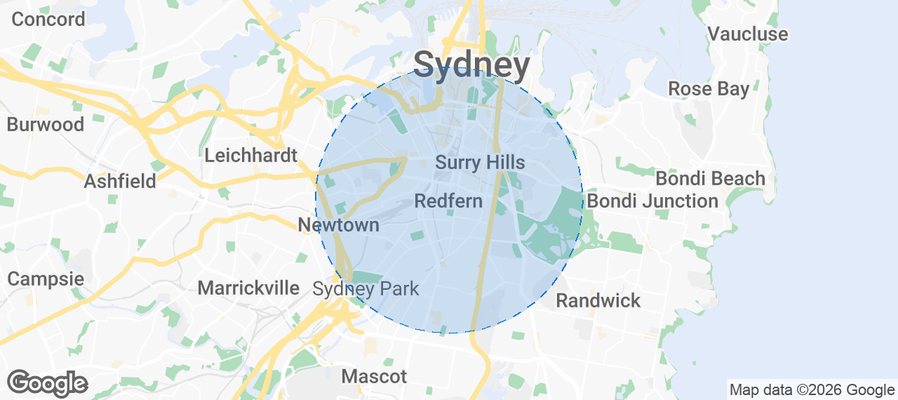
Redfern Airbnb Market Analysis 2026: Short Term Rental Data & Vacation Rental Statistics in New South Wales, Australia
Is Airbnb profitable in Redfern in 2026? Explore comprehensive Airbnb analytics for Redfern, New South Wales, Australia to uncover income potential. This 2026 STR market report for Redfern, based on AirROI data from February 2025 to January 2026, reveals key trends in the niche market of 18 active listings.
Whether you're considering an Airbnb investment in Redfern, optimizing your existing vacation rental, or exploring rental arbitrage opportunities, understanding the Redfern Airbnb data is crucial. Navigating the high regulation landscape is key to maximizing your short term rental income potential. Let's dive into the specifics.
Key Redfern Airbnb Performance Metrics Overview
Monthly Airbnb Revenue Variations & Income Potential in Redfern (2026)
Understanding the monthly revenue variations for Airbnb listings in Redfern is key to maximizing your short term rental income potential. Seasonality significantly impacts earnings. Our analysis, based on data from the past 12 months, shows that the peak revenue month for STRs in Redfern is typically November, while May often presents the lowest earnings, highlighting opportunities for strategic pricing adjustments during shoulder and low seasons. Explore the typical Airbnb income in Redfern across different performance tiers:
- Best-in-class properties (Top 10%) achieve $5,454+ monthly, often utilizing dynamic pricing and superior guest experiences.
- Strong performing properties (Top 25%) earn $4,250 or more, indicating effective management and desirable locations/amenities.
- Typical properties (Median) generate around $2,954 per month, representing the average market performance.
- Entry-level properties (Bottom 25%) see earnings around $1,673, often with potential for optimization.
Average Monthly Airbnb Earnings Trend in Redfern
Redfern Airbnb Occupancy Rate Trends (2026)
Maximize your bookings by understanding the Redfern STR occupancy trends. Seasonal demand shifts significantly influence how often properties are booked. Typically, Junesees the highest demand (peak season occupancy), while May experiences the lowest (low season). Effective strategies, like adjusting minimum stays or offering promotions, can boost occupancy during slower periods. Here's how different property tiers perform in Redfern:
- Best-in-class properties (Top 10%) achieve 79%+ occupancy, indicating high desirability and potentially optimized availability.
- Strong performing properties (Top 25%) maintain 70% or higher occupancy, suggesting good market fit and guest satisfaction.
- Typical properties (Median) have an occupancy rate around 56%.
- Entry-level properties (Bottom 25%) average 30% occupancy, potentially facing higher vacancy.
Average Monthly Occupancy Rate Trend in Redfern
Average Daily Rate (ADR) Airbnb Trends in Redfern (2026)
Effective short term rental pricing strategy in Redfern involves understanding monthly ADR fluctuations. The Average Daily Rate (ADR) for Airbnb in Redfern typically peaks in December and dips lowest during July. Leveraging Airbnb dynamic pricing tools or strategies based on this seasonality can significantly boost revenue. Here's a look at the typical nightly rates achieved:
- Best-in-class properties (Top 10%) command rates of $319+ per night, often due to premium features or locations.
- Strong performing properties (Top 25%) achieve nightly rates of $230 or more.
- Typical properties (Median) charge around $188 per night.
- Entry-level properties (Bottom 25%) earn around $141 per night.
Average Daily Rate (ADR) Trend by Month in Redfern
Get Live Redfern Market Intelligence 👇
Explore Real-time Analytics
Airbnb Seasonality Analysis & Trends in Redfern (2026)
Peak Season (November, October, June)
- Revenue averages $4,114 per month
- Occupancy rates average 63.2%
- Daily rates average $258
Shoulder Season
- Revenue averages $2,645 per month
- Occupancy maintains around 46.8%
- Daily rates hold near $217
Low Season (February, March, April)
- Revenue drops to average $0 per month
- Occupancy decreases to average 0.0%
- Daily rates adjust to average $176
Seasonality Insights for Redfern
- The Airbnb seasonality in Redfern shows highly seasonal trends requiring careful strategy. While the sections above show seasonal averages, it's also insightful to look at the extremes:
- During the high season, the absolute peak month showcases Redfern's highest earning potential, with monthly revenues capable of climbing to $4,530, occupancy reaching a high of 65.8%, and ADRs peaking at $311.
- Conversely, the slowest single month of the year, typically falling within the low season, marks the market's lowest point. In this month, revenue might dip to $0, occupancy could drop to 0.0%, and ADRs may adjust down to $160.
- Understanding both the seasonal averages and these monthly peaks and troughs in revenue, occupancy, and ADR is crucial for maximizing your Airbnb profit potential in Redfern.
Seasonal Strategies for Maximizing Profit
- Peak Season: Maximize revenue through premium pricing and potentially longer minimum stays. Ensure high availability.
- Low Season: Offer competitive pricing, special promotions (e.g., extended stay discounts), and flexible cancellation policies. Target off-season travelers like remote workers or budget-conscious guests.
- Shoulder Seasons: Implement dynamic pricing that balances peak and low rates. Target weekend travelers or specific events. Offer slightly more flexible terms than peak season.
- Regularly analyze your own performance against these Redfern seasonality benchmarks and adjust your pricing and availability strategy accordingly.
Best Areas for Airbnb Investment in Redfern (2026)
Exploring the top neighborhoods for short-term rentals in Redfern? This section highlights key areas, outlining why they are attractive for hosts and guests, along with notable local attractions. Consider these locations based on your target guest profile and investment strategy.
| Neighborhood / Area | Why Host Here? (Target Guests & Appeal) | Key Attractions & Landmarks |
|---|---|---|
| Sydney CBD | The central business district is always bustling with tourists and business travelers, providing endless opportunities for short-term rentals. | Sydney Opera House, Harbour Bridge, The Rocks, Circular Quay, Queen Victoria Building |
| Surry Hills | A trendy neighborhood known for its vibrant atmosphere, eclectic cafes, and close proximity to the city. | Crown Street, Taylor Square, Surry Hills Markets, Cafes and restaurants, Art galleries |
| Newtown | Known for its bohemian culture, Newtown boasts a vibrant arts scene, diverse food offerings, and a youthful population. | King Street, Newtown Festival, Enmore Theatre, Street art, Local shops |
| Chippendale | A rapidly developing area that attracts younger travelers with its modern developments and proximity to universities. | Central Park Mall, White Rabbit Gallery, The Old Clare Hotel, Chippendale Green, University of Technology Sydney |
| Darlington | A quieter residential area that offers charm and proximity to the city, popular with families and young professionals. | Darlington School, Local parks, Cafes, Southern Cross University |
| Redfern | A culturally rich area undergoing gentrification, known for its vibrant Aboriginal community and artistic events. | Redfern Park, Aboriginal Heritage Walk, Local art galleries, Cafes and restaurants, Redfern train station |
| Alexandria | A suburb that is becoming increasingly popular for its industrial chic vibe and proximity to trendy areas like Surry Hills. | Australian Technology Park, Cafes and restaurants, Sydney Park, Local markets, Art spaces |
| Waterloo | A burgeoning suburb close to the city, with modern developments and a diverse community, appealing to short-term renters. | Moore Park, Bourke Street Bakery, Local markets, Waterloo Oval, Community gardens |
Understanding Airbnb License Requirements & STR Laws in Redfern (2026)
Yes, Redfern, New South Wales, Australia enforces high STR regulations. Obtaining a license and ensuring compliance is almost certainly required according to current 2026 STR laws. Always verify the latest short term rental regulations and Airbnb license requirements directly with local government authorities for Redfern to ensure full compliance before hosting.
(Source: AirROI data, 2026, based on 94% licensed listings)
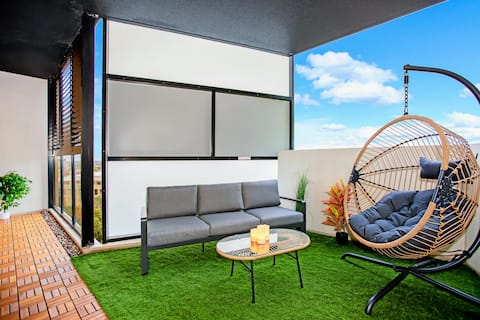
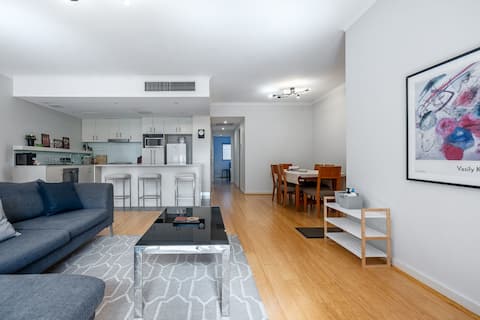
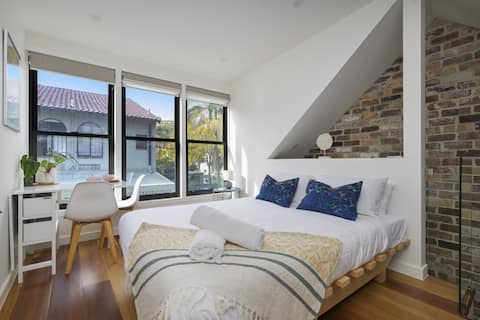
Top Performing Airbnb Properties in Redfern (2026)
Benchmark your potential! Explore examples of top-performing Airbnb properties in Redfernbased on Trailing Twelve Month (TTM) revenue. Analyze their characteristics, revenue, occupancy rate, and ADR to understand what drives success in this market.
Jack's Citylight Retreat with Free Parking
Entire Place • 2 bedrooms
Cosy 2-Bed in Redfern with Terrace & Parking
Entire Place • 2 bedrooms
Architect-Designed Studio Retreat in Surry Hills
Entire Place • 1 bedroom
Redfern 2Br Apt with balcony free parking near CBD
Entire Place • 2 bedrooms
Skylight House in Sydney CBD, Perfect For families
Entire Place • 2 bedrooms
Stylish & Convenient Stay in Central Redfern
Entire Place • 1 bedroom
Note: Performance varies based on location, size, amenities, seasonality, and management quality. Data reflects the past 12 months.
Top Performing Airbnb Hosts in Redfern (2026)
Learn from the best! This table showcases top-performing Airbnb hosts in Redfern based on the number of properties managed and estimated total revenue over the past year. Analyze their scale and performance metrics.
| Host Name | Properties | Grossing Revenue | Stay Reviews | Avg Rating |
|---|---|---|---|---|
| Jackson | 1 | $51,446 | 37 | 4.92/5.0 |
| Frank | 1 | $50,206 | 10 | 4.70/5.0 |
| James | 1 | $43,778 | 38 | 4.97/5.0 |
| Maria | 1 | $41,590 | 35 | 4.46/5.0 |
| Coco | 2 | $32,612 | 12 | 4.75/5.0 |
| Dong | 1 | $32,241 | 40 | 4.80/5.0 |
| Frank | 1 | $31,810 | 20 | 4.45/5.0 |
| Nguyen | 2 | $28,635 | 33 | 4.51/5.0 |
| Megan | 1 | $28,522 | 24 | 4.46/5.0 |
| Sandy | 2 | $26,014 | 8 | 3.83/5.0 |
Analyzing the strategies of top hosts, such as their property selection, pricing, and guest communication, can offer valuable lessons for optimizing your own Airbnb operations in Redfern.
Dive Deeper: Advanced Redfern STR Market Data (2026)
Ready to unlock more insights? AirROI provides access to advanced metrics and comprehensive Airbnb data for Redfern. Explore detailed analytics beyond this report to refine your investment strategy, optimize pricing, and maximize your vacation rental profits.
Explore Advanced MetricsRedfern Short-Term Rental Market Composition (2026): Property & Room Types
Room Type Distribution
Property Type Distribution
Market Composition Insights for Redfern
- The Redfern Airbnb market composition is heavily skewed towards Entire Home/Apt listings, which make up 94.4% of the 18 active rentals. This indicates strong guest preference for privacy and space.
- Looking at the property type distribution in Redfern, Apartment/Condo properties are the most common (83.3%), reflecting the local real estate landscape.
- Houses represent a significant 16.7% portion, catering likely to families or larger groups.
Redfern Airbnb Room Capacity Analysis (2026): Bedroom Distribution
Distribution of Listings by Number of Bedrooms
Room Capacity Insights for Redfern
- The dominant room capacity in Redfern is 2 bedrooms listings, making up 66.7% of the market. This suggests a strong demand for properties suitable for couples or solo travelers.
- Together, 2 bedrooms and 1 bedroom properties represent 88.9% of the active Airbnb listings in Redfern, indicating a high concentration in these sizes.
- Listings with 3+ bedrooms (5.6%) represent a smaller niche, potentially indicating an underserved market for larger group accommodations in Redfern.
Redfern Vacation Rental Guest Capacity Trends (2026)
Distribution of Listings by Guest Capacity
Guest Capacity Insights for Redfern
- The most common guest capacity trend in Redfern vacation rentals is listings accommodating 6 guests (38.9%). This suggests the primary traveler segment is likely larger groups.
- Properties designed for 6 guests and 4 guests dominate the Redfern STR market, accounting for 61.1% of listings.
- 44.5% of properties accommodate 6+ guests, serving the market segment for larger families or group travel in Redfern.
- On average, properties in Redfern are equipped to host 4.6 guests.
Redfern Airbnb Booking Patterns (2026): Available vs. Booked Days
Available Days Distribution
Booked Days Distribution
Booking Pattern Insights for Redfern
- The most common availability pattern in Redfern falls within the 271-366 days range, representing 38.9% of listings. This suggests many properties have significant open periods on their calendars.
- Approximately 72.2% of listings show high availability (181+ days open annually), indicating potential for increased bookings or specific owner usage patterns.
- For booked days, the 31-90 days range is most frequent in Redfern (38.9%), reflecting common guest stay durations or potential owner blocking patterns.
- A notable 27.8% of properties secure long booking periods (181+ days booked per year), highlighting successful long-term rental strategies or significant owner usage.
Redfern Airbnb Minimum Stay Requirements Analysis
Distribution of Listings by Minimum Night Requirement
1 Night
4 listings
22.2% of total
2 Nights
2 listings
11.1% of total
4-6 Nights
2 listings
11.1% of total
30+ Nights
10 listings
55.6% of total
Key Insights
- The most prevalent minimum stay requirement in Redfern is 30+ Nights, adopted by 55.6% of listings. This highlights the market's preference for longer commitments.
- A significant segment (55.6%) caters to monthly stays (30+ nights) in Redfern, pointing to opportunities in the extended-stay market.
Recommendations
- Align with the market by considering a 30+ Nights minimum stay, as 55.6% of Redfern hosts use this setting.
- If feasible, allowing 1-night stays, especially midweek or during low season, could capture last-minute bookings, as only 22.2% currently do.
- Explore offering discounts for stays of 30+ nights to attract the 55.6% of the market seeking extended stays.
- Adjust minimum nights based on seasonality – potentially shorter during low season and longer during peak demand periods in Redfern.
Redfern Airbnb Cancellation Policy Trends Analysis (2026)
Super Strict 60 Days
1 listings
5.6% of total
Limited
2 listings
11.1% of total
Flexible
1 listings
5.6% of total
Moderate
2 listings
11.1% of total
Firm
10 listings
55.6% of total
Strict
2 listings
11.1% of total
Cancellation Policy Insights for Redfern
- The prevailing Airbnb cancellation policy trend in Redfern is Firm, used by 55.6% of listings.
- A majority (66.7%) of hosts in Redfern utilize Firm or Strict policies, indicating a market where hosts prioritize booking security.
Recommendations for Hosts
- Consider adopting a Firm policy to align with the 55.6% market standard in Redfern.
- Using a Strict policy might deter some guests, as only 11.1% of listings use it. Evaluate if potential revenue protection outweighs possible lower booking rates.
- Regularly review your cancellation policy against competitors and market demand shifts in Redfern.
Redfern STR Booking Lead Time Analysis (2026)
Average Booking Lead Time by Month
Booking Lead Time Insights for Redfern
- The overall average booking lead time for vacation rentals in Redfern is 32 days.
- Guests book furthest in advance for stays during August (average 37 days), likely coinciding with peak travel demand or local events.
- The shortest booking windows occur for stays in April (average 0 days), indicating more last-minute travel plans during this time.
- Seasonally, Fall (33 days avg.) sees the longest lead times, while Spring (1 days avg.) has the shortest, reflecting typical travel planning cycles.
Recommendations for Hosts
- Use the overall average lead time (32 days) as a baseline for your pricing and availability strategy in Redfern.
- During April, focus on last-minute booking availability and promotions, as guests book with very short notice (0 days avg.).
- Target marketing efforts for the Fall season well in advance (at least 33 days) to capture early planners.
- Monitor your own booking lead times against these Redfern averages to identify opportunities for dynamic pricing adjustments.
Popular & Essential Airbnb Amenities in Redfern (2026)
Amenity Prevalence
Amenity Insights for Redfern
- Essential amenities in Redfern that guests expect include: Shampoo. Lacking these (this) could significantly impact bookings.
- Popular amenities like Microwave, Heating, Refrigerator are common but not universal. Offering these can provide a competitive edge.
Recommendations for Hosts
- Ensure your listing includes all essential amenities for Redfern: Shampoo.
- Consider adding popular differentiators like Microwave or Heating to increase appeal.
- Highlight unique or less common amenities you offer (e.g., hot tub, dedicated workspace, EV charger) in your listing description and photos.
- Regularly check competitor amenities in Redfern to stay competitive.
Redfern Airbnb Guest Demographics & Profile Analysis (2026)
Guest Profile Summary for Redfern
- The typical guest profile for Airbnb in Redfern consists of a mix of domestic (59%) and international guests, often arriving from nearby Melbourne, typically belonging to the Post-2000s (Gen Z/Alpha) group (50%), primarily speaking English or Spanish.
- Domestic travelers account for 59.3% of guests.
- Key international markets include Australia (59.3%) and United States (10.2%).
- Top languages spoken are English (55.7%) followed by Spanish (10.1%).
- A significant demographic segment is the Post-2000s (Gen Z/Alpha) group, representing 50% of guests.
Recommendations for Hosts
- Balance marketing efforts between domestic and international channels based on the guest mix.
- Tailor amenities and listing descriptions to appeal to the dominant Post-2000s (Gen Z/Alpha) demographic (e.g., highlight fast WiFi, smart home features, local guides).
- Highlight unique local experiences or amenities relevant to the primary guest profile.
- Consider seasonal promotions aligned with peak travel times for key origin markets.
Nearby Short-Term Rental Market Comparison
How does the Redfern Airbnb market stack up against its neighbors? Compare key performance metrics like average monthly revenue, ADR, and occupancy rates in surrounding areas to understand the broader regional STR landscape.
| Market | Active Properties | Monthly Revenue | Daily Rate | Avg. Occupancy |
|---|---|---|---|---|
| Berry | 118 | $5,709 | $559.76 | 40% |
| Dawes Point | 10 | $5,632 | $415.45 | 62% |
| Millers Point | 16 | $5,345 | $388.13 | 62% |
| Burrawang | 12 | $5,242 | $557.61 | 38% |
| Penrose | 13 | $5,227 | $681.36 | 40% |
| Nulkaba | 41 | $4,609 | $574.24 | 31% |
| Exeter | 34 | $4,551 | $515.98 | 41% |
| Jaspers Brush | 15 | $4,452 | $445.36 | 34% |
| The Council of the Municipality of Kiama | 109 | $4,372 | $437.99 | 42% |
| Robertson | 46 | $4,320 | $396.04 | 39% |