Repton Airbnb Market Analysis 2026: Short Term Rental Data & Vacation Rental Statistics in New South Wales, Australia
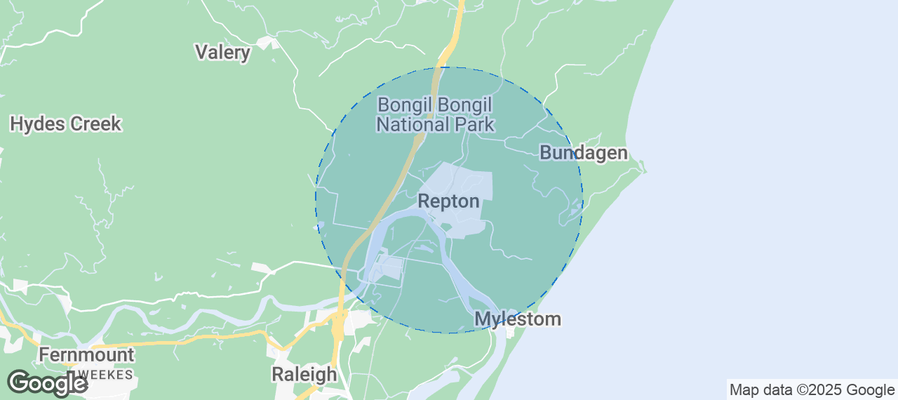
Is Airbnb profitable in Repton in 2026? Explore comprehensive Airbnb analytics for Repton, New South Wales, Australia to uncover income potential. This 2026 STR market report for Repton, based on AirROI data from February 2025 to January 2026, reveals key trends in the niche market of 24 active listings.
Whether you're considering an Airbnb investment in Repton, optimizing your existing vacation rental, or exploring rental arbitrage opportunities, understanding the Repton Airbnb data is crucial. Navigating the high regulation landscape is key to maximizing your short term rental income potential. Let's dive into the specifics.
Key Repton Airbnb Performance Metrics Overview
Monthly Airbnb Revenue Variations & Income Potential in Repton (2026)
Understanding the monthly revenue variations for Airbnb listings in Repton is key to maximizing your short term rental income potential. Seasonality significantly impacts earnings. Our analysis, based on data from the past 12 months, shows that the peak revenue month for STRs in Repton is typically April, while June often presents the lowest earnings, highlighting opportunities for strategic pricing adjustments during shoulder and low seasons. Explore the typical Airbnb income in Repton across different performance tiers:
- Best-in-class properties (Top 10%) achieve $4,779+ monthly, often utilizing dynamic pricing and superior guest experiences.
- Strong performing properties (Top 25%) earn $2,975 or more, indicating effective management and desirable locations/amenities.
- Typical properties (Median) generate around $1,992 per month, representing the average market performance.
- Entry-level properties (Bottom 25%) see earnings around $1,108, often with potential for optimization.
Average Monthly Airbnb Earnings Trend in Repton
Repton Airbnb Occupancy Rate Trends (2026)
Maximize your bookings by understanding the Repton STR occupancy trends. Seasonal demand shifts significantly influence how often properties are booked. Typically, Aprilsees the highest demand (peak season occupancy), while June experiences the lowest (low season). Effective strategies, like adjusting minimum stays or offering promotions, can boost occupancy during slower periods. Here's how different property tiers perform in Repton:
- Best-in-class properties (Top 10%) achieve 71%+ occupancy, indicating high desirability and potentially optimized availability.
- Strong performing properties (Top 25%) maintain 57% or higher occupancy, suggesting good market fit and guest satisfaction.
- Typical properties (Median) have an occupancy rate around 36%.
- Entry-level properties (Bottom 25%) average 19% occupancy, potentially facing higher vacancy.
Average Monthly Occupancy Rate Trend in Repton
Average Daily Rate (ADR) Airbnb Trends in Repton (2026)
Effective short term rental pricing strategy in Repton involves understanding monthly ADR fluctuations. The Average Daily Rate (ADR) for Airbnb in Repton typically peaks in January and dips lowest during August. Leveraging Airbnb dynamic pricing tools or strategies based on this seasonality can significantly boost revenue. Here's a look at the typical nightly rates achieved:
- Best-in-class properties (Top 10%) command rates of $348+ per night, often due to premium features or locations.
- Strong performing properties (Top 25%) achieve nightly rates of $281 or more.
- Typical properties (Median) charge around $216 per night.
- Entry-level properties (Bottom 25%) earn around $135 per night.
Average Daily Rate (ADR) Trend by Month in Repton
Get Live Repton Market Intelligence 👇
Explore Real-time Analytics
Airbnb Seasonality Analysis & Trends in Repton (2026)
Peak Season (April, October, December)
- Revenue averages $3,146 per month
- Occupancy rates average 47.4%
- Daily rates average $236
Shoulder Season
- Revenue averages $2,313 per month
- Occupancy maintains around 39.0%
- Daily rates hold near $217
Low Season (June, August, September)
- Revenue drops to average $1,482 per month
- Occupancy decreases to average 28.8%
- Daily rates adjust to average $209
Seasonality Insights for Repton
- The Airbnb seasonality in Repton shows highly seasonal trends requiring careful strategy. While the sections above show seasonal averages, it's also insightful to look at the extremes:
- During the high season, the absolute peak month showcases Repton's highest earning potential, with monthly revenues capable of climbing to $3,237, occupancy reaching a high of 56.1%, and ADRs peaking at $263.
- Conversely, the slowest single month of the year, typically falling within the low season, marks the market's lowest point. In this month, revenue might dip to $1,349, occupancy could drop to 28.4%, and ADRs may adjust down to $201.
- Understanding both the seasonal averages and these monthly peaks and troughs in revenue, occupancy, and ADR is crucial for maximizing your Airbnb profit potential in Repton.
Seasonal Strategies for Maximizing Profit
- Peak Season: Maximize revenue through premium pricing and potentially longer minimum stays. Ensure high availability.
- Low Season: Offer competitive pricing, special promotions (e.g., extended stay discounts), and flexible cancellation policies. Target off-season travelers like remote workers or budget-conscious guests.
- Shoulder Seasons: Implement dynamic pricing that balances peak and low rates. Target weekend travelers or specific events. Offer slightly more flexible terms than peak season.
- Regularly analyze your own performance against these Repton seasonality benchmarks and adjust your pricing and availability strategy accordingly.
Best Areas for Airbnb Investment in Repton (2026)
Exploring the top neighborhoods for short-term rentals in Repton? This section highlights key areas, outlining why they are attractive for hosts and guests, along with notable local attractions. Consider these locations based on your target guest profile and investment strategy.
| Neighborhood / Area | Why Host Here? (Target Guests & Appeal) | Key Attractions & Landmarks |
|---|---|---|
| North Repton | A serene location with beautiful natural scenery and proximity to local attractions. This area is ideal for families and those seeking a peaceful retreat while remaining close to nature. | Repton Nature Reserve, Mossy Point Beach, Burrill Lake, Clyde River National Park, local walking trails |
| South Repton | A growing area that offers easy access to nearby beaches and recreation, making it a popular choice for beachgoers and holiday makers looking for relaxation and enjoyment. | Bamboo Flute Cafe, Repton Beach, Congo Beach, Meroo National Park, surfing spots |
| Repton Village | The heart of Repton that offers local cafes and community vibes. Perfect for those wanting to experience a local lifestyle while being close to amenities. | Repton Community Hall, Shops and cafes, local markets, parks, community events |
| Mogo | Just a short drive from Repton, Mogo is a quaint village known for its arts and crafts shops and nearby wildlife attractions. It appeals to tourists looking for unique shopping and experiences. | Mogo Wildlife Park, local galleries, Mogo Zoo, Mogo Historic village, markets |
| Narooma | A coastal town that is a major attraction for tourists thanks to its stunning beaches, ocean views, and marine activities. Perfect for those looking for a beachfront experience. | Narooma Beach, Bar Beach, Montague Island, Narooma Bar, shopping and dining opportunities |
| Bodalla | Known for its dairy and cheese-making heritage, Bodalla offers a unique rural experience and is attractive to visitors looking for farm stays and local produce. | Bodalla Dairy Shed, Bodalla Historical Museum, local farms, gourmet cheese shops, rural scenery |
| Burrill Lake | A small suburb known for its scenic lake and access to outdoor activities. Great for those seeking water sports and natural beauty. | Burrill Lake Foreshore, fishing spots, Lakeside Park, water skiing, local wildlife |
| Mossy Point | A charming coastal spot that offers beautiful views, ideal for those interested in surfing and beach activities. | Mossy Point Beach, north beach surfing, local cafes, Collers Beach, nature walks |
Understanding Airbnb License Requirements & STR Laws in Repton (2026)
Yes, Repton, New South Wales, Australia enforces high STR regulations. Obtaining a license and ensuring compliance is almost certainly required according to current 2026 STR laws. Always verify the latest short term rental regulations and Airbnb license requirements directly with local government authorities for Repton to ensure full compliance before hosting.
(Source: AirROI data, 2026, based on 96% licensed listings)
Top Performing Airbnb Properties in Repton (2026)
Benchmark your potential! Explore examples of top-performing Airbnb properties in Reptonbased on Trailing Twelve Month (TTM) revenue. Analyze their characteristics, revenue, occupancy rate, and ADR to understand what drives success in this market.
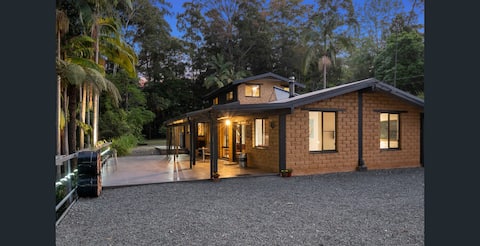
Entire House - Coastal Rainforest Paradise
Entire Place • 3 bedrooms

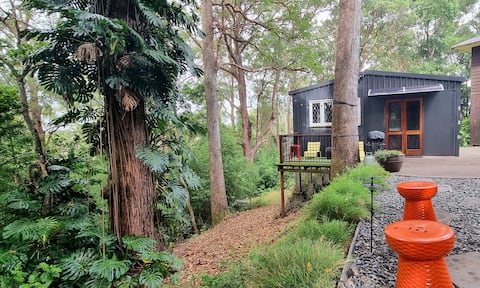
The Escape Studio - Peaceful hideaway to recharge!
Entire Place • 1 bedroom

The Escape Home - Calm refuge to unwind
Entire Place • 3 bedrooms
Funky cabin in tropical setting, mins from beaches
Entire Place • 1 bedroom
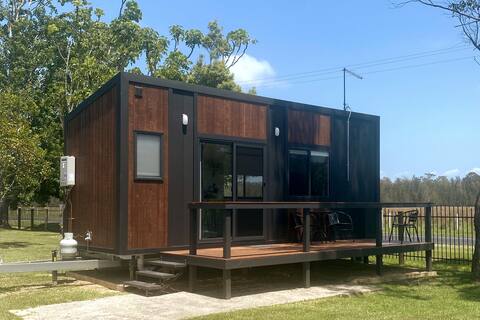
Pet Friendly Tiny Home
Entire Place • N/A
Deluxe Pet Friendly Tiny Home
Entire Place • N/A
Note: Performance varies based on location, size, amenities, seasonality, and management quality. Data reflects the past 12 months.
Top Performing Airbnb Hosts in Repton (2026)
Learn from the best! This table showcases top-performing Airbnb hosts in Repton based on the number of properties managed and estimated total revenue over the past year. Analyze their scale and performance metrics.
| Host Name | Properties | Grossing Revenue | Stay Reviews | Avg Rating |
|---|---|---|---|---|
| Bellinger River | 7 | $128,614 | 336 | 4.78/5.0 |
| Harrison And Erika | 2 | $86,821 | 124 | 5.00/5.0 |
| Coffs Coast Accommodation | 5 | $84,904 | 15 | 5.00/5.0 |
| Oliver | 1 | $67,241 | 10 | 5.00/5.0 |
| Sarah | 1 | $29,743 | 310 | 4.97/5.0 |
| Conan | 4 | $27,521 | 88 | 4.80/5.0 |
| Gail | 1 | $18,578 | 531 | 4.95/5.0 |
| Cassandra | 2 | $14,542 | 11 | 5.00/5.0 |
| Rain | 1 | $8,599 | 36 | 4.83/5.0 |
Analyzing the strategies of top hosts, such as their property selection, pricing, and guest communication, can offer valuable lessons for optimizing your own Airbnb operations in Repton.
Dive Deeper: Advanced Repton STR Market Data (2026)
Ready to unlock more insights? AirROI provides access to advanced metrics and comprehensive Airbnb data for Repton. Explore detailed analytics beyond this report to refine your investment strategy, optimize pricing, and maximize your vacation rental profits.
Explore Advanced MetricsRepton Short-Term Rental Market Composition (2026): Property & Room Types
Room Type Distribution
Property Type Distribution
Market Composition Insights for Repton
- The Repton Airbnb market composition is heavily skewed towards Entire Home/Apt listings, which make up 100% of the 24 active rentals. This indicates strong guest preference for privacy and space.
- Looking at the property type distribution in Repton, House properties are the most common (58.3%), reflecting the local real estate landscape.
- Houses represent a significant 58.3% portion, catering likely to families or larger groups.
- The presence of 25% Hotel/Boutique listings indicates integration with traditional hospitality.
- Smaller segments like others (combined 4.2%) offer potential for unique stay experiences.
Repton Airbnb Room Capacity Analysis (2026): Bedroom Distribution
Distribution of Listings by Number of Bedrooms
Room Capacity Insights for Repton
- The dominant room capacity in Repton is 2 bedrooms listings, making up 45.8% of the market. This suggests a strong demand for properties suitable for couples or solo travelers.
- Together, 2 bedrooms and 3 bedrooms properties represent 75.0% of the active Airbnb listings in Repton, indicating a high concentration in these sizes.
- A significant 29.2% of listings offer 3+ bedrooms, catering to larger groups and families seeking more space in Repton.
Repton Vacation Rental Guest Capacity Trends (2026)
Distribution of Listings by Guest Capacity
Guest Capacity Insights for Repton
- The most common guest capacity trend in Repton vacation rentals is listings accommodating 6 guests (33.3%). This suggests the primary traveler segment is likely larger groups.
- Properties designed for 6 guests and 5 guests dominate the Repton STR market, accounting for 50.0% of listings.
- 50.0% of properties accommodate 6+ guests, serving the market segment for larger families or group travel in Repton.
- On average, properties in Repton are equipped to host 5.0 guests.
Repton Airbnb Booking Patterns (2026): Available vs. Booked Days
Available Days Distribution
Booked Days Distribution
Booking Pattern Insights for Repton
- The most common availability pattern in Repton falls within the 271-366 days range, representing 62.5% of listings. This suggests many properties have significant open periods on their calendars.
- Approximately 75.0% of listings show high availability (181+ days open annually), indicating potential for increased bookings or specific owner usage patterns.
- For booked days, the 31-90 days range is most frequent in Repton (41.7%), reflecting common guest stay durations or potential owner blocking patterns.
- A notable 29.2% of properties secure long booking periods (181+ days booked per year), highlighting successful long-term rental strategies or significant owner usage.
Repton Airbnb Minimum Stay Requirements Analysis
Distribution of Listings by Minimum Night Requirement
1 Night
1 listings
4.2% of total
2 Nights
4 listings
16.7% of total
3 Nights
2 listings
8.3% of total
7-29 Nights
1 listings
4.2% of total
30+ Nights
16 listings
66.7% of total
Key Insights
- The most prevalent minimum stay requirement in Repton is 30+ Nights, adopted by 66.7% of listings. This highlights the market's preference for longer commitments.
- A significant segment (66.7%) caters to monthly stays (30+ nights) in Repton, pointing to opportunities in the extended-stay market.
Recommendations
- Align with the market by considering a 30+ Nights minimum stay, as 66.7% of Repton hosts use this setting.
- If feasible, allowing 1-night stays, especially midweek or during low season, could capture last-minute bookings, as only 4.2% currently do.
- Explore offering discounts for stays of 30+ nights to attract the 66.7% of the market seeking extended stays.
- Adjust minimum nights based on seasonality – potentially shorter during low season and longer during peak demand periods in Repton.
Repton Airbnb Cancellation Policy Trends Analysis (2026)
Flexible
2 listings
8.3% of total
Moderate
8 listings
33.3% of total
Firm
13 listings
54.2% of total
Strict
1 listings
4.2% of total
Cancellation Policy Insights for Repton
- The prevailing Airbnb cancellation policy trend in Repton is Firm, used by 54.2% of listings.
- A majority (58.4%) of hosts in Repton utilize Firm or Strict policies, indicating a market where hosts prioritize booking security.
- Strict cancellation policies are quite rare (4.2%), potentially making listings with this policy less competitive unless justified by high demand or property type.
Recommendations for Hosts
- Consider adopting a Firm policy to align with the 54.2% market standard in Repton.
- Using a Strict policy might deter some guests, as only 4.2% of listings use it. Evaluate if potential revenue protection outweighs possible lower booking rates.
- Regularly review your cancellation policy against competitors and market demand shifts in Repton.
Repton STR Booking Lead Time Analysis (2026)
Average Booking Lead Time by Month
Booking Lead Time Insights for Repton
- The overall average booking lead time for vacation rentals in Repton is 45 days.
- Guests book furthest in advance for stays during January (average 67 days), likely coinciding with peak travel demand or local events.
- The shortest booking windows occur for stays in July (average 15 days), indicating more last-minute travel plans during this time.
- Seasonally, Winter (60 days avg.) sees the longest lead times, while Summer (24 days avg.) has the shortest, reflecting typical travel planning cycles.
Recommendations for Hosts
- Use the overall average lead time (45 days) as a baseline for your pricing and availability strategy in Repton.
- For January stays, consider implementing length-of-stay discounts or slightly higher rates for bookings made less than 67 days out to capitalize on advance planning.
- Target marketing efforts for the Winter season well in advance (at least 60 days) to capture early planners.
- Monitor your own booking lead times against these Repton averages to identify opportunities for dynamic pricing adjustments.
Popular & Essential Airbnb Amenities in Repton (2026)
Amenity Prevalence
Amenity Insights for Repton
- Essential amenities in Repton that guests expect include: TV, Free parking on premises, Washer, Dishes and silverware, Shower gel, Refrigerator, Hot water. Lacking these (any) could significantly impact bookings.
- Popular amenities like Air conditioning, Kitchen, Toaster are common but not universal. Offering these can provide a competitive edge.
Recommendations for Hosts
- Ensure your listing includes all essential amenities for Repton: TV, Free parking on premises, Washer, Dishes and silverware, Shower gel, Refrigerator, Hot water.
- Prioritize adding missing essentials: Dishes and silverware, Shower gel, Refrigerator, Hot water.
- Consider adding popular differentiators like Air conditioning or Kitchen to increase appeal.
- Highlight unique or less common amenities you offer (e.g., hot tub, dedicated workspace, EV charger) in your listing description and photos.
- Regularly check competitor amenities in Repton to stay competitive.
Repton Airbnb Guest Demographics & Profile Analysis (2026)
Guest Profile Summary for Repton
- The typical guest profile for Airbnb in Repton consists of primarily domestic travelers (90%), often arriving from nearby Sydney, typically belonging to the Post-2000s (Gen Z/Alpha) group (50%), primarily speaking English or German.
- Domestic travelers account for 90.1% of guests.
- Key international markets include Australia (90.1%) and United Kingdom (3.8%).
- Top languages spoken are English (67.6%) followed by German (4.5%).
- A significant demographic segment is the Post-2000s (Gen Z/Alpha) group, representing 50% of guests.
Recommendations for Hosts
- Target domestic marketing efforts towards travelers from Sydney and New South Wales.
- Tailor amenities and listing descriptions to appeal to the dominant Post-2000s (Gen Z/Alpha) demographic (e.g., highlight fast WiFi, smart home features, local guides).
- Highlight unique local experiences or amenities relevant to the primary guest profile.
- Consider seasonal promotions aligned with peak travel times for key origin markets.
Nearby Short-Term Rental Market Comparison
How does the Repton Airbnb market stack up against its neighbors? Compare key performance metrics like average monthly revenue, ADR, and occupancy rates in surrounding areas to understand the broader regional STR landscape.
| Market | Active Properties | Monthly Revenue | Daily Rate | Avg. Occupancy |
|---|---|---|---|---|
| Fernmount | 16 | $2,889 | $292.41 | 38% |
| Gleniffer | 32 | $2,767 | $354.22 | 38% |
| Minnie Water | 13 | $2,696 | $236.11 | 41% |
| Sawtell | 147 | $2,568 | $264.40 | 39% |
| Coffs Harbour | 332 | $2,568 | $239.30 | 42% |
| Emerald Beach | 48 | $2,549 | $274.32 | 42% |
| Clarence Valley Council | 79 | $2,465 | $255.04 | 39% |
| Korora | 48 | $2,434 | $245.87 | 43% |
| Yamba | 432 | $2,385 | $312.91 | 34% |
| Bellingen Shire Council | 12 | $2,345 | $156.34 | 50% |