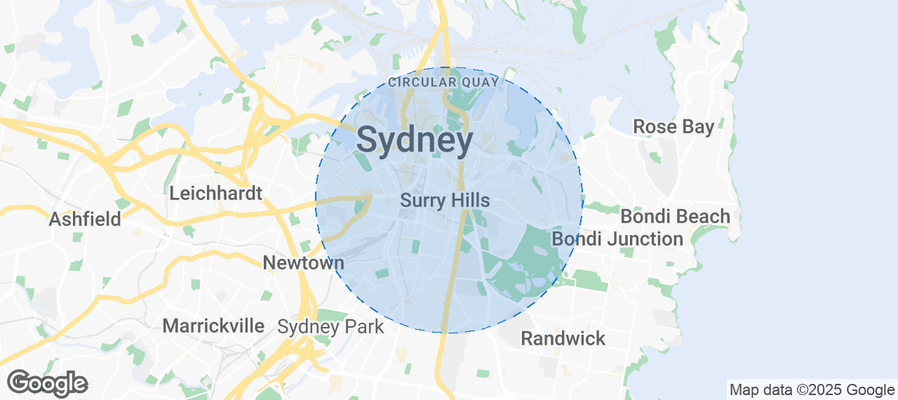
Surry Hills Airbnb Market Analysis 2026: Short Term Rental Data & Vacation Rental Statistics in New South Wales, Australia
Is Airbnb profitable in Surry Hills in 2026? Explore comprehensive Airbnb analytics for Surry Hills, New South Wales, Australia to uncover income potential. This 2026 STR market report for Surry Hills, based on AirROI data from February 2025 to January 2026, reveals key trends in the niche market of 48 active listings.
Whether you're considering an Airbnb investment in Surry Hills, optimizing your existing vacation rental, or exploring rental arbitrage opportunities, understanding the Surry Hills Airbnb data is crucial. Navigating the high regulation landscape is key to maximizing your short term rental income potential. Let's dive into the specifics.
Key Surry Hills Airbnb Performance Metrics Overview
Monthly Airbnb Revenue Variations & Income Potential in Surry Hills (2026)
Understanding the monthly revenue variations for Airbnb listings in Surry Hills is key to maximizing your short term rental income potential. Seasonality significantly impacts earnings. Our analysis, based on data from the past 12 months, shows that the peak revenue month for STRs in Surry Hills is typically November, while May often presents the lowest earnings, highlighting opportunities for strategic pricing adjustments during shoulder and low seasons. Explore the typical Airbnb income in Surry Hills across different performance tiers:
- Best-in-class properties (Top 10%) achieve $6,187+ monthly, often utilizing dynamic pricing and superior guest experiences.
- Strong performing properties (Top 25%) earn $4,357 or more, indicating effective management and desirable locations/amenities.
- Typical properties (Median) generate around $2,813 per month, representing the average market performance.
- Entry-level properties (Bottom 25%) see earnings around $1,665, often with potential for optimization.
Average Monthly Airbnb Earnings Trend in Surry Hills
Surry Hills Airbnb Occupancy Rate Trends (2026)
Maximize your bookings by understanding the Surry Hills STR occupancy trends. Seasonal demand shifts significantly influence how often properties are booked. Typically, Novembersees the highest demand (peak season occupancy), while May experiences the lowest (low season). Effective strategies, like adjusting minimum stays or offering promotions, can boost occupancy during slower periods. Here's how different property tiers perform in Surry Hills:
- Best-in-class properties (Top 10%) achieve 83%+ occupancy, indicating high desirability and potentially optimized availability.
- Strong performing properties (Top 25%) maintain 75% or higher occupancy, suggesting good market fit and guest satisfaction.
- Typical properties (Median) have an occupancy rate around 58%.
- Entry-level properties (Bottom 25%) average 37% occupancy, potentially facing higher vacancy.
Average Monthly Occupancy Rate Trend in Surry Hills
Average Daily Rate (ADR) Airbnb Trends in Surry Hills (2026)
Effective short term rental pricing strategy in Surry Hills involves understanding monthly ADR fluctuations. The Average Daily Rate (ADR) for Airbnb in Surry Hills typically peaks in December and dips lowest during August. Leveraging Airbnb dynamic pricing tools or strategies based on this seasonality can significantly boost revenue. Here's a look at the typical nightly rates achieved:
- Best-in-class properties (Top 10%) command rates of $360+ per night, often due to premium features or locations.
- Strong performing properties (Top 25%) achieve nightly rates of $233 or more.
- Typical properties (Median) charge around $160 per night.
- Entry-level properties (Bottom 25%) earn around $104 per night.
Average Daily Rate (ADR) Trend by Month in Surry Hills
Get Live Surry Hills Market Intelligence 👇
Explore Real-time Analytics
Airbnb Seasonality Analysis & Trends in Surry Hills (2026)
Peak Season (November, December, October)
- Revenue averages $4,546 per month
- Occupancy rates average 64.3%
- Daily rates average $242
Shoulder Season
- Revenue averages $2,590 per month
- Occupancy maintains around 50.8%
- Daily rates hold near $175
Low Season (February, March, April)
- Revenue drops to average $0 per month
- Occupancy decreases to average 0.0%
- Daily rates adjust to average $163
Seasonality Insights for Surry Hills
- The Airbnb seasonality in Surry Hills shows highly seasonal trends requiring careful strategy. While the sections above show seasonal averages, it's also insightful to look at the extremes:
- During the high season, the absolute peak month showcases Surry Hills's highest earning potential, with monthly revenues capable of climbing to $4,823, occupancy reaching a high of 70.5%, and ADRs peaking at $252.
- Conversely, the slowest single month of the year, typically falling within the low season, marks the market's lowest point. In this month, revenue might dip to $0, occupancy could drop to 0.0%, and ADRs may adjust down to $147.
- Understanding both the seasonal averages and these monthly peaks and troughs in revenue, occupancy, and ADR is crucial for maximizing your Airbnb profit potential in Surry Hills.
Seasonal Strategies for Maximizing Profit
- Peak Season: Maximize revenue through premium pricing and potentially longer minimum stays. Ensure high availability.
- Low Season: Offer competitive pricing, special promotions (e.g., extended stay discounts), and flexible cancellation policies. Target off-season travelers like remote workers or budget-conscious guests.
- Shoulder Seasons: Implement dynamic pricing that balances peak and low rates. Target weekend travelers or specific events. Offer slightly more flexible terms than peak season.
- Regularly analyze your own performance against these Surry Hills seasonality benchmarks and adjust your pricing and availability strategy accordingly.
Best Areas for Airbnb Investment in Surry Hills (2026)
Exploring the top neighborhoods for short-term rentals in Surry Hills? This section highlights key areas, outlining why they are attractive for hosts and guests, along with notable local attractions. Consider these locations based on your target guest profile and investment strategy.
| Neighborhood / Area | Why Host Here? (Target Guests & Appeal) | Key Attractions & Landmarks |
|---|---|---|
| Crown Street | A lively hub with cafes, restaurants, and shops, offering a taste of local culture. Ideal for travelers wanting to experience Surry Hills' vibrant community. | Sydney Coffee Culture, Local boutiques, Artisan eateries, Surry Hills Markets, Crown Street Oval |
| Surry Hills Park | A tranquil park area perfect for relaxation and outdoor activities. Great for families and those seeking leisure activities close to their accommodation. | Surry Hills Park, Playground facilities, Picnic areas, Green spaces |
| Chalmers Street | Close to Central Station, this area is perfect for guests traveling to Sydney by train. Offers easy access to transportation and nearby attractions. | Central Station, Nearby cafes, Quick access to city attractions |
| Fitzroy Street | Known for its eateries and nightlife, Fitzroy Street is a vibrant area that attracts young crowds and tourists. Ideal for those looking to enjoy the local scene. | Restaurants and bars, Nightlife, Art galleries |
| Elizabeth Street | Home to many local businesses and close to public transport, this area offers both convenience and a local feel. Popular with both tourists and locals alike. | Local shops, Public transport access, Historical architecture |
| Belvoir Street | Famous for its theater scene, this area attracts culture lovers and art enthusiasts. For tourists interested in the performing arts, this is an ideal location. | Belvoir St Theatre, Arts and culture events, Nearby cafes |
| Bourke Street | A bustling street with a mix of restaurants, shops, and markets. Great for experiencing the diverse food scene in Surry Hills. | Local markets, Diverse dining options, Boutiques, Art and crafts shops |
| O'Connor Street | A quieter residential area that provides a retreat from the busier parts of Surry Hills. Perfect for families or longer stays. | Residential charm, Peaceful atmosphere, Access to parks |
Understanding Airbnb License Requirements & STR Laws in Surry Hills (2026)
Yes, Surry Hills, New South Wales, Australia enforces high STR regulations. Obtaining a license and ensuring compliance is almost certainly required according to current 2026 STR laws. Always verify the latest short term rental regulations and Airbnb license requirements directly with local government authorities for Surry Hills to ensure full compliance before hosting.
(Source: AirROI data, 2026, based on 88% licensed listings)
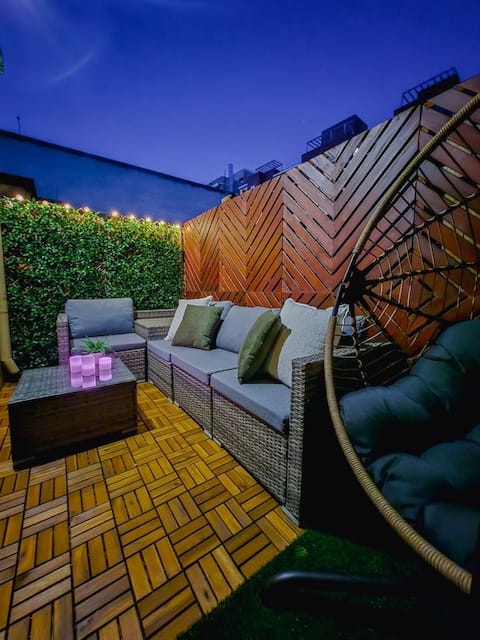
Top Performing Airbnb Properties in Surry Hills (2026)
Benchmark your potential! Explore examples of top-performing Airbnb properties in Surry Hillsbased on Trailing Twelve Month (TTM) revenue. Analyze their characteristics, revenue, occupancy rate, and ADR to understand what drives success in this market.
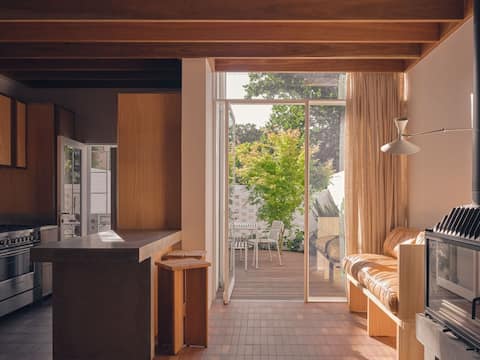
Riley House, Surry Hills,
Entire Place • 3 bedrooms

Jack's Urban Terrace
Entire Place • 2 bedrooms
Jack's Urban Terrace 2
Entire Place • 2 bedrooms

'Small House' - Award Winning Surry Hills
Entire Place • 1 bedroom
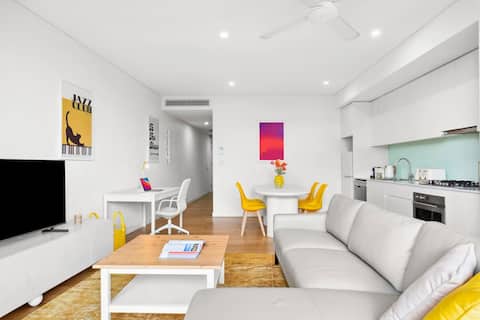
Central luminous 2 beds with balcony & aircon
Entire Place • 2 bedrooms
'Furness' - Classic Surry Hills
Entire Place • 3 bedrooms
Note: Performance varies based on location, size, amenities, seasonality, and management quality. Data reflects the past 12 months.
Top Performing Airbnb Hosts in Surry Hills (2026)
Learn from the best! This table showcases top-performing Airbnb hosts in Surry Hills based on the number of properties managed and estimated total revenue over the past year. Analyze their scale and performance metrics.
| Host Name | Properties | Grossing Revenue | Stay Reviews | Avg Rating |
|---|---|---|---|---|
| Gabriele | 4 | $134,008 | 67 | 4.83/5.0 |
| Jackson | 2 | $111,747 | 75 | 4.75/5.0 |
| L'Abode Accommodation Speciali | 2 | $97,484 | 19 | 4.95/5.0 |
| Urban Stays Australia | 3 | $87,791 | 19 | 4.90/5.0 |
| Stella | 3 | $65,548 | 35 | 4.76/5.0 |
| Angus | 3 | $49,234 | 150 | 4.84/5.0 |
| Joe | 3 | $47,396 | 129 | 4.81/5.0 |
| Frank | 1 | $45,806 | 13 | 4.69/5.0 |
| Melissa | 1 | $42,301 | 17 | 4.94/5.0 |
| Vb | 1 | $41,928 | 18 | 3.61/5.0 |
Analyzing the strategies of top hosts, such as their property selection, pricing, and guest communication, can offer valuable lessons for optimizing your own Airbnb operations in Surry Hills.
Dive Deeper: Advanced Surry Hills STR Market Data (2026)
Ready to unlock more insights? AirROI provides access to advanced metrics and comprehensive Airbnb data for Surry Hills. Explore detailed analytics beyond this report to refine your investment strategy, optimize pricing, and maximize your vacation rental profits.
Explore Advanced MetricsSurry Hills Short-Term Rental Market Composition (2026): Property & Room Types
Room Type Distribution
Property Type Distribution
Market Composition Insights for Surry Hills
- The Surry Hills Airbnb market composition is heavily skewed towards Entire Home/Apt listings, which make up 72.9% of the 48 active rentals. This indicates strong guest preference for privacy and space.
- Looking at the property type distribution in Surry Hills, Apartment/Condo properties are the most common (54.2%), reflecting the local real estate landscape.
- Houses represent a significant 45.8% portion, catering likely to families or larger groups.
Surry Hills Airbnb Room Capacity Analysis (2026): Bedroom Distribution
Distribution of Listings by Number of Bedrooms
Room Capacity Insights for Surry Hills
- The dominant room capacity in Surry Hills is 1 bedroom listings, making up 35.4% of the market. This suggests a strong demand for properties suitable for couples or solo travelers.
- Together, 1 bedroom and 2 bedrooms properties represent 58.3% of the active Airbnb listings in Surry Hills, indicating a high concentration in these sizes.
Surry Hills Vacation Rental Guest Capacity Trends (2026)
Distribution of Listings by Guest Capacity
Guest Capacity Insights for Surry Hills
- The most common guest capacity trend in Surry Hills vacation rentals is listings accommodating 2 guests (27.1%). This suggests the primary traveler segment is likely couples or solo travelers.
- Properties designed for 2 guests and 6 guests dominate the Surry Hills STR market, accounting for 45.9% of listings.
- 20.9% of properties accommodate 6+ guests, serving the market segment for larger families or group travel in Surry Hills.
- On average, properties in Surry Hills are equipped to host 2.8 guests.
Surry Hills Airbnb Booking Patterns (2026): Available vs. Booked Days
Available Days Distribution
Booked Days Distribution
Booking Pattern Insights for Surry Hills
- The most common availability pattern in Surry Hills falls within the 181-270 days range, representing 56.3% of listings. This suggests many properties have significant open periods on their calendars.
- Approximately 77.1% of listings show high availability (181+ days open annually), indicating potential for increased bookings or specific owner usage patterns.
- For booked days, the 91-180 days range is most frequent in Surry Hills (47.9%), reflecting common guest stay durations or potential owner blocking patterns.
- A notable 31.3% of properties secure long booking periods (181+ days booked per year), highlighting successful long-term rental strategies or significant owner usage.
Surry Hills Airbnb Minimum Stay Requirements Analysis
Distribution of Listings by Minimum Night Requirement
1 Night
7 listings
14.6% of total
2 Nights
2 listings
4.2% of total
4-6 Nights
4 listings
8.3% of total
7-29 Nights
8 listings
16.7% of total
30+ Nights
27 listings
56.3% of total
Key Insights
- The most prevalent minimum stay requirement in Surry Hills is 30+ Nights, adopted by 56.3% of listings. This highlights the market's preference for longer commitments.
- Very short stays (1-2 nights) are less common (18.8%), suggesting hosts prefer slightly longer bookings to optimize turnover.
- A significant segment (56.3%) caters to monthly stays (30+ nights) in Surry Hills, pointing to opportunities in the extended-stay market.
Recommendations
- Align with the market by considering a 30+ Nights minimum stay, as 56.3% of Surry Hills hosts use this setting.
- If feasible, allowing 1-night stays, especially midweek or during low season, could capture last-minute bookings, as only 14.6% currently do.
- Explore offering discounts for stays of 30+ nights to attract the 56.3% of the market seeking extended stays.
- Adjust minimum nights based on seasonality – potentially shorter during low season and longer during peak demand periods in Surry Hills.
Surry Hills Airbnb Cancellation Policy Trends Analysis (2026)
Super Strict 60 Days
3 listings
6.3% of total
Limited
2 listings
4.2% of total
Super Strict 30 Days
4 listings
8.3% of total
Flexible
8 listings
16.7% of total
Moderate
11 listings
22.9% of total
Firm
16 listings
33.3% of total
Strict
4 listings
8.3% of total
Cancellation Policy Insights for Surry Hills
- The prevailing Airbnb cancellation policy trend in Surry Hills is Firm, used by 33.3% of listings.
- There's a relatively balanced mix between guest-friendly (39.6%) and stricter (41.6%) policies, offering choices for different guest needs.
- Strict cancellation policies are quite rare (8.3%), potentially making listings with this policy less competitive unless justified by high demand or property type.
Recommendations for Hosts
- Consider adopting a Firm policy to align with the 33.3% market standard in Surry Hills.
- Using a Strict policy might deter some guests, as only 8.3% of listings use it. Evaluate if potential revenue protection outweighs possible lower booking rates.
- Regularly review your cancellation policy against competitors and market demand shifts in Surry Hills.
Surry Hills STR Booking Lead Time Analysis (2026)
Average Booking Lead Time by Month
Booking Lead Time Insights for Surry Hills
- The overall average booking lead time for vacation rentals in Surry Hills is 33 days.
- Guests book furthest in advance for stays during November (average 50 days), likely coinciding with peak travel demand or local events.
- The shortest booking windows occur for stays in April (average 0 days), indicating more last-minute travel plans during this time.
- Seasonally, Fall (41 days avg.) sees the longest lead times, while Spring (0 days avg.) has the shortest, reflecting typical travel planning cycles.
Recommendations for Hosts
- Use the overall average lead time (33 days) as a baseline for your pricing and availability strategy in Surry Hills.
- For November stays, consider implementing length-of-stay discounts or slightly higher rates for bookings made less than 50 days out to capitalize on advance planning.
- During April, focus on last-minute booking availability and promotions, as guests book with very short notice (0 days avg.).
- Target marketing efforts for the Fall season well in advance (at least 41 days) to capture early planners.
- Monitor your own booking lead times against these Surry Hills averages to identify opportunities for dynamic pricing adjustments.
Popular & Essential Airbnb Amenities in Surry Hills (2026)
Amenity Prevalence
Amenity Insights for Surry Hills
- Essential amenities in Surry Hills that guests expect include: Wifi, Hot water, Hair dryer, Shampoo, Smoke alarm. Lacking these (any) could significantly impact bookings.
- Popular amenities like Kitchen, Bed linens, Dishes and silverware are common but not universal. Offering these can provide a competitive edge.
Recommendations for Hosts
- Ensure your listing includes all essential amenities for Surry Hills: Wifi, Hot water, Hair dryer, Shampoo, Smoke alarm.
- Prioritize adding missing essentials: Wifi, Hot water, Hair dryer, Shampoo, Smoke alarm.
- Consider adding popular differentiators like Kitchen or Bed linens to increase appeal.
- Highlight unique or less common amenities you offer (e.g., hot tub, dedicated workspace, EV charger) in your listing description and photos.
- Regularly check competitor amenities in Surry Hills to stay competitive.
Surry Hills Airbnb Guest Demographics & Profile Analysis (2026)
Guest Profile Summary for Surry Hills
- The typical guest profile for Airbnb in Surry Hills consists of a mix of domestic (43%) and international guests, with top international origins including United States, typically belonging to the Post-2000s (Gen Z/Alpha) group (50%), primarily speaking English or French.
- Domestic travelers account for 42.9% of guests.
- Key international markets include Australia (42.9%) and United States (8.6%).
- Top languages spoken are English (51.8%) followed by French (10.2%).
- A significant demographic segment is the Post-2000s (Gen Z/Alpha) group, representing 50% of guests.
Recommendations for Hosts
- Balance marketing efforts between domestic and international channels based on the guest mix.
- Tailor amenities and listing descriptions to appeal to the dominant Post-2000s (Gen Z/Alpha) demographic (e.g., highlight fast WiFi, smart home features, local guides).
- Highlight unique local experiences or amenities relevant to the primary guest profile.
- Consider seasonal promotions aligned with peak travel times for key origin markets.
Nearby Short-Term Rental Market Comparison
How does the Surry Hills Airbnb market stack up against its neighbors? Compare key performance metrics like average monthly revenue, ADR, and occupancy rates in surrounding areas to understand the broader regional STR landscape.
| Market | Active Properties | Monthly Revenue | Daily Rate | Avg. Occupancy |
|---|---|---|---|---|
| Berry | 118 | $5,709 | $559.76 | 40% |
| Dawes Point | 10 | $5,632 | $415.45 | 62% |
| Millers Point | 16 | $5,345 | $388.13 | 62% |
| Burrawang | 12 | $5,242 | $557.61 | 38% |
| Penrose | 13 | $5,227 | $681.36 | 40% |
| Nulkaba | 41 | $4,609 | $574.24 | 31% |
| Exeter | 34 | $4,551 | $515.98 | 41% |
| Jaspers Brush | 15 | $4,452 | $445.36 | 34% |
| The Council of the Municipality of Kiama | 109 | $4,372 | $437.99 | 42% |
| Robertson | 46 | $4,320 | $396.04 | 39% |