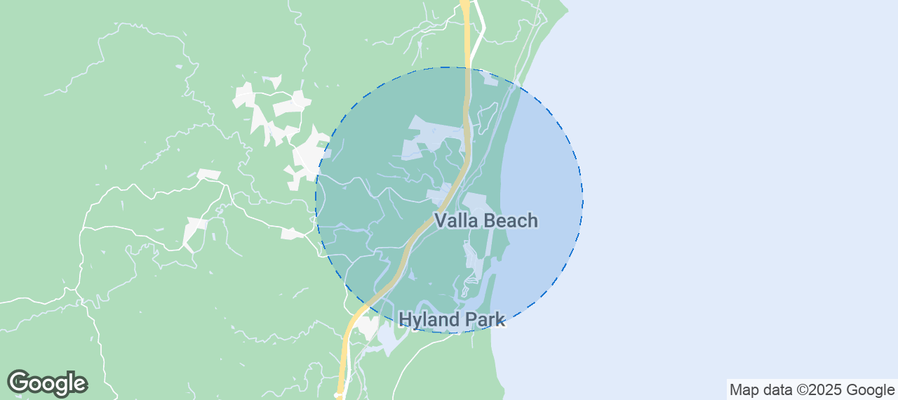
Valla Airbnb Market Analysis 2026: Short Term Rental Data & Vacation Rental Statistics in New South Wales, Australia
Is Airbnb profitable in Valla in 2026? Explore comprehensive Airbnb analytics for Valla, New South Wales, Australia to uncover income potential. This 2026 STR market report for Valla, based on AirROI data from February 2025 to January 2026, reveals key trends in the niche market of 21 active listings.
Whether you're considering an Airbnb investment in Valla, optimizing your existing vacation rental, or exploring rental arbitrage opportunities, understanding the Valla Airbnb data is crucial. Navigating the high regulation landscape is key to maximizing your short term rental income potential. Let's dive into the specifics.
Key Valla Airbnb Performance Metrics Overview
Monthly Airbnb Revenue Variations & Income Potential in Valla (2026)
Understanding the monthly revenue variations for Airbnb listings in Valla is key to maximizing your short term rental income potential. Seasonality significantly impacts earnings. Our analysis, based on data from the past 12 months, shows that the peak revenue month for STRs in Valla is typically January, while May often presents the lowest earnings, highlighting opportunities for strategic pricing adjustments during shoulder and low seasons. Explore the typical Airbnb income in Valla across different performance tiers:
- Best-in-class properties (Top 10%) achieve $2,740+ monthly, often utilizing dynamic pricing and superior guest experiences.
- Strong performing properties (Top 25%) earn $1,925 or more, indicating effective management and desirable locations/amenities.
- Typical properties (Median) generate around $1,169 per month, representing the average market performance.
- Entry-level properties (Bottom 25%) see earnings around $614, often with potential for optimization.
Average Monthly Airbnb Earnings Trend in Valla
Valla Airbnb Occupancy Rate Trends (2026)
Maximize your bookings by understanding the Valla STR occupancy trends. Seasonal demand shifts significantly influence how often properties are booked. Typically, Januarysees the highest demand (peak season occupancy), while May experiences the lowest (low season). Effective strategies, like adjusting minimum stays or offering promotions, can boost occupancy during slower periods. Here's how different property tiers perform in Valla:
- Best-in-class properties (Top 10%) achieve 63%+ occupancy, indicating high desirability and potentially optimized availability.
- Strong performing properties (Top 25%) maintain 49% or higher occupancy, suggesting good market fit and guest satisfaction.
- Typical properties (Median) have an occupancy rate around 30%.
- Entry-level properties (Bottom 25%) average 15% occupancy, potentially facing higher vacancy.
Average Monthly Occupancy Rate Trend in Valla
Average Daily Rate (ADR) Airbnb Trends in Valla (2026)
Effective short term rental pricing strategy in Valla involves understanding monthly ADR fluctuations. The Average Daily Rate (ADR) for Airbnb in Valla typically peaks in January and dips lowest during March. Leveraging Airbnb dynamic pricing tools or strategies based on this seasonality can significantly boost revenue. Here's a look at the typical nightly rates achieved:
- Best-in-class properties (Top 10%) command rates of $229+ per night, often due to premium features or locations.
- Strong performing properties (Top 25%) achieve nightly rates of $174 or more.
- Typical properties (Median) charge around $133 per night.
- Entry-level properties (Bottom 25%) earn around $105 per night.
Average Daily Rate (ADR) Trend by Month in Valla
Get Live Valla Market Intelligence 👇
Explore Real-time Analytics
Airbnb Seasonality Analysis & Trends in Valla (2026)
Peak Season (January, October, December)
- Revenue averages $2,093 per month
- Occupancy rates average 42.0%
- Daily rates average $178
Shoulder Season
- Revenue averages $1,345 per month
- Occupancy maintains around 32.7%
- Daily rates hold near $150
Low Season (March, May, September)
- Revenue drops to average $1,001 per month
- Occupancy decreases to average 29.1%
- Daily rates adjust to average $141
Seasonality Insights for Valla
- The Airbnb seasonality in Valla shows highly seasonal trends requiring careful strategy. While the sections above show seasonal averages, it's also insightful to look at the extremes:
- During the high season, the absolute peak month showcases Valla's highest earning potential, with monthly revenues capable of climbing to $2,409, occupancy reaching a high of 47.9%, and ADRs peaking at $180.
- Conversely, the slowest single month of the year, typically falling within the low season, marks the market's lowest point. In this month, revenue might dip to $834, occupancy could drop to 20.7%, and ADRs may adjust down to $137.
- Understanding both the seasonal averages and these monthly peaks and troughs in revenue, occupancy, and ADR is crucial for maximizing your Airbnb profit potential in Valla.
Seasonal Strategies for Maximizing Profit
- Peak Season: Maximize revenue through premium pricing and potentially longer minimum stays. Ensure high availability.
- Low Season: Offer competitive pricing, special promotions (e.g., extended stay discounts), and flexible cancellation policies. Target off-season travelers like remote workers or budget-conscious guests.
- Shoulder Seasons: Implement dynamic pricing that balances peak and low rates. Target weekend travelers or specific events. Offer slightly more flexible terms than peak season.
- Regularly analyze your own performance against these Valla seasonality benchmarks and adjust your pricing and availability strategy accordingly.
Best Areas for Airbnb Investment in Valla (2026)
Exploring the top neighborhoods for short-term rentals in Valla? This section highlights key areas, outlining why they are attractive for hosts and guests, along with notable local attractions. Consider these locations based on your target guest profile and investment strategy.
| Neighborhood / Area | Why Host Here? (Target Guests & Appeal) | Key Attractions & Landmarks |
|---|---|---|
| Valla Beach | Stunning coastal location known for its beautiful beaches and relaxed atmosphere. Ideal for families and beach lovers seeking a vacation getaway. | Valla Beach Recreation Area, Nambucca Heads, Shelly Beach, Macksville, Bushwalking trails |
| Nambucca Heads | Charming town at the mouth of the Nambucca River, known for its scenic views, perfect for water activities and relaxing getaways. | Nambucca Heads Island, V Wall, Boat Hire, Surf Beaches, Picnic Areas |
| Macksville | A picturesque town with rich history and access to beautiful hinterland and river, making it a peaceful retreat for guests. | Macksville Memorial Park, Nambucca River, Macksville Showground, Local Markets |
| Scotts Head | Beautiful coastal village famous for its surf breaks and stunning scenic views, perfect for surfers and nature lovers. | Scotts Head Beach, Merimbula, Scotts Head Lookout, Dolphin watching |
| Coffs Harbour | Major regional center with national parks, beaches, and attractions, appealing to a wide range of visitors from families to adventure seekers. | Big Banana, Coffs Harbour Jetty, Solitary Islands Marine Park, Botanic Gardens |
| Urunga | Picturesque riverside town that is great for fishing, kayaking and enjoying natural beauty, ideal for relaxed vacations. | Urunga Boardwalk, Urunga Lagoon, Fishing spots, Surf Beach |
| Bellingen | Known for its vibrant arts scene and stunning natural surroundings, perfect for those looking for a cultural experience combined with nature. | Bellingen Markets, Bellingen River, Art galleries, Nature walks |
| Dorrigo | A quaint township located in the lush hinterland, famous for its national parks and waterfalls, appealing for nature lovers. | Dorrigo National Park, Dangar Falls, Skywalk, Rainforest walks |
Understanding Airbnb License Requirements & STR Laws in Valla (2026)
Yes, Valla, New South Wales, Australia enforces high STR regulations. Obtaining a license and ensuring compliance is almost certainly required according to current 2026 STR laws. Always verify the latest short term rental regulations and Airbnb license requirements directly with local government authorities for Valla to ensure full compliance before hosting.
(Source: AirROI data, 2026, based on 95% licensed listings)
Top Performing Airbnb Properties in Valla (2026)
Benchmark your potential! Explore examples of top-performing Airbnb properties in Vallabased on Trailing Twelve Month (TTM) revenue. Analyze their characteristics, revenue, occupancy rate, and ADR to understand what drives success in this market.
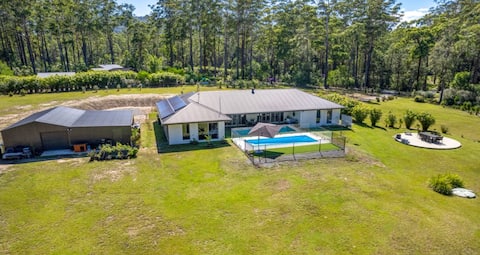
Endless Summer Home - 4 Bedrooms, Pool & Alfresco
Entire Place • 4 bedrooms
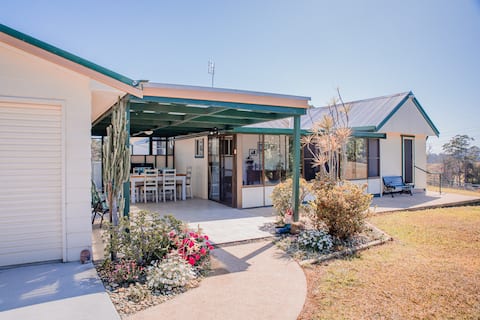
Marys Retreat Valla, a cozy farmhouse on acreage
Entire Place • 3 bedrooms

Cosy Palms Cottage Pet Friendly enclosed yard
Entire Place • 1 bedroom

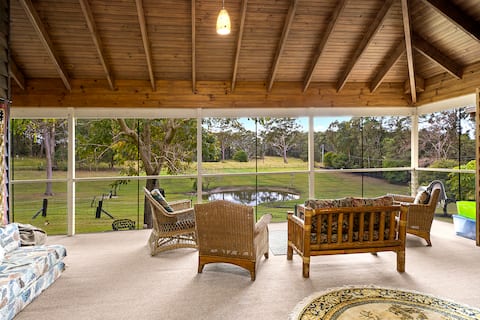
Large Deck, Private Gardens, Spacious Lush Bush
Entire Place • 3 bedrooms

Kookaburra Cottage
Entire Place • 1 bedroom
Ann's Coastal Chalet
Entire Place • 3 bedrooms
Note: Performance varies based on location, size, amenities, seasonality, and management quality. Data reflects the past 12 months.
Top Performing Airbnb Hosts in Valla (2026)
Learn from the best! This table showcases top-performing Airbnb hosts in Valla based on the number of properties managed and estimated total revenue over the past year. Analyze their scale and performance metrics.
| Host Name | Properties | Grossing Revenue | Stay Reviews | Avg Rating |
|---|---|---|---|---|
| Madeleine | 3 | $64,660 | 76 | 5.00/5.0 |
| Annette | 2 | $35,810 | 610 | 4.86/5.0 |
| Gita | 2 | $33,818 | 210 | 4.89/5.0 |
| Lorraine | 1 | $22,098 | 47 | 4.98/5.0 |
| Erez | 1 | $19,368 | 115 | 4.69/5.0 |
| Patricia Kathleen | 1 | $18,774 | 67 | 4.94/5.0 |
| Simon And Aurelie | 1 | $16,258 | 473 | 4.96/5.0 |
| Clare And David | 1 | $15,015 | 142 | 4.77/5.0 |
| Lou | 2 | $10,832 | 114 | 4.87/5.0 |
| Heidi | 1 | $6,231 | 21 | 4.86/5.0 |
Analyzing the strategies of top hosts, such as their property selection, pricing, and guest communication, can offer valuable lessons for optimizing your own Airbnb operations in Valla.
Dive Deeper: Advanced Valla STR Market Data (2026)
Ready to unlock more insights? AirROI provides access to advanced metrics and comprehensive Airbnb data for Valla. Explore detailed analytics beyond this report to refine your investment strategy, optimize pricing, and maximize your vacation rental profits.
Explore Advanced MetricsValla Short-Term Rental Market Composition (2026): Property & Room Types
Room Type Distribution
Property Type Distribution
Market Composition Insights for Valla
- The Valla Airbnb market composition is heavily skewed towards Entire Home/Apt listings, which make up 100% of the 21 active rentals. This indicates strong guest preference for privacy and space.
- Looking at the property type distribution in Valla, House properties are the most common (33.3%), reflecting the local real estate landscape.
- Houses represent a significant 33.3% portion, catering likely to families or larger groups.
- The presence of 23.8% Hotel/Boutique listings indicates integration with traditional hospitality.
Valla Airbnb Room Capacity Analysis (2026): Bedroom Distribution
Distribution of Listings by Number of Bedrooms
Room Capacity Insights for Valla
- The dominant room capacity in Valla is 1 bedroom listings, making up 52.4% of the market. This suggests a strong demand for properties suitable for couples or solo travelers.
- Together, 1 bedroom and 2 bedrooms properties represent 71.4% of the active Airbnb listings in Valla, indicating a high concentration in these sizes.
- With over half the market (52.4%) consisting of studios or 1-bedroom units, Valla is particularly well-suited for individuals or couples.
- A significant 28.5% of listings offer 3+ bedrooms, catering to larger groups and families seeking more space in Valla.
Valla Vacation Rental Guest Capacity Trends (2026)
Distribution of Listings by Guest Capacity
Guest Capacity Insights for Valla
- The most common guest capacity trend in Valla vacation rentals is listings accommodating 2 guests (28.6%). This suggests the primary traveler segment is likely couples or solo travelers.
- Properties designed for 2 guests and 4 guests dominate the Valla STR market, accounting for 57.2% of listings.
- 33.3% of properties accommodate 6+ guests, serving the market segment for larger families or group travel in Valla.
- On average, properties in Valla are equipped to host 4.5 guests.
Valla Airbnb Booking Patterns (2026): Available vs. Booked Days
Available Days Distribution
Booked Days Distribution
Booking Pattern Insights for Valla
- The most common availability pattern in Valla falls within the 271-366 days range, representing 61.9% of listings. This suggests many properties have significant open periods on their calendars.
- Approximately 85.7% of listings show high availability (181+ days open annually), indicating potential for increased bookings or specific owner usage patterns.
- For booked days, the 1-30 days range is most frequent in Valla (33.3%), reflecting common guest stay durations or potential owner blocking patterns.
- A notable 14.3% of properties secure long booking periods (181+ days booked per year), highlighting successful long-term rental strategies or significant owner usage.
Valla Airbnb Minimum Stay Requirements Analysis
Distribution of Listings by Minimum Night Requirement
1 Night
11 listings
52.4% of total
2 Nights
7 listings
33.3% of total
3 Nights
1 listings
4.8% of total
30+ Nights
2 listings
9.5% of total
Key Insights
- The most prevalent minimum stay requirement in Valla is 1 Night, adopted by 52.4% of listings. This highlights the market's preference for shorter, flexible bookings.
- A strong majority (85.7%) of the Valla Airbnb data shows acceptance of very short stays (1-2 nights), indicating a dynamic, high-turnover market.
Recommendations
- Align with the market by considering a 1 Night minimum stay, as 52.4% of Valla hosts use this setting.
- Explore offering discounts for stays of 30+ nights to attract the 9.5% of the market seeking extended stays.
- Adjust minimum nights based on seasonality – potentially shorter during low season and longer during peak demand periods in Valla.
Valla Airbnb Cancellation Policy Trends Analysis (2026)
Flexible
6 listings
28.6% of total
Moderate
10 listings
47.6% of total
Firm
3 listings
14.3% of total
Strict
2 listings
9.5% of total
Cancellation Policy Insights for Valla
- The prevailing Airbnb cancellation policy trend in Valla is Moderate, used by 47.6% of listings.
- The market strongly favors guest-friendly terms, with 76.2% of listings offering Flexible or Moderate policies. This suggests guests in Valla may expect booking flexibility.
- Strict cancellation policies are quite rare (9.5%), potentially making listings with this policy less competitive unless justified by high demand or property type.
Recommendations for Hosts
- Consider adopting a Moderate policy to align with the 47.6% market standard in Valla.
- Using a Strict policy might deter some guests, as only 9.5% of listings use it. Evaluate if potential revenue protection outweighs possible lower booking rates.
- Regularly review your cancellation policy against competitors and market demand shifts in Valla.
Valla STR Booking Lead Time Analysis (2026)
Average Booking Lead Time by Month
Booking Lead Time Insights for Valla
- The overall average booking lead time for vacation rentals in Valla is 40 days.
- Guests book furthest in advance for stays during December (average 60 days), likely coinciding with peak travel demand or local events.
- The shortest booking windows occur for stays in May (average 25 days), indicating more last-minute travel plans during this time.
- Seasonally, Winter (51 days avg.) sees the longest lead times, while Spring (31 days avg.) has the shortest, reflecting typical travel planning cycles.
Recommendations for Hosts
- Use the overall average lead time (40 days) as a baseline for your pricing and availability strategy in Valla.
- For December stays, consider implementing length-of-stay discounts or slightly higher rates for bookings made less than 60 days out to capitalize on advance planning.
- Target marketing efforts for the Winter season well in advance (at least 51 days) to capture early planners.
- Monitor your own booking lead times against these Valla averages to identify opportunities for dynamic pricing adjustments.
Popular & Essential Airbnb Amenities in Valla (2026)
Amenity Prevalence
Amenity Insights for Valla
- Essential amenities in Valla that guests expect include: Smoke alarm, Free parking on premises, Bed linens. Lacking these (any) could significantly impact bookings.
- Popular amenities like Dishes and silverware, Hot water, Kitchen are common but not universal. Offering these can provide a competitive edge.
Recommendations for Hosts
- Ensure your listing includes all essential amenities for Valla: Smoke alarm, Free parking on premises, Bed linens.
- Prioritize adding missing essentials: Free parking on premises, Bed linens.
- Consider adding popular differentiators like Dishes and silverware or Hot water to increase appeal.
- Highlight unique or less common amenities you offer (e.g., hot tub, dedicated workspace, EV charger) in your listing description and photos.
- Regularly check competitor amenities in Valla to stay competitive.
Valla Airbnb Guest Demographics & Profile Analysis (2026)
Guest Profile Summary for Valla
- The typical guest profile for Airbnb in Valla consists of primarily domestic travelers (88%), often arriving from nearby Sydney, typically belonging to the Post-2000s (Gen Z/Alpha) group (50%), primarily speaking English or Spanish.
- Domestic travelers account for 88.1% of guests.
- Key international markets include Australia (88.1%) and United Kingdom (5%).
- Top languages spoken are English (68.1%) followed by Spanish (5.6%).
- A significant demographic segment is the Post-2000s (Gen Z/Alpha) group, representing 50% of guests.
Recommendations for Hosts
- Target domestic marketing efforts towards travelers from Sydney and New South Wales.
- Tailor amenities and listing descriptions to appeal to the dominant Post-2000s (Gen Z/Alpha) demographic (e.g., highlight fast WiFi, smart home features, local guides).
- Highlight unique local experiences or amenities relevant to the primary guest profile.
- Consider seasonal promotions aligned with peak travel times for key origin markets.
Nearby Short-Term Rental Market Comparison
How does the Valla Airbnb market stack up against its neighbors? Compare key performance metrics like average monthly revenue, ADR, and occupancy rates in surrounding areas to understand the broader regional STR landscape.
| Market | Active Properties | Monthly Revenue | Daily Rate | Avg. Occupancy |
|---|---|---|---|---|
| Fernmount | 16 | $2,889 | $292.41 | 38% |
| Gleniffer | 32 | $2,767 | $354.22 | 38% |
| Minnie Water | 13 | $2,696 | $236.11 | 41% |
| Sawtell | 147 | $2,568 | $264.40 | 39% |
| Coffs Harbour | 332 | $2,568 | $239.30 | 42% |
| Emerald Beach | 48 | $2,549 | $274.32 | 42% |
| Clarence Valley Council | 79 | $2,465 | $255.04 | 39% |
| Korora | 48 | $2,434 | $245.87 | 43% |
| Yamba | 432 | $2,385 | $312.91 | 34% |
| Bellingen Shire Council | 12 | $2,345 | $156.34 | 50% |