Darwin Airbnb Market Analysis 2026: Short Term Rental Data & Vacation Rental Statistics in Northern Territory, Australia
Is Airbnb profitable in Darwin in 2026? Explore comprehensive Airbnb analytics for Darwin, Northern Territory, Australia to uncover income potential. This 2026 STR market report for Darwin, based on AirROI data from February 2025 to January 2026, reveals key trends in the market of 671 active listings.
Whether you're considering an Airbnb investment in Darwin, optimizing your existing vacation rental, or exploring rental arbitrage opportunities, understanding the Darwin Airbnb data is crucial. Leveraging the low regulation environment is key to maximizing your short term rental income potential. Let's dive into the specifics.
Key Darwin Airbnb Performance Metrics Overview
Monthly Airbnb Revenue Variations & Income Potential in Darwin (2026)
Understanding the monthly revenue variations for Airbnb listings in Darwin is key to maximizing your short term rental income potential. Seasonality significantly impacts earnings. Our analysis, based on data from the past 12 months, shows that the peak revenue month for STRs in Darwin is typically July, while February often presents the lowest earnings, highlighting opportunities for strategic pricing adjustments during shoulder and low seasons. Explore the typical Airbnb income in Darwin across different performance tiers:
- Best-in-class properties (Top 10%) achieve $6,454+ monthly, often utilizing dynamic pricing and superior guest experiences.
- Strong performing properties (Top 25%) earn $4,195 or more, indicating effective management and desirable locations/amenities.
- Typical properties (Median) generate around $2,527 per month, representing the average market performance.
- Entry-level properties (Bottom 25%) see earnings around $1,289, often with potential for optimization.
Average Monthly Airbnb Earnings Trend in Darwin
Darwin Airbnb Occupancy Rate Trends (2026)
Maximize your bookings by understanding the Darwin STR occupancy trends. Seasonal demand shifts significantly influence how often properties are booked. Typically, Julysees the highest demand (peak season occupancy), while January experiences the lowest (low season). Effective strategies, like adjusting minimum stays or offering promotions, can boost occupancy during slower periods. Here's how different property tiers perform in Darwin:
- Best-in-class properties (Top 10%) achieve 87%+ occupancy, indicating high desirability and potentially optimized availability.
- Strong performing properties (Top 25%) maintain 73% or higher occupancy, suggesting good market fit and guest satisfaction.
- Typical properties (Median) have an occupancy rate around 53%.
- Entry-level properties (Bottom 25%) average 29% occupancy, potentially facing higher vacancy.
Average Monthly Occupancy Rate Trend in Darwin
Average Daily Rate (ADR) Airbnb Trends in Darwin (2026)
Effective short term rental pricing strategy in Darwin involves understanding monthly ADR fluctuations. The Average Daily Rate (ADR) for Airbnb in Darwin typically peaks in July and dips lowest during February. Leveraging Airbnb dynamic pricing tools or strategies based on this seasonality can significantly boost revenue. Here's a look at the typical nightly rates achieved:
- Best-in-class properties (Top 10%) command rates of $339+ per night, often due to premium features or locations.
- Strong performing properties (Top 25%) achieve nightly rates of $232 or more.
- Typical properties (Median) charge around $161 per night.
- Entry-level properties (Bottom 25%) earn around $110 per night.
Average Daily Rate (ADR) Trend by Month in Darwin
Get Live Darwin Market Intelligence 👇

Explore Real-time Analytics
Airbnb Seasonality Analysis & Trends in Darwin (2026)
Peak Season (July, August, September)
- Revenue averages $4,936 per month
- Occupancy rates average 66.3%
- Daily rates average $223
Shoulder Season
- Revenue averages $2,981 per month
- Occupancy maintains around 48.5%
- Daily rates hold near $189
Low Season (January, February, March)
- Revenue drops to average $1,902 per month
- Occupancy decreases to average 41.2%
- Daily rates adjust to average $165
Seasonality Insights for Darwin
- The Airbnb seasonality in Darwin shows highly seasonal trends requiring careful strategy. While the sections above show seasonal averages, it's also insightful to look at the extremes:
- During the high season, the absolute peak month showcases Darwin's highest earning potential, with monthly revenues capable of climbing to $5,546, occupancy reaching a high of 71.5%, and ADRs peaking at $229.
- Conversely, the slowest single month of the year, typically falling within the low season, marks the market's lowest point. In this month, revenue might dip to $1,630, occupancy could drop to 35.6%, and ADRs may adjust down to $157.
- Understanding both the seasonal averages and these monthly peaks and troughs in revenue, occupancy, and ADR is crucial for maximizing your Airbnb profit potential in Darwin.
Seasonal Strategies for Maximizing Profit
- Peak Season: Maximize revenue through premium pricing and potentially longer minimum stays. Ensure high availability.
- Low Season: Offer competitive pricing, special promotions (e.g., extended stay discounts), and flexible cancellation policies. Target off-season travelers like remote workers or budget-conscious guests.
- Shoulder Seasons: Implement dynamic pricing that balances peak and low rates. Target weekend travelers or specific events. Offer slightly more flexible terms than peak season.
- Regularly analyze your own performance against these Darwin seasonality benchmarks and adjust your pricing and availability strategy accordingly.
Best Areas for Airbnb Investment in Darwin (2026)
Exploring the top neighborhoods for short-term rentals in Darwin? This section highlights key areas, outlining why they are attractive for hosts and guests, along with notable local attractions. Consider these locations based on your target guest profile and investment strategy.
| Neighborhood / Area | Why Host Here? (Target Guests & Appeal) | Key Attractions & Landmarks |
|---|---|---|
| Darwin Waterfront | A vibrant hub with restaurants, bars, and a beautiful lagoon. It's a popular destination for tourists looking for relaxation and entertainment by the water. | Darwin Lagoon, Wave Lagoon, Darwin Convention Centre, Mindil Beach Sunset Market, Stokes Hill Wharf |
| Cullen Bay | Known for its luxury apartments and marina views. Attracts both tourists and residents seeking a picturesque and lively atmosphere. | Cullen Bay Marina, Cullen Bay Beach, Restaurants and cafes, Fishing and boating activities |
| Parap | A cultural and artistic area famous for markets and vibrant community events. Great for visitors who want to experience local lifestyle and cuisine. | Parap Village Markets, Museum and Art Gallery of Northern Territory, Parap Swimming Pool, Local cafes and restaurants |
| Larrakeyah | Close to the city center and the Esplanade. Offers a mix of residential living and access to urban amenities, appealing to both tourists and business travelers. | The Esplanade, Cullen Bay, Botanic Gardens, Nearby beaches |
| Gardens | Home to beautiful parks and gardens. Attracts those who enjoy nature and scenic views, offering a more relaxed atmosphere away from the hustle and bustle. | Botanic Gardens, George Brown Darwin Botanic Gardens, Gardens Park, Cycling and walking paths |
| Nightcliff | Offers stunning views of the coastline and is famous for its sunsets. Attracts families and tourists looking for beachside relaxation and culinary experiences. | Nightcliff Beach, Nightcliff Foreshore, Cafes along the foreshore, Local markets |
| Fannie Bay | Known for its proximity to the beach and heritage-listed homes. Attracts visitors interested in history, culture, and outdoor activities. | Fannie Bay Gaol, East Point Reserve, Fannie Bay Beach, Cycling tracks |
| Palmerston City | A growing area with family-friendly attractions and community events. Ideal for those looking for space and recreational activities outside the main tourist areas. | Palmerston Shopping Centre, Palmerston Recreation Centre, Local parks, Community events |
Understanding Airbnb License Requirements & STR Laws in Darwin (2026)
While Darwin, Northern Territory, Australia currently shows low STR regulations, specific Airbnb license requirements might still exist or change. Always verify the latest short term rental regulations and Airbnb license requirements directly with local government authorities for Darwin to ensure full compliance before hosting.
(Source: AirROI data, 2026, based on 0% licensed listings)
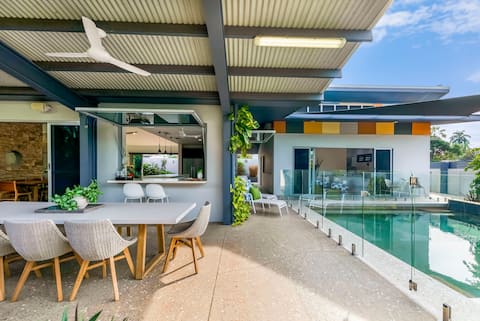
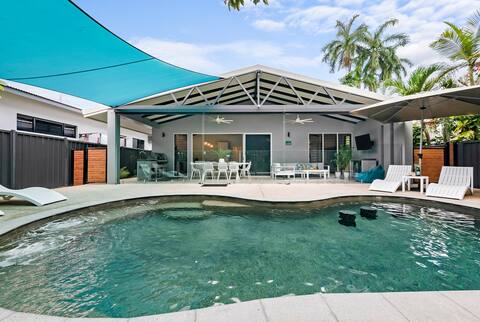
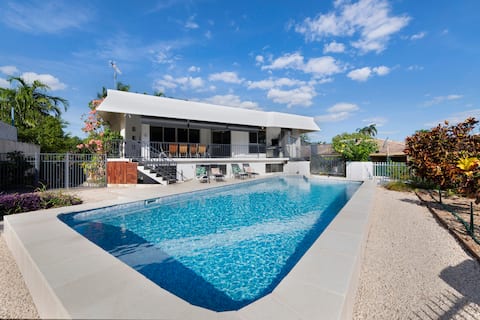
Top Performing Airbnb Properties in Darwin (2026)
Benchmark your potential! Explore examples of top-performing Airbnb properties in Darwinbased on Trailing Twelve Month (TTM) revenue. Analyze their characteristics, revenue, occupancy rate, and ADR to understand what drives success in this market.
The Lily Pad: Parap Poolside Luxury with Studio
Entire Place • 4 bedrooms

Freshwater Retreat - Luxury Group Accommodation
Entire Place • 8 bedrooms
Gardens Villa: A Sumptuous Poolside Family Oasis
Entire Place • 4 bedrooms
Arafura Blue: Walk Everywhere along the Foreshore
Entire Place • 5 bedrooms

Gunya Luxury: Top End Living in Fannie Bay
Entire Place • 4 bedrooms

Lily Pad Retreat—A Luxe Poolside Parap Oasis
Entire Place • 3 bedrooms
Note: Performance varies based on location, size, amenities, seasonality, and management quality. Data reflects the past 12 months.
Top Performing Airbnb Hosts in Darwin (2026)
Learn from the best! This table showcases top-performing Airbnb hosts in Darwin based on the number of properties managed and estimated total revenue over the past year. Analyze their scale and performance metrics.
| Host Name | Properties | Grossing Revenue | Stay Reviews | Avg Rating |
|---|---|---|---|---|
| Lina | 105 | $4,957,287 | 4063 | 4.77/5.0 |
| Benji | 56 | $2,695,144 | 1687 | 4.79/5.0 |
| Helen And Chris | 35 | $1,168,654 | 1152 | 4.86/5.0 |
| Shelley | 19 | $976,458 | 772 | 4.84/5.0 |
| Benji | 12 | $640,145 | 641 | 4.74/5.0 |
| Leanne | 12 | $618,154 | 774 | 4.94/5.0 |
| Ali | 13 | $332,070 | 555 | 4.90/5.0 |
| Matthew | 6 | $282,695 | 180 | 4.81/5.0 |
| Kaia | 6 | $238,367 | 118 | 4.78/5.0 |
| Michelle | 13 | $182,877 | 1047 | 4.70/5.0 |
Analyzing the strategies of top hosts, such as their property selection, pricing, and guest communication, can offer valuable lessons for optimizing your own Airbnb operations in Darwin.
Dive Deeper: Advanced Darwin STR Market Data (2026)
Ready to unlock more insights? AirROI provides access to advanced metrics and comprehensive Airbnb data for Darwin. Explore detailed analytics beyond this report to refine your investment strategy, optimize pricing, and maximize your vacation rental profits.
Explore Advanced MetricsDarwin Short-Term Rental Market Composition (2026): Property & Room Types
Room Type Distribution
Property Type Distribution
Market Composition Insights for Darwin
- The Darwin Airbnb market composition is heavily skewed towards Entire Home/Apt listings, which make up 87.8% of the 671 active rentals. This indicates strong guest preference for privacy and space.
- Looking at the property type distribution in Darwin, Apartment/Condo properties are the most common (69.2%), reflecting the local real estate landscape.
- Houses represent a significant 19.4% portion, catering likely to families or larger groups.
- The presence of 8.8% Hotel/Boutique listings indicates integration with traditional hospitality.
- Smaller segments like others, outdoor/unique, unique stays (combined 2.6%) offer potential for unique stay experiences.
Darwin Airbnb Room Capacity Analysis (2026): Bedroom Distribution
Distribution of Listings by Number of Bedrooms
Room Capacity Insights for Darwin
- The dominant room capacity in Darwin is 1 bedroom listings, making up 35.5% of the market. This suggests a strong demand for properties suitable for couples or solo travelers.
- Together, 1 bedroom and 2 bedrooms properties represent 63.4% of the active Airbnb listings in Darwin, indicating a high concentration in these sizes.
- A significant 25.2% of listings offer 3+ bedrooms, catering to larger groups and families seeking more space in Darwin.
Darwin Vacation Rental Guest Capacity Trends (2026)
Distribution of Listings by Guest Capacity
Guest Capacity Insights for Darwin
- The most common guest capacity trend in Darwin vacation rentals is listings accommodating 2 guests (32.2%). This suggests the primary traveler segment is likely couples or solo travelers.
- Properties designed for 2 guests and 4 guests dominate the Darwin STR market, accounting for 57.5% of listings.
- 25.4% of properties accommodate 6+ guests, serving the market segment for larger families or group travel in Darwin.
- On average, properties in Darwin are equipped to host 3.7 guests.
Darwin Airbnb Booking Patterns (2026): Available vs. Booked Days
Available Days Distribution
Booked Days Distribution
Booking Pattern Insights for Darwin
- The most common availability pattern in Darwin falls within the 181-270 days range, representing 35.8% of listings. This suggests many properties have significant open periods on their calendars.
- Approximately 67.7% of listings show high availability (181+ days open annually), indicating potential for increased bookings or specific owner usage patterns.
- For booked days, the 91-180 days range is most frequent in Darwin (36.5%), reflecting common guest stay durations or potential owner blocking patterns.
- A notable 33.5% of properties secure long booking periods (181+ days booked per year), highlighting successful long-term rental strategies or significant owner usage.
Darwin Airbnb Minimum Stay Requirements Analysis
Distribution of Listings by Minimum Night Requirement
1 Night
99 listings
14.8% of total
2 Nights
104 listings
15.5% of total
3 Nights
66 listings
9.8% of total
4-6 Nights
48 listings
7.2% of total
7-29 Nights
12 listings
1.8% of total
30+ Nights
342 listings
51% of total
Key Insights
- The most prevalent minimum stay requirement in Darwin is 30+ Nights, adopted by 51% of listings. This highlights the market's preference for longer commitments.
- A significant segment (51%) caters to monthly stays (30+ nights) in Darwin, pointing to opportunities in the extended-stay market.
Recommendations
- Align with the market by considering a 30+ Nights minimum stay, as 51% of Darwin hosts use this setting.
- If feasible, allowing 1-night stays, especially midweek or during low season, could capture last-minute bookings, as only 14.8% currently do.
- Explore offering discounts for stays of 30+ nights to attract the 51% of the market seeking extended stays.
- Adjust minimum nights based on seasonality – potentially shorter during low season and longer during peak demand periods in Darwin.
Darwin Airbnb Cancellation Policy Trends Analysis (2026)
Limited
1 listings
0.1% of total
Super Strict 30 Days
1 listings
0.1% of total
Super Strict 60 Days
2 listings
0.3% of total
Flexible
118 listings
17.6% of total
Moderate
374 listings
55.7% of total
Firm
125 listings
18.6% of total
Strict
50 listings
7.5% of total
Cancellation Policy Insights for Darwin
- The prevailing Airbnb cancellation policy trend in Darwin is Moderate, used by 55.7% of listings.
- The market strongly favors guest-friendly terms, with 73.3% of listings offering Flexible or Moderate policies. This suggests guests in Darwin may expect booking flexibility.
- Strict cancellation policies are quite rare (7.5%), potentially making listings with this policy less competitive unless justified by high demand or property type.
Recommendations for Hosts
- Consider adopting a Moderate policy to align with the 55.7% market standard in Darwin.
- Using a Strict policy might deter some guests, as only 7.5% of listings use it. Evaluate if potential revenue protection outweighs possible lower booking rates.
- Regularly review your cancellation policy against competitors and market demand shifts in Darwin.
Darwin STR Booking Lead Time Analysis (2026)
Average Booking Lead Time by Month
Booking Lead Time Insights for Darwin
- The overall average booking lead time for vacation rentals in Darwin is 59 days.
- Guests book furthest in advance for stays during September (average 84 days), likely coinciding with peak travel demand or local events.
- The shortest booking windows occur for stays in February (average 28 days), indicating more last-minute travel plans during this time.
- Seasonally, Summer (75 days avg.) sees the longest lead times, while Winter (41 days avg.) has the shortest, reflecting typical travel planning cycles.
Recommendations for Hosts
- Use the overall average lead time (59 days) as a baseline for your pricing and availability strategy in Darwin.
- For September stays, consider implementing length-of-stay discounts or slightly higher rates for bookings made less than 84 days out to capitalize on advance planning.
- Target marketing efforts for the Summer season well in advance (at least 75 days) to capture early planners.
- Monitor your own booking lead times against these Darwin averages to identify opportunities for dynamic pricing adjustments.
Popular & Essential Airbnb Amenities in Darwin (2026)
Amenity Prevalence
Amenity Insights for Darwin
- Essential amenities in Darwin that guests expect include: Air conditioning, TV, Wifi, Smoke alarm. Lacking these (any) could significantly impact bookings.
- Popular amenities like Washer, Kitchen, Dishes and silverware are common but not universal. Offering these can provide a competitive edge.
Recommendations for Hosts
- Ensure your listing includes all essential amenities for Darwin: Air conditioning, TV, Wifi, Smoke alarm.
- Prioritize adding missing essentials: Air conditioning, TV, Wifi, Smoke alarm.
- Consider adding popular differentiators like Washer or Kitchen to increase appeal.
- Highlight unique or less common amenities you offer (e.g., hot tub, dedicated workspace, EV charger) in your listing description and photos.
- Regularly check competitor amenities in Darwin to stay competitive.
Darwin Airbnb Guest Demographics & Profile Analysis (2026)
Guest Profile Summary for Darwin
- The typical guest profile for Airbnb in Darwin consists of primarily domestic travelers (81%), often arriving from nearby Melbourne, typically belonging to the Post-2000s (Gen Z/Alpha) group (50%), primarily speaking English or French.
- Domestic travelers account for 81.0% of guests.
- Key international markets include Australia (81%) and United Kingdom (3.9%).
- Top languages spoken are English (68.1%) followed by French (7.1%).
- A significant demographic segment is the Post-2000s (Gen Z/Alpha) group, representing 50% of guests.
Recommendations for Hosts
- Target domestic marketing efforts towards travelers from Melbourne and Darwin.
- Tailor amenities and listing descriptions to appeal to the dominant Post-2000s (Gen Z/Alpha) demographic (e.g., highlight fast WiFi, smart home features, local guides).
- Highlight unique local experiences or amenities relevant to the primary guest profile.
- Consider seasonal promotions aligned with peak travel times for key origin markets.
Nearby Short-Term Rental Market Comparison
How does the Darwin Airbnb market stack up against its neighbors? Compare key performance metrics like average monthly revenue, ADR, and occupancy rates in surrounding areas to understand the broader regional STR landscape.
| Market | Active Properties | Monthly Revenue | Daily Rate | Avg. Occupancy |
|---|---|---|---|---|
| Darwin Waterfront Precinct Municipality | 79 | $3,846 | $278.37 | 52% |
| Lake Bennett | 18 | $2,689 | $211.67 | 44% |
| Darwin City | 28 | $2,285 | $253.08 | 52% |
| Wagait Beach | 11 | $2,277 | $200.72 | 36% |
| Dundee Beach | 34 | $1,850 | $240.39 | 32% |
| Larrakeyah | 11 | $1,812 | $245.18 | 43% |
| Palmerston | 37 | $1,753 | $170.77 | 44% |
| Humpty Doo | 11 | $1,493 | $123.33 | 47% |