City of Brisbane Airbnb Market Analysis 2026: Short Term Rental Data & Vacation Rental Statistics in Queensland, Australia
Is Airbnb profitable in City of Brisbane in 2026? Explore comprehensive Airbnb analytics for City of Brisbane, Queensland, Australia to uncover income potential. This 2026 STR market report for City of Brisbane, based on AirROI data from February 2025 to January 2026, reveals key trends in the niche market of 40 active listings.
Whether you're considering an Airbnb investment in City of Brisbane, optimizing your existing vacation rental, or exploring rental arbitrage opportunities, understanding the City of Brisbane Airbnb data is crucial. Leveraging the low regulation environment is key to maximizing your short term rental income potential. Let's dive into the specifics.
Key City of Brisbane Airbnb Performance Metrics Overview
Monthly Airbnb Revenue Variations & Income Potential in City of Brisbane (2026)
Understanding the monthly revenue variations for Airbnb listings in City of Brisbane is key to maximizing your short term rental income potential. Seasonality significantly impacts earnings. Our analysis, based on data from the past 12 months, shows that the peak revenue month for STRs in City of Brisbane is typically December, while November often presents the lowest earnings, highlighting opportunities for strategic pricing adjustments during shoulder and low seasons. Explore the typical Airbnb income in City of Brisbane across different performance tiers:
- Best-in-class properties (Top 10%) achieve $4,710+ monthly, often utilizing dynamic pricing and superior guest experiences.
- Strong performing properties (Top 25%) earn $3,058 or more, indicating effective management and desirable locations/amenities.
- Typical properties (Median) generate around $2,028 per month, representing the average market performance.
- Entry-level properties (Bottom 25%) see earnings around $994, often with potential for optimization.
Average Monthly Airbnb Earnings Trend in City of Brisbane
City of Brisbane Airbnb Occupancy Rate Trends (2026)
Maximize your bookings by understanding the City of Brisbane STR occupancy trends. Seasonal demand shifts significantly influence how often properties are booked. Typically, Februarysees the highest demand (peak season occupancy), while May experiences the lowest (low season). Effective strategies, like adjusting minimum stays or offering promotions, can boost occupancy during slower periods. Here's how different property tiers perform in City of Brisbane:
- Best-in-class properties (Top 10%) achieve 87%+ occupancy, indicating high desirability and potentially optimized availability.
- Strong performing properties (Top 25%) maintain 74% or higher occupancy, suggesting good market fit and guest satisfaction.
- Typical properties (Median) have an occupancy rate around 55%.
- Entry-level properties (Bottom 25%) average 34% occupancy, potentially facing higher vacancy.
Average Monthly Occupancy Rate Trend in City of Brisbane
Average Daily Rate (ADR) Airbnb Trends in City of Brisbane (2026)
Effective short term rental pricing strategy in City of Brisbane involves understanding monthly ADR fluctuations. The Average Daily Rate (ADR) for Airbnb in City of Brisbane typically peaks in July and dips lowest during January. Leveraging Airbnb dynamic pricing tools or strategies based on this seasonality can significantly boost revenue. Here's a look at the typical nightly rates achieved:
- Best-in-class properties (Top 10%) command rates of $284+ per night, often due to premium features or locations.
- Strong performing properties (Top 25%) achieve nightly rates of $160 or more.
- Typical properties (Median) charge around $100 per night.
- Entry-level properties (Bottom 25%) earn around $73 per night.
Average Daily Rate (ADR) Trend by Month in City of Brisbane
Get Live City of Brisbane Market Intelligence 👇

Explore Real-time Analytics
Airbnb Seasonality Analysis & Trends in City of Brisbane (2026)
Peak Season (December, March, July)
- Revenue averages $2,728 per month
- Occupancy rates average 56.7%
- Daily rates average $171
Shoulder Season
- Revenue averages $2,287 per month
- Occupancy maintains around 53.3%
- Daily rates hold near $158
Low Season (May, August, November)
- Revenue drops to average $2,095 per month
- Occupancy decreases to average 49.4%
- Daily rates adjust to average $168
Seasonality Insights for City of Brisbane
- The Airbnb seasonality in City of Brisbane shows moderate seasonality with distinct peak and low periods. While the sections above show seasonal averages, it's also insightful to look at the extremes:
- During the high season, the absolute peak month showcases City of Brisbane's highest earning potential, with monthly revenues capable of climbing to $2,787, occupancy reaching a high of 59.2%, and ADRs peaking at $196.
- Conversely, the slowest single month of the year, typically falling within the low season, marks the market's lowest point. In this month, revenue might dip to $2,034, occupancy could drop to 45.4%, and ADRs may adjust down to $126.
- Understanding both the seasonal averages and these monthly peaks and troughs in revenue, occupancy, and ADR is crucial for maximizing your Airbnb profit potential in City of Brisbane.
Seasonal Strategies for Maximizing Profit
- Peak Season: Maximize revenue through premium pricing and potentially longer minimum stays. Ensure high availability.
- Low Season: Offer competitive pricing, special promotions (e.g., extended stay discounts), and flexible cancellation policies. Target off-season travelers like remote workers or budget-conscious guests.
- Shoulder Seasons: Implement dynamic pricing that balances peak and low rates. Target weekend travelers or specific events. Offer slightly more flexible terms than peak season.
- Regularly analyze your own performance against these City of Brisbane seasonality benchmarks and adjust your pricing and availability strategy accordingly.
Best Areas for Airbnb Investment in City of Brisbane (2026)
Exploring the top neighborhoods for short-term rentals in City of Brisbane? This section highlights key areas, outlining why they are attractive for hosts and guests, along with notable local attractions. Consider these locations based on your target guest profile and investment strategy.
| Neighborhood / Area | Why Host Here? (Target Guests & Appeal) | Key Attractions & Landmarks |
|---|---|---|
| South Bank | Vibrant cultural precinct with beautiful parklands, restaurants, and attractions. Ideal for tourists looking for a lively atmosphere and easy access to Brisbane's riverfront. | South Bank Parklands, Queensland Art Gallery, Queensland Museum, Streets Beach, GOMA (Gallery of Modern Art) |
| Fortitude Valley | Known for its nightlife, music scene, and diverse dining options. Attracts a younger crowd and those looking for entertainment and nightlife experiences. | Fortitude Valley Nightclubs, Chinatown, James Street, Valley Markets, Cloudland |
| West End | Bohemian neighborhood with a diverse community and a mix of cafes, bars, and markets. Popular among locals and visitors seeking a unique, relaxed vibe. | Boundary Street Markets, West End Ferry Terminal, Brewery tours, Cafes and Restaurants, Cultural events |
| Brisbane CBD | The heart of Brisbane's business district, offering a mix of corporate and leisure attractions. Ideal for business travelers and tourists alike. | Queen Street Mall, Botanic Gardens, Brisbane City Hall, Museum of Brisbane, South Bank |
| New Farm | Trendy suburb known for its parks and dining scene. Popular with families and young professionals, offering a relaxed atmosphere close to the city. | New Farm Park, Powerhouse Museum, Local cafes and galleries, Brisbane River Walk, Ferry services |
| Chermside | A major retail and commercial hub with a large shopping center. Draws shoppers and families looking for convenience and amenities. | Westfield Chermside, Civic Park, Chermside Aquatic Centre, Public transport access, Family-friendly amenities |
| Ascot | Upscale suburb known for its beautiful homes and proximity to the racecourse. Popular with affluent travelers seeking elegance and charm. | Eagle Farm Racecourse, Oriel Park, Ascot State School, Local boutiques and cafes, Proximity to Brisbane Airport |
| Mt Gravatt | Suburban area with parks and a strong sense of community. Attractive for families and those seeking a quieter area with good amenities. | Mt Gravatt Lookout, Local parks and recreation areas, Westfield Garden City, Public transport options, Family-oriented services |
Understanding Airbnb License Requirements & STR Laws in City of Brisbane (2026)
While City of Brisbane, Queensland, Australia currently shows low STR regulations, specific Airbnb license requirements might still exist or change. Always verify the latest short term rental regulations and Airbnb license requirements directly with local government authorities for City of Brisbane to ensure full compliance before hosting.
(Source: AirROI data, 2026, finding no licensed listings among those analyzed)
Top Performing Airbnb Properties in City of Brisbane (2026)
Benchmark your potential! Explore examples of top-performing Airbnb properties in City of Brisbanebased on Trailing Twelve Month (TTM) revenue. Analyze their characteristics, revenue, occupancy rate, and ADR to understand what drives success in this market.
Carseldine Castle, 5 Bedroom EV Charger Sleeps 12
Entire Place • 5 bedrooms
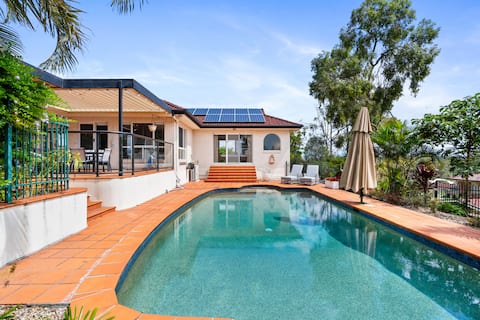
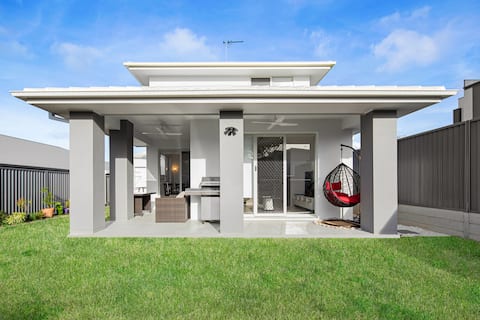
Peaceful Family Home: 4-Bed, Pool, Alfresco Dining
Entire Place • 4 bedrooms
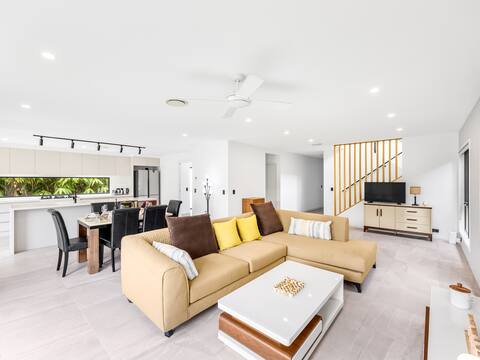
1min to Shop! BrandNew 4BR Modern Home Central A/C
Entire Place • 4 bedrooms

Sandgate Stunner 3Bd 2Bath
Entire Place • 3 bedrooms

Games Room! Unique Family Getaway, Great Location!
Entire Place • 3 bedrooms

Aspley Huge House Near Hypermarket
Entire Place • 6 bedrooms
Note: Performance varies based on location, size, amenities, seasonality, and management quality. Data reflects the past 12 months.
Top Performing Airbnb Hosts in City of Brisbane (2026)
Learn from the best! This table showcases top-performing Airbnb hosts in City of Brisbane based on the number of properties managed and estimated total revenue over the past year. Analyze their scale and performance metrics.
| Host Name | Properties | Grossing Revenue | Stay Reviews | Avg Rating |
|---|---|---|---|---|
| MadeComfy | 3 | $122,608 | 31 | 4.32/5.0 |
| Tye | 1 | $77,943 | 33 | 4.82/5.0 |
| Olivia | 1 | $52,891 | 16 | 4.56/5.0 |
| Christine | 1 | $51,665 | 21 | 4.90/5.0 |
| Rachael-Leigh | 1 | $49,991 | 43 | 4.93/5.0 |
| Yili | 1 | $49,746 | 26 | 4.50/5.0 |
| George | 1 | $37,803 | 74 | 4.97/5.0 |
| Aaron | 1 | $35,313 | 30 | 5.00/5.0 |
| Phuong | 1 | $34,376 | 40 | 4.95/5.0 |
| Conni | 2 | $33,439 | 89 | 4.99/5.0 |
Analyzing the strategies of top hosts, such as their property selection, pricing, and guest communication, can offer valuable lessons for optimizing your own Airbnb operations in City of Brisbane.
Dive Deeper: Advanced City of Brisbane STR Market Data (2026)
Ready to unlock more insights? AirROI provides access to advanced metrics and comprehensive Airbnb data for City of Brisbane. Explore detailed analytics beyond this report to refine your investment strategy, optimize pricing, and maximize your vacation rental profits.
Explore Advanced MetricsCity of Brisbane Short-Term Rental Market Composition (2026): Property & Room Types
Room Type Distribution
Property Type Distribution
Market Composition Insights for City of Brisbane
- The City of Brisbane Airbnb market composition is heavily skewed towards Entire Home/Apt listings, which make up 65% of the 40 active rentals. This indicates strong guest preference for privacy and space.
- However, a notable 35% share for Private Rooms suggests opportunities for budget-conscious travelers or hosts renting out spare rooms.
- Looking at the property type distribution in City of Brisbane, House properties are the most common (55%), reflecting the local real estate landscape.
- Houses represent a significant 55% portion, catering likely to families or larger groups.
- The presence of 12.5% Hotel/Boutique listings indicates integration with traditional hospitality.
- Smaller segments like unique stays (combined 2.5%) offer potential for unique stay experiences.
City of Brisbane Airbnb Room Capacity Analysis (2026): Bedroom Distribution
Distribution of Listings by Number of Bedrooms
Room Capacity Insights for City of Brisbane
- The dominant room capacity in City of Brisbane is 1 bedroom listings, making up 35% of the market. This suggests a strong demand for properties suitable for couples or solo travelers.
- Together, 1 bedroom and 2 bedrooms properties represent 50.0% of the active Airbnb listings in City of Brisbane, indicating a high concentration in these sizes.
City of Brisbane Vacation Rental Guest Capacity Trends (2026)
Distribution of Listings by Guest Capacity
Guest Capacity Insights for City of Brisbane
- The most common guest capacity trend in City of Brisbane vacation rentals is listings accommodating 2 guests (27.5%). This suggests the primary traveler segment is likely couples or solo travelers.
- Properties designed for 2 guests and 4 guests dominate the City of Brisbane STR market, accounting for 42.5% of listings.
- 17.5% of properties accommodate 6+ guests, serving the market segment for larger families or group travel in City of Brisbane.
- On average, properties in City of Brisbane are equipped to host 2.8 guests.
City of Brisbane Airbnb Booking Patterns (2026): Available vs. Booked Days
Available Days Distribution
Booked Days Distribution
Booking Pattern Insights for City of Brisbane
- The most common availability pattern in City of Brisbane falls within the 91-180 days range, representing 32.5% of listings. This suggests many properties have significant open periods on their calendars.
- Approximately 57.5% of listings show high availability (181+ days open annually), indicating potential for increased bookings or specific owner usage patterns.
- For booked days, the 181-270 days range is most frequent in City of Brisbane (35%), reflecting common guest stay durations or potential owner blocking patterns.
- A notable 45.0% of properties secure long booking periods (181+ days booked per year), highlighting successful long-term rental strategies or significant owner usage.
City of Brisbane Airbnb Minimum Stay Requirements Analysis
Distribution of Listings by Minimum Night Requirement
1 Night
11 listings
27.5% of total
2 Nights
10 listings
25% of total
3 Nights
6 listings
15% of total
4-6 Nights
1 listings
2.5% of total
7-29 Nights
2 listings
5% of total
30+ Nights
10 listings
25% of total
Key Insights
- The most prevalent minimum stay requirement in City of Brisbane is 1 Night, adopted by 27.5% of listings. This highlights the market's preference for shorter, flexible bookings.
- A significant segment (25%) caters to monthly stays (30+ nights) in City of Brisbane, pointing to opportunities in the extended-stay market.
Recommendations
- Align with the market by considering a 1 Night minimum stay, as 27.5% of City of Brisbane hosts use this setting.
- If feasible, allowing 1-night stays, especially midweek or during low season, could capture last-minute bookings, as only 27.5% currently do.
- Explore offering discounts for stays of 30+ nights to attract the 25% of the market seeking extended stays.
- Adjust minimum nights based on seasonality – potentially shorter during low season and longer during peak demand periods in City of Brisbane.
City of Brisbane Airbnb Cancellation Policy Trends Analysis (2026)
Limited
1 listings
2.5% of total
Flexible
13 listings
32.5% of total
Moderate
13 listings
32.5% of total
Firm
11 listings
27.5% of total
Strict
2 listings
5% of total
Cancellation Policy Insights for City of Brisbane
- The prevailing Airbnb cancellation policy trend in City of Brisbane is Flexible, used by 32.5% of listings.
- There's a relatively balanced mix between guest-friendly (65.0%) and stricter (32.5%) policies, offering choices for different guest needs.
- Strict cancellation policies are quite rare (5%), potentially making listings with this policy less competitive unless justified by high demand or property type.
Recommendations for Hosts
- Consider adopting a Flexible policy to align with the 32.5% market standard in City of Brisbane.
- Using a Strict policy might deter some guests, as only 5% of listings use it. Evaluate if potential revenue protection outweighs possible lower booking rates.
- Regularly review your cancellation policy against competitors and market demand shifts in City of Brisbane.
City of Brisbane STR Booking Lead Time Analysis (2026)
Average Booking Lead Time by Month
Booking Lead Time Insights for City of Brisbane
- The overall average booking lead time for vacation rentals in City of Brisbane is 32 days.
- Guests book furthest in advance for stays during December (average 73 days), likely coinciding with peak travel demand or local events.
- The shortest booking windows occur for stays in February (average 17 days), indicating more last-minute travel plans during this time.
- Seasonally, Fall (43 days avg.) sees the longest lead times, while Spring (26 days avg.) has the shortest, reflecting typical travel planning cycles.
Recommendations for Hosts
- Use the overall average lead time (32 days) as a baseline for your pricing and availability strategy in City of Brisbane.
- For December stays, consider implementing length-of-stay discounts or slightly higher rates for bookings made less than 73 days out to capitalize on advance planning.
- Target marketing efforts for the Fall season well in advance (at least 43 days) to capture early planners.
- Monitor your own booking lead times against these City of Brisbane averages to identify opportunities for dynamic pricing adjustments.
Popular & Essential Airbnb Amenities in City of Brisbane (2026)
Amenity Prevalence
Amenity Insights for City of Brisbane
- Essential amenities in City of Brisbane that guests expect include: Smoke alarm. Lacking these (this) could significantly impact bookings.
- Popular amenities like Wifi, Air conditioning, Hangers are common but not universal. Offering these can provide a competitive edge.
- Warning: Wifi is not universally provided but is considered essential globally. Ensure reliable Wifi is offered.
Recommendations for Hosts
- Ensure your listing includes all essential amenities for City of Brisbane: Smoke alarm.
- Prioritize adding missing essentials: Smoke alarm.
- Consider adding popular differentiators like Wifi or Air conditioning to increase appeal.
- Highlight unique or less common amenities you offer (e.g., hot tub, dedicated workspace, EV charger) in your listing description and photos.
- Regularly check competitor amenities in City of Brisbane to stay competitive.
City of Brisbane Airbnb Guest Demographics & Profile Analysis (2026)
Guest Profile Summary for City of Brisbane
- The typical guest profile for Airbnb in City of Brisbane consists of primarily domestic travelers (81%), often arriving from nearby Queensland, typically belonging to the Post-2000s (Gen Z/Alpha) group (50%), primarily speaking English or German.
- Domestic travelers account for 81.0% of guests.
- Key international markets include Australia (81%) and New Zealand (6%).
- Top languages spoken are English (71.4%) followed by German (5.9%).
- A significant demographic segment is the Post-2000s (Gen Z/Alpha) group, representing 50% of guests.
Recommendations for Hosts
- Target domestic marketing efforts towards travelers from Queensland and Brisbane.
- Tailor amenities and listing descriptions to appeal to the dominant Post-2000s (Gen Z/Alpha) demographic (e.g., highlight fast WiFi, smart home features, local guides).
- Highlight unique local experiences or amenities relevant to the primary guest profile.
- Consider seasonal promotions aligned with peak travel times for key origin markets.
Nearby Short-Term Rental Market Comparison
How does the City of Brisbane Airbnb market stack up against its neighbors? Compare key performance metrics like average monthly revenue, ADR, and occupancy rates in surrounding areas to understand the broader regional STR landscape.
| Market | Active Properties | Monthly Revenue | Daily Rate | Avg. Occupancy |
|---|---|---|---|---|
| Castaways Beach | 19 | $5,252 | $496.71 | 48% |
| Fingal | 13 | $4,377 | $305.13 | 54% |
| Noosa Heads | 1,033 | $4,015 | $387.33 | 46% |
| Byron Bay | 997 | $3,963 | $424.38 | 42% |
| Byron Shire Council | 193 | $3,807 | $423.69 | 42% |
| Sunrise Beach | 105 | $3,763 | $348.50 | 47% |
| Burleigh Heads | 28 | $3,610 | $342.10 | 50% |
| Point Lookout | 10 | $3,561 | $511.53 | 31% |
| Ewingsdale | 53 | $3,534 | $571.35 | 40% |
| Marcus Beach | 21 | $3,482 | $370.16 | 45% |