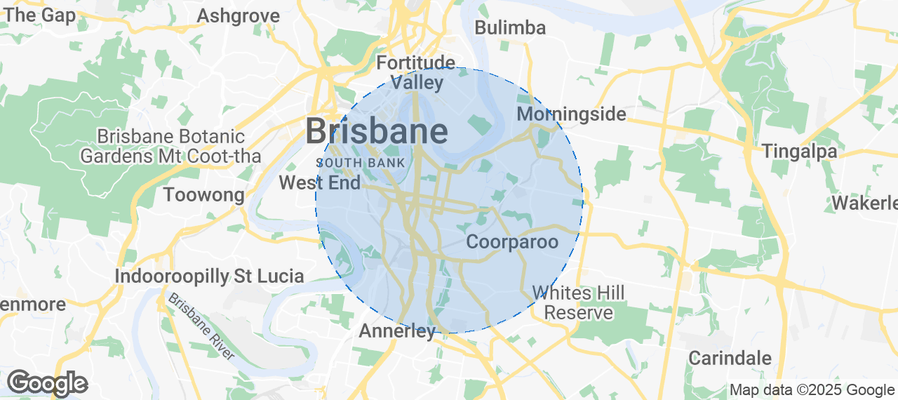
East Brisbane Airbnb Market Analysis 2026: Short Term Rental Data & Vacation Rental Statistics in Queensland, Australia
Is Airbnb profitable in East Brisbane in 2026? Explore comprehensive Airbnb analytics for East Brisbane, Queensland, Australia to uncover income potential. This 2026 STR market report for East Brisbane, based on AirROI data from February 2025 to January 2026, reveals key trends in the niche market of 23 active listings.
Whether you're considering an Airbnb investment in East Brisbane, optimizing your existing vacation rental, or exploring rental arbitrage opportunities, understanding the East Brisbane Airbnb data is crucial. Leveraging the low regulation environment is key to maximizing your short term rental income potential. Let's dive into the specifics.
Key East Brisbane Airbnb Performance Metrics Overview
Monthly Airbnb Revenue Variations & Income Potential in East Brisbane (2026)
Understanding the monthly revenue variations for Airbnb listings in East Brisbane is key to maximizing your short term rental income potential. Seasonality significantly impacts earnings. Our analysis, based on data from the past 12 months, shows that the peak revenue month for STRs in East Brisbane is typically December, while May often presents the lowest earnings, highlighting opportunities for strategic pricing adjustments during shoulder and low seasons. Explore the typical Airbnb income in East Brisbane across different performance tiers:
- Best-in-class properties (Top 10%) achieve $3,052+ monthly, often utilizing dynamic pricing and superior guest experiences.
- Strong performing properties (Top 25%) earn $1,357 or more, indicating effective management and desirable locations/amenities.
- Typical properties (Median) generate around $931 per month, representing the average market performance.
- Entry-level properties (Bottom 25%) see earnings around $518, often with potential for optimization.
Average Monthly Airbnb Earnings Trend in East Brisbane
East Brisbane Airbnb Occupancy Rate Trends (2026)
Maximize your bookings by understanding the East Brisbane STR occupancy trends. Seasonal demand shifts significantly influence how often properties are booked. Typically, Julysees the highest demand (peak season occupancy), while May experiences the lowest (low season). Effective strategies, like adjusting minimum stays or offering promotions, can boost occupancy during slower periods. Here's how different property tiers perform in East Brisbane:
- Best-in-class properties (Top 10%) achieve 66%+ occupancy, indicating high desirability and potentially optimized availability.
- Strong performing properties (Top 25%) maintain 52% or higher occupancy, suggesting good market fit and guest satisfaction.
- Typical properties (Median) have an occupancy rate around 35%.
- Entry-level properties (Bottom 25%) average 20% occupancy, potentially facing higher vacancy.
Average Monthly Occupancy Rate Trend in East Brisbane
Average Daily Rate (ADR) Airbnb Trends in East Brisbane (2026)
Effective short term rental pricing strategy in East Brisbane involves understanding monthly ADR fluctuations. The Average Daily Rate (ADR) for Airbnb in East Brisbane typically peaks in December and dips lowest during August. Leveraging Airbnb dynamic pricing tools or strategies based on this seasonality can significantly boost revenue. Here's a look at the typical nightly rates achieved:
- Best-in-class properties (Top 10%) command rates of $197+ per night, often due to premium features or locations.
- Strong performing properties (Top 25%) achieve nightly rates of $137 or more.
- Typical properties (Median) charge around $86 per night.
- Entry-level properties (Bottom 25%) earn around $67 per night.
Average Daily Rate (ADR) Trend by Month in East Brisbane
Get Live East Brisbane Market Intelligence 👇
Explore Real-time Analytics
Airbnb Seasonality Analysis & Trends in East Brisbane (2026)
Peak Season (December, July, June)
- Revenue averages $1,786 per month
- Occupancy rates average 48.6%
- Daily rates average $119
Shoulder Season
- Revenue averages $1,077 per month
- Occupancy maintains around 31.3%
- Daily rates hold near $123
Low Season (February, March, April)
- Revenue drops to average $0 per month
- Occupancy decreases to average 0.0%
- Daily rates adjust to average $101
Seasonality Insights for East Brisbane
- The Airbnb seasonality in East Brisbane shows highly seasonal trends requiring careful strategy. While the sections above show seasonal averages, it's also insightful to look at the extremes:
- During the high season, the absolute peak month showcases East Brisbane's highest earning potential, with monthly revenues capable of climbing to $1,930, occupancy reaching a high of 54.8%, and ADRs peaking at $157.
- Conversely, the slowest single month of the year, typically falling within the low season, marks the market's lowest point. In this month, revenue might dip to $0, occupancy could drop to 0.0%, and ADRs may adjust down to $94.
- Understanding both the seasonal averages and these monthly peaks and troughs in revenue, occupancy, and ADR is crucial for maximizing your Airbnb profit potential in East Brisbane.
Seasonal Strategies for Maximizing Profit
- Peak Season: Maximize revenue through premium pricing and potentially longer minimum stays. Ensure high availability.
- Low Season: Offer competitive pricing, special promotions (e.g., extended stay discounts), and flexible cancellation policies. Target off-season travelers like remote workers or budget-conscious guests.
- Shoulder Seasons: Implement dynamic pricing that balances peak and low rates. Target weekend travelers or specific events. Offer slightly more flexible terms than peak season.
- Regularly analyze your own performance against these East Brisbane seasonality benchmarks and adjust your pricing and availability strategy accordingly.
Best Areas for Airbnb Investment in East Brisbane (2026)
Exploring the top neighborhoods for short-term rentals in East Brisbane? This section highlights key areas, outlining why they are attractive for hosts and guests, along with notable local attractions. Consider these locations based on your target guest profile and investment strategy.
| Neighborhood / Area | Why Host Here? (Target Guests & Appeal) | Key Attractions & Landmarks |
|---|---|---|
| Morningside | Morningside is a vibrant suburb close to the Brisbane River, popular with families and young professionals due to its community feel and proximity to both the city and various parks. | Morningside Park, Hawthorne Park, Cannon Hill Plaza, Bulimba Riverside Park, Oxford Street in Bulimba |
| Woolloongabba | Known for the famous Gabba cricket ground, Woolloongabba is a mix of heritage charm and modern development, making it a popular choice for sports fans and city visitors. | The Gabba, St Edward's Catholic Church, Woolloongabba Antique Centre, Gabba Central, East Brisbane State School |
| Camp Hill | A family-friendly suburb with great schools, parks, and local shops, Camp Hill is becoming increasingly sought after for both residents and visitors. | Whites Hill Reserve, Camp Hill Marketplace, Camp Hill Bowls Club, St Thomas' Anglican Church |
| Greenslopes | Greenslopes offers a mix of suburban living with easy access to the CBD, making it an attractive area for both long-term residents and short-term visitors. | Greenslopes Mall, Greenslopes Private Hospital, Holland Park West, St Elizabeth's Primary School |
| Hawthorne | A leafy suburb right by the river, Hawthorne is a picturesque area popular for its cinematic attractions and ferry services to the city, perfect for tourists. | Hawthorne Cineplex, Hawthorne Ferry Terminal, Lytton Road shops, Hawthorne Park |
| Bulimba | With its trendy dining precinct along Oxford Street and proximity to the Brisbane River, Bulimba is a sought-after spot for visitors who enjoy both relaxation and entertainment. | Bulimba Ferry Terminal, Oxford Street dining and shopping, Bulimba Memorial Park, McCaskie Park |
| East Brisbane | Close to the city and offering a local community vibe, East Brisbane is ideal for visitors wanting to explore Brisbane while enjoying a neighborhood feel. | Wellington Point, East Brisbane State School, Morningside Park, Cannon Hill Plaza |
| Tarragindi | A quiet and leafy suburb that provides easy access to the city, Tarragindi is perfect for families and visitors looking for a peaceful stay close to urban amenities. | Tarragindi Recreation Reserve, Kedron Brook, Toohey Forest |
Understanding Airbnb License Requirements & STR Laws in East Brisbane (2026)
While East Brisbane, Queensland, Australia currently shows low STR regulations, specific Airbnb license requirements might still exist or change. Always verify the latest short term rental regulations and Airbnb license requirements directly with local government authorities for East Brisbane to ensure full compliance before hosting.
(Source: AirROI data, 2026, finding no licensed listings among those analyzed)
Top Performing Airbnb Properties in East Brisbane (2026)
Benchmark your potential! Explore examples of top-performing Airbnb properties in East Brisbanebased on Trailing Twelve Month (TTM) revenue. Analyze their characteristics, revenue, occupancy rate, and ADR to understand what drives success in this market.
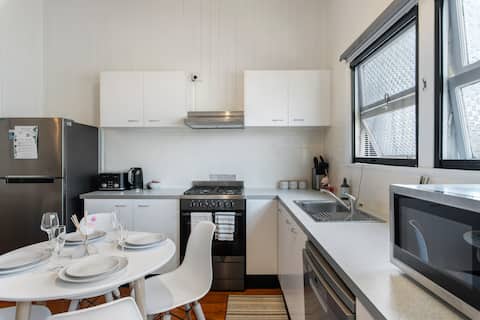
Free Car Park, Gym, Walk to Gabba, Central
Entire Place • 3 bedrooms

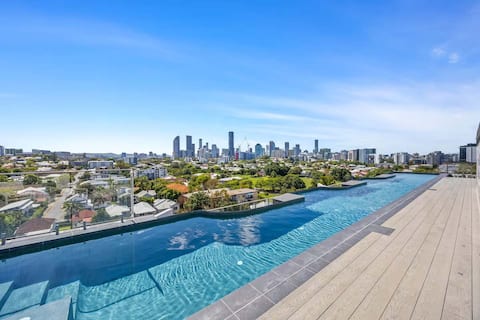
Skyline & Rooftop Pool | 2BR Modern Stay Near CBD
Entire Place • 2 bedrooms
Cricket Fans Choice | 2BR Walk to Gabba & Ferry
Entire Place • 2 bedrooms

Twin Room
Private Room • N/A

Queen Room
Private Room • N/A
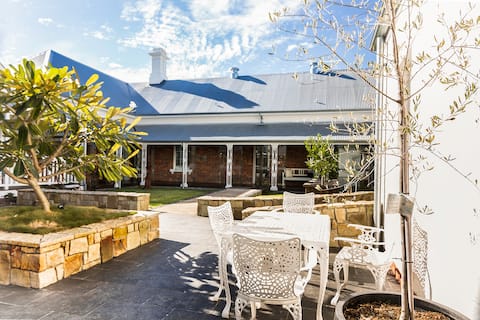
Historic Charm close to Brisbane City - best room
Private Room • N/A
Note: Performance varies based on location, size, amenities, seasonality, and management quality. Data reflects the past 12 months.
Top Performing Airbnb Hosts in East Brisbane (2026)
Learn from the best! This table showcases top-performing Airbnb hosts in East Brisbane based on the number of properties managed and estimated total revenue over the past year. Analyze their scale and performance metrics.
| Host Name | Properties | Grossing Revenue | Stay Reviews | Avg Rating |
|---|---|---|---|---|
| Jeffery | 11 | $87,984 | 230 | 4.53/5.0 |
| Nicki | 1 | $45,162 | 26 | 5.00/5.0 |
| Mauricio | 7 | $40,993 | 36 | 4.09/5.0 |
| Olivia | 1 | $30,032 | 25 | 4.60/5.0 |
| Mia Harris | 1 | $10,801 | 21 | 4.86/5.0 |
| Marisa | 1 | $10,536 | 14 | 5.00/5.0 |
| Billy | 1 | $8,059 | 1 | Not Rated |
Analyzing the strategies of top hosts, such as their property selection, pricing, and guest communication, can offer valuable lessons for optimizing your own Airbnb operations in East Brisbane.
Dive Deeper: Advanced East Brisbane STR Market Data (2026)
Ready to unlock more insights? AirROI provides access to advanced metrics and comprehensive Airbnb data for East Brisbane. Explore detailed analytics beyond this report to refine your investment strategy, optimize pricing, and maximize your vacation rental profits.
Explore Advanced MetricsEast Brisbane Short-Term Rental Market Composition (2026): Property & Room Types
Room Type Distribution
Property Type Distribution
Market Composition Insights for East Brisbane
- The East Brisbane Airbnb market composition is heavily skewed towards Private Room listings, which make up 82.6% of the 23 active rentals. This indicates strong guest preference for privacy and space.
- Looking at the property type distribution in East Brisbane, House properties are the most common (69.6%), reflecting the local real estate landscape.
- Houses represent a significant 69.6% portion, catering likely to families or larger groups.
- The presence of 21.7% Hotel/Boutique listings indicates integration with traditional hospitality.
East Brisbane Airbnb Room Capacity Analysis (2026): Bedroom Distribution
Distribution of Listings by Number of Bedrooms
Room Capacity Insights for East Brisbane
- The dominant room capacity in East Brisbane is 2 bedrooms listings, making up 17.4% of the market. This suggests a strong demand for properties suitable for couples or solo travelers.
- Together, 2 bedrooms and 3 bedrooms properties represent 21.7% of the active Airbnb listings in East Brisbane, indicating a high concentration in these sizes.
- Listings with 3+ bedrooms (4.3%) represent a smaller niche, potentially indicating an underserved market for larger group accommodations in East Brisbane.
East Brisbane Vacation Rental Guest Capacity Trends (2026)
Distribution of Listings by Guest Capacity
Guest Capacity Insights for East Brisbane
- The most common guest capacity trend in East Brisbane vacation rentals is listings accommodating 6 guests (8.7%). This suggests the primary traveler segment is likely larger groups.
- Properties designed for 6 guests and 4 guests dominate the East Brisbane STR market, accounting for 17.4% of listings.
- On average, properties in East Brisbane are equipped to host 0.9 guests.
East Brisbane Airbnb Booking Patterns (2026): Available vs. Booked Days
Available Days Distribution
Booked Days Distribution
Booking Pattern Insights for East Brisbane
- The most common availability pattern in East Brisbane falls within the 271-366 days range, representing 52.2% of listings. This suggests many properties have significant open periods on their calendars.
- Approximately 100.0% of listings show high availability (181+ days open annually), indicating potential for increased bookings or specific owner usage patterns.
- For booked days, the 91-180 days range is most frequent in East Brisbane (52.2%), reflecting common guest stay durations or potential owner blocking patterns.
East Brisbane Airbnb Minimum Stay Requirements Analysis
Distribution of Listings by Minimum Night Requirement
1 Night
18 listings
78.3% of total
2 Nights
1 listings
4.3% of total
7-29 Nights
1 listings
4.3% of total
30+ Nights
3 listings
13% of total
Key Insights
- The most prevalent minimum stay requirement in East Brisbane is 1 Night, adopted by 78.3% of listings. This highlights the market's preference for shorter, flexible bookings.
- A strong majority (82.6%) of the East Brisbane Airbnb data shows acceptance of very short stays (1-2 nights), indicating a dynamic, high-turnover market.
- A significant segment (13%) caters to monthly stays (30+ nights) in East Brisbane, pointing to opportunities in the extended-stay market.
Recommendations
- Align with the market by considering a 1 Night minimum stay, as 78.3% of East Brisbane hosts use this setting.
- Explore offering discounts for stays of 30+ nights to attract the 13% of the market seeking extended stays.
- Adjust minimum nights based on seasonality – potentially shorter during low season and longer during peak demand periods in East Brisbane.
East Brisbane Airbnb Cancellation Policy Trends Analysis (2026)
Flexible
18 listings
78.3% of total
Moderate
3 listings
13% of total
Firm
1 listings
4.3% of total
Strict
1 listings
4.3% of total
Cancellation Policy Insights for East Brisbane
- The prevailing Airbnb cancellation policy trend in East Brisbane is Flexible, used by 78.3% of listings.
- The market strongly favors guest-friendly terms, with 91.3% of listings offering Flexible or Moderate policies. This suggests guests in East Brisbane may expect booking flexibility.
- Strict cancellation policies are quite rare (4.3%), potentially making listings with this policy less competitive unless justified by high demand or property type.
Recommendations for Hosts
- Consider adopting a Flexible policy to align with the 78.3% market standard in East Brisbane.
- Given the high prevalence of Flexible policies (78.3%), offering this can enhance booking appeal, especially during shoulder seasons.
- Using a Strict policy might deter some guests, as only 4.3% of listings use it. Evaluate if potential revenue protection outweighs possible lower booking rates.
- Regularly review your cancellation policy against competitors and market demand shifts in East Brisbane.
East Brisbane STR Booking Lead Time Analysis (2026)
Average Booking Lead Time by Month
Booking Lead Time Insights for East Brisbane
- The overall average booking lead time for vacation rentals in East Brisbane is 24 days.
- Guests book furthest in advance for stays during December (average 51 days), likely coinciding with peak travel demand or local events.
- The shortest booking windows occur for stays in April (average 0 days), indicating more last-minute travel plans during this time.
- Seasonally, Winter (33 days avg.) sees the longest lead times, while Spring (0 days avg.) has the shortest, reflecting typical travel planning cycles.
Recommendations for Hosts
- Use the overall average lead time (24 days) as a baseline for your pricing and availability strategy in East Brisbane.
- For December stays, consider implementing length-of-stay discounts or slightly higher rates for bookings made less than 51 days out to capitalize on advance planning.
- During April, focus on last-minute booking availability and promotions, as guests book with very short notice (0 days avg.).
- Target marketing efforts for the Winter season well in advance (at least 33 days) to capture early planners.
- Monitor your own booking lead times against these East Brisbane averages to identify opportunities for dynamic pricing adjustments.
Popular & Essential Airbnb Amenities in East Brisbane (2026)
Amenity Prevalence
Amenity Insights for East Brisbane
- Essential amenities in East Brisbane that guests expect include: Kitchen. Lacking these (this) could significantly impact bookings.
- Popular amenities like Smoke alarm, Wifi, Washer are common but not universal. Offering these can provide a competitive edge.
- Warning: Wifi is not universally provided but is considered essential globally. Ensure reliable Wifi is offered.
Recommendations for Hosts
- Ensure your listing includes all essential amenities for East Brisbane: Kitchen.
- Prioritize adding missing essentials: Kitchen.
- Consider adding popular differentiators like Smoke alarm or Wifi to increase appeal.
- Highlight unique or less common amenities you offer (e.g., hot tub, dedicated workspace, EV charger) in your listing description and photos.
- Regularly check competitor amenities in East Brisbane to stay competitive.
East Brisbane Airbnb Guest Demographics & Profile Analysis (2026)
Guest Profile Summary for East Brisbane
- The typical guest profile for Airbnb in East Brisbane consists of a mix of domestic (50%) and international guests, with top international origins including United Kingdom, typically belonging to the Post-2000s (Gen Z/Alpha) group (50%), primarily speaking English or Spanish.
- Domestic travelers account for 49.7% of guests.
- Key international markets include Australia (49.7%) and United Kingdom (8.4%).
- Top languages spoken are English (49.6%) followed by Spanish (10.7%).
- A significant demographic segment is the Post-2000s (Gen Z/Alpha) group, representing 50% of guests.
Recommendations for Hosts
- Balance marketing efforts between domestic and international channels based on the guest mix.
- Tailor amenities and listing descriptions to appeal to the dominant Post-2000s (Gen Z/Alpha) demographic (e.g., highlight fast WiFi, smart home features, local guides).
- Highlight unique local experiences or amenities relevant to the primary guest profile.
- Consider seasonal promotions aligned with peak travel times for key origin markets.
Nearby Short-Term Rental Market Comparison
How does the East Brisbane Airbnb market stack up against its neighbors? Compare key performance metrics like average monthly revenue, ADR, and occupancy rates in surrounding areas to understand the broader regional STR landscape.
| Market | Active Properties | Monthly Revenue | Daily Rate | Avg. Occupancy |
|---|---|---|---|---|
| Castaways Beach | 19 | $5,252 | $496.71 | 48% |
| Fingal | 13 | $4,377 | $305.13 | 54% |
| Noosa Heads | 1,033 | $4,015 | $387.33 | 46% |
| Byron Bay | 997 | $3,963 | $424.38 | 42% |
| Byron Shire Council | 193 | $3,807 | $423.69 | 42% |
| Sunrise Beach | 105 | $3,763 | $348.50 | 47% |
| Burleigh Heads | 28 | $3,610 | $342.10 | 50% |
| Point Lookout | 10 | $3,561 | $511.53 | 31% |
| Ewingsdale | 53 | $3,534 | $571.35 | 40% |
| Marcus Beach | 21 | $3,482 | $370.16 | 45% |