Mooloolaba Airbnb Market Analysis 2026: Short Term Rental Data & Vacation Rental Statistics in Queensland, Australia
Is Airbnb profitable in Mooloolaba in 2026? Explore comprehensive Airbnb analytics for Mooloolaba, Queensland, Australia to uncover income potential. This 2026 STR market report for Mooloolaba, based on AirROI data from February 2025 to January 2026, reveals key trends in the niche market of 24 active listings.
Whether you're considering an Airbnb investment in Mooloolaba, optimizing your existing vacation rental, or exploring rental arbitrage opportunities, understanding the Mooloolaba Airbnb data is crucial. Leveraging the low regulation environment is key to maximizing your short term rental income potential. Let's dive into the specifics.
Key Mooloolaba Airbnb Performance Metrics Overview
Monthly Airbnb Revenue Variations & Income Potential in Mooloolaba (2026)
Understanding the monthly revenue variations for Airbnb listings in Mooloolaba is key to maximizing your short term rental income potential. Seasonality significantly impacts earnings. Our analysis, based on data from the past 12 months, shows that the peak revenue month for STRs in Mooloolaba is typically December, while May often presents the lowest earnings, highlighting opportunities for strategic pricing adjustments during shoulder and low seasons. Explore the typical Airbnb income in Mooloolaba across different performance tiers:
- Best-in-class properties (Top 10%) achieve $6,123+ monthly, often utilizing dynamic pricing and superior guest experiences.
- Strong performing properties (Top 25%) earn $4,272 or more, indicating effective management and desirable locations/amenities.
- Typical properties (Median) generate around $3,011 per month, representing the average market performance.
- Entry-level properties (Bottom 25%) see earnings around $1,806, often with potential for optimization.
Average Monthly Airbnb Earnings Trend in Mooloolaba
Mooloolaba Airbnb Occupancy Rate Trends (2026)
Maximize your bookings by understanding the Mooloolaba STR occupancy trends. Seasonal demand shifts significantly influence how often properties are booked. Typically, Julysees the highest demand (peak season occupancy), while May experiences the lowest (low season). Effective strategies, like adjusting minimum stays or offering promotions, can boost occupancy during slower periods. Here's how different property tiers perform in Mooloolaba:
- Best-in-class properties (Top 10%) achieve 75%+ occupancy, indicating high desirability and potentially optimized availability.
- Strong performing properties (Top 25%) maintain 65% or higher occupancy, suggesting good market fit and guest satisfaction.
- Typical properties (Median) have an occupancy rate around 41%.
- Entry-level properties (Bottom 25%) average 22% occupancy, potentially facing higher vacancy.
Average Monthly Occupancy Rate Trend in Mooloolaba
Average Daily Rate (ADR) Airbnb Trends in Mooloolaba (2026)
Effective short term rental pricing strategy in Mooloolaba involves understanding monthly ADR fluctuations. The Average Daily Rate (ADR) for Airbnb in Mooloolaba typically peaks in December and dips lowest during August. Leveraging Airbnb dynamic pricing tools or strategies based on this seasonality can significantly boost revenue. Here's a look at the typical nightly rates achieved:
- Best-in-class properties (Top 10%) command rates of $491+ per night, often due to premium features or locations.
- Strong performing properties (Top 25%) achieve nightly rates of $299 or more.
- Typical properties (Median) charge around $229 per night.
- Entry-level properties (Bottom 25%) earn around $177 per night.
Average Daily Rate (ADR) Trend by Month in Mooloolaba
Get Live Mooloolaba Market Intelligence 👇
Explore Real-time Analytics
Airbnb Seasonality Analysis & Trends in Mooloolaba (2026)
Peak Season (December, September, October)
- Revenue averages $4,536 per month
- Occupancy rates average 50.6%
- Daily rates average $311
Shoulder Season
- Revenue averages $2,916 per month
- Occupancy maintains around 40.0%
- Daily rates hold near $260
Low Season (February, March, April)
- Revenue drops to average $0 per month
- Occupancy decreases to average 0.0%
- Daily rates adjust to average $248
Seasonality Insights for Mooloolaba
- The Airbnb seasonality in Mooloolaba shows highly seasonal trends requiring careful strategy. While the sections above show seasonal averages, it's also insightful to look at the extremes:
- During the high season, the absolute peak month showcases Mooloolaba's highest earning potential, with monthly revenues capable of climbing to $4,839, occupancy reaching a high of 53.4%, and ADRs peaking at $328.
- Conversely, the slowest single month of the year, typically falling within the low season, marks the market's lowest point. In this month, revenue might dip to $0, occupancy could drop to 0.0%, and ADRs may adjust down to $219.
- Understanding both the seasonal averages and these monthly peaks and troughs in revenue, occupancy, and ADR is crucial for maximizing your Airbnb profit potential in Mooloolaba.
Seasonal Strategies for Maximizing Profit
- Peak Season: Maximize revenue through premium pricing and potentially longer minimum stays. Ensure high availability.
- Low Season: Offer competitive pricing, special promotions (e.g., extended stay discounts), and flexible cancellation policies. Target off-season travelers like remote workers or budget-conscious guests.
- Shoulder Seasons: Implement dynamic pricing that balances peak and low rates. Target weekend travelers or specific events. Offer slightly more flexible terms than peak season.
- Regularly analyze your own performance against these Mooloolaba seasonality benchmarks and adjust your pricing and availability strategy accordingly.
Best Areas for Airbnb Investment in Mooloolaba (2026)
Exploring the top neighborhoods for short-term rentals in Mooloolaba? This section highlights key areas, outlining why they are attractive for hosts and guests, along with notable local attractions. Consider these locations based on your target guest profile and investment strategy.
| Neighborhood / Area | Why Host Here? (Target Guests & Appeal) | Key Attractions & Landmarks |
|---|---|---|
| Mooloolaba Beach | Stunning and popular beach destination known for its beautiful sandy beaches and vibrant dining scene. It attracts a variety of tourists including families and couples looking for a relaxing beach getaway. | Mooloolaba Esplanade, Underwater World, Mooloolaba Beach, Mooloolaba Wharf, Surf Life Saving Club, Spit Beach |
| Alexandra Headland | Adjacent to Mooloolaba, this area boasts a laid-back atmosphere and excellent surf conditions. It's popular among surfers and beachgoers seeking a more relaxed vibe while still being close to Mooloolaba's attractions. | Alex Beach, Headland Park, Alexandra Headland Surf Club, Ocean Terrace, Mooloolaba Walking Path, Local cafes and shops |
| Golden Beach | A family-friendly beachfront area with a relaxed atmosphere, Golden Beach offers calmer waters and is great for families with children, making it an appealing option for family-friendly vacation rentals. | Golden Beach, Caloundra Jet Ski, Paddleboarding, Local playgrounds, Golden Beach Parade |
| Caloundra | Further south along the coast, Caloundra has a wide range of beaches with stunning views. It's a popular holiday destination that attracts families, couples, and retirees, providing ample investment opportunities. | Kings Beach, Bulcock Beach, Caloundra Main Street, Caloundra Lighthouses, Happy Valley |
| Noosa Heads | A little further up the coast, Noosa Heads is renowned for its national parks, stylish boutiques, and fine dining. It attracts a more upscale clientele and offers premium rental opportunities. | Noosa National Park, Hastings Street, Main Beach, Noosa River, Noosa Spit Reserve |
| Buddina | Less crowded compared to Mooloolaba, Buddina offers a more residential feel while still being close to the beach. A hidden gem for those seeking quieter accommodations without sacrificing access to attractions. | Buddina Beach, La Balsa Park, Point Cartwright, Kawana Shoppingworld |
| Maroochydore | As one of the Sunshine Coast's major hubs, Maroochydore has a mix of urban convenience with proximity to beaches. It's growing in popularity with travelers looking for a central location to explore the Sunshine Coast. | Maroochydore Beach, Sunshine Plaza, Cotton Tree Park, Maroochy River |
| Peregian Beach | A quieter alternative to Noosa, Peregian Beach features a beautiful beach and community vibe. It's ideal for those looking for a peaceful beach escape with a local charm. | Peregian Beach, Peregian Village, Peregian Springs, Local surf spots |
Understanding Airbnb License Requirements & STR Laws in Mooloolaba (2026)
While Mooloolaba, Queensland, Australia currently shows low STR regulations, specific Airbnb license requirements might still exist or change. Always verify the latest short term rental regulations and Airbnb license requirements directly with local government authorities for Mooloolaba to ensure full compliance before hosting.
(Source: AirROI data, 2026, finding no licensed listings among those analyzed)
Top Performing Airbnb Properties in Mooloolaba (2026)
Benchmark your potential! Explore examples of top-performing Airbnb properties in Mooloolababased on Trailing Twelve Month (TTM) revenue. Analyze their characteristics, revenue, occupancy rate, and ADR to understand what drives success in this market.
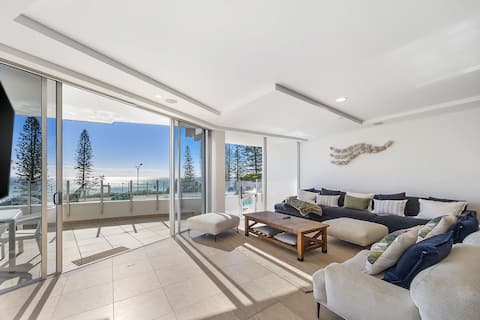
Oceans Apt 203- 5-Star Luxury Beachfront Escape
Entire Place • 3 bedrooms
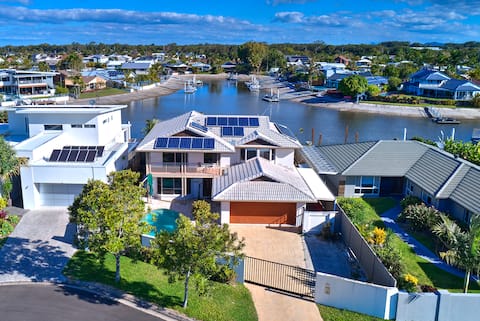
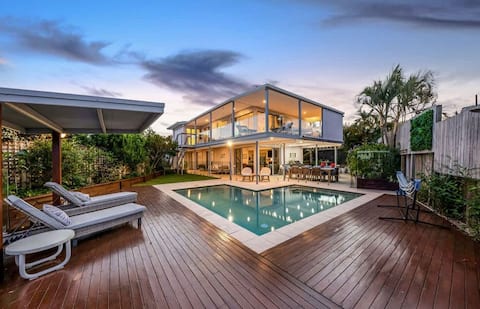
Large Waterfront Home With Pool
Entire Place • 4 bedrooms
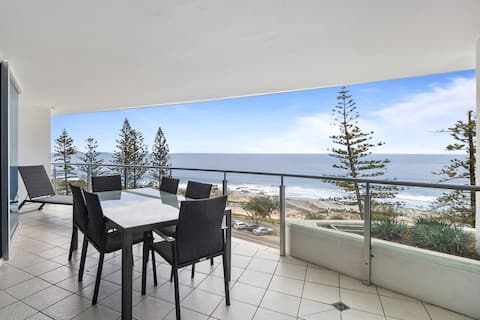
Sirocco 606 magnificent 2 bedroom apartment
Entire Place • 2 bedrooms
Luxury 5-Bedroom Canal-Front Retreat in Mooloolaba
Entire Place • 5 bedrooms

Lovely Waterfront Spacious Home
Entire Place • 4 bedrooms

Coastal Comfort | Walk to Beach, Cafés & Esplanade
Entire Place • 3 bedrooms
Note: Performance varies based on location, size, amenities, seasonality, and management quality. Data reflects the past 12 months.
Top Performing Airbnb Hosts in Mooloolaba (2026)
Learn from the best! This table showcases top-performing Airbnb hosts in Mooloolaba based on the number of properties managed and estimated total revenue over the past year. Analyze their scale and performance metrics.
| Host Name | Properties | Grossing Revenue | Stay Reviews | Avg Rating |
|---|---|---|---|---|
| SunnyBNB | 7 | $224,642 | 88 | 4.11/5.0 |
| Holiday Mooloolaba | 3 | $153,410 | 14 | 4.79/5.0 |
| G1 Holidays | 3 | $73,725 | 6 | 4.75/5.0 |
| Michelle | 2 | $70,279 | 58 | 4.63/5.0 |
| Dan | 1 | $37,866 | 31 | 4.58/5.0 |
| Hayley | 1 | $30,846 | 55 | 5.00/5.0 |
| Daisy | 1 | $30,745 | 23 | 4.70/5.0 |
| Mandy | 1 | $28,149 | 9 | 4.89/5.0 |
| Jorgan | 1 | $25,873 | 18 | 4.89/5.0 |
| Lisa | 1 | $23,663 | 23 | 4.83/5.0 |
Analyzing the strategies of top hosts, such as their property selection, pricing, and guest communication, can offer valuable lessons for optimizing your own Airbnb operations in Mooloolaba.
Dive Deeper: Advanced Mooloolaba STR Market Data (2026)
Ready to unlock more insights? AirROI provides access to advanced metrics and comprehensive Airbnb data for Mooloolaba. Explore detailed analytics beyond this report to refine your investment strategy, optimize pricing, and maximize your vacation rental profits.
Explore Advanced MetricsMooloolaba Short-Term Rental Market Composition (2026): Property & Room Types
Room Type Distribution
Property Type Distribution
Market Composition Insights for Mooloolaba
- The Mooloolaba Airbnb market composition is heavily skewed towards Entire Home/Apt listings, which make up 100% of the 24 active rentals. This indicates strong guest preference for privacy and space.
- Looking at the property type distribution in Mooloolaba, Apartment/Condo properties are the most common (66.7%), reflecting the local real estate landscape.
- Houses represent a significant 29.2% portion, catering likely to families or larger groups.
- Smaller segments like others (combined 4.2%) offer potential for unique stay experiences.
Mooloolaba Airbnb Room Capacity Analysis (2026): Bedroom Distribution
Distribution of Listings by Number of Bedrooms
Room Capacity Insights for Mooloolaba
- The dominant room capacity in Mooloolaba is 2 bedrooms listings, making up 50% of the market. This suggests a strong demand for properties suitable for couples or solo travelers.
- Together, 2 bedrooms and 3 bedrooms properties represent 79.2% of the active Airbnb listings in Mooloolaba, indicating a high concentration in these sizes.
- A significant 41.7% of listings offer 3+ bedrooms, catering to larger groups and families seeking more space in Mooloolaba.
Mooloolaba Vacation Rental Guest Capacity Trends (2026)
Distribution of Listings by Guest Capacity
Guest Capacity Insights for Mooloolaba
- The most common guest capacity trend in Mooloolaba vacation rentals is listings accommodating 4 guests (50%). This suggests the primary traveler segment is likely small families or groups.
- Properties designed for 4 guests and 6 guests dominate the Mooloolaba STR market, accounting for 70.8% of listings.
- 41.6% of properties accommodate 6+ guests, serving the market segment for larger families or group travel in Mooloolaba.
- On average, properties in Mooloolaba are equipped to host 5.2 guests.
Mooloolaba Airbnb Booking Patterns (2026): Available vs. Booked Days
Available Days Distribution
Booked Days Distribution
Booking Pattern Insights for Mooloolaba
- The most common availability pattern in Mooloolaba falls within the 181-270 days range, representing 54.2% of listings. This suggests many properties have significant open periods on their calendars.
- Approximately 87.5% of listings show high availability (181+ days open annually), indicating potential for increased bookings or specific owner usage patterns.
- For booked days, the 91-180 days range is most frequent in Mooloolaba (58.3%), reflecting common guest stay durations or potential owner blocking patterns.
- A notable 12.5% of properties secure long booking periods (181+ days booked per year), highlighting successful long-term rental strategies or significant owner usage.
Mooloolaba Airbnb Minimum Stay Requirements Analysis
Distribution of Listings by Minimum Night Requirement
1 Night
1 listings
4.2% of total
2 Nights
8 listings
33.3% of total
3 Nights
1 listings
4.2% of total
4-6 Nights
1 listings
4.2% of total
30+ Nights
13 listings
54.2% of total
Key Insights
- The most prevalent minimum stay requirement in Mooloolaba is 30+ Nights, adopted by 54.2% of listings. This highlights the market's preference for longer commitments.
- A significant segment (54.2%) caters to monthly stays (30+ nights) in Mooloolaba, pointing to opportunities in the extended-stay market.
Recommendations
- Align with the market by considering a 30+ Nights minimum stay, as 54.2% of Mooloolaba hosts use this setting.
- If feasible, allowing 1-night stays, especially midweek or during low season, could capture last-minute bookings, as only 4.2% currently do.
- A 2-night minimum appears standard (33.3%). Consider this for weekends or peak periods.
- Explore offering discounts for stays of 30+ nights to attract the 54.2% of the market seeking extended stays.
- Adjust minimum nights based on seasonality – potentially shorter during low season and longer during peak demand periods in Mooloolaba.
Mooloolaba Airbnb Cancellation Policy Trends Analysis (2026)
Super Strict 30 Days
6 listings
25% of total
Flexible
3 listings
12.5% of total
Moderate
3 listings
12.5% of total
Firm
11 listings
45.8% of total
Strict
1 listings
4.2% of total
Cancellation Policy Insights for Mooloolaba
- The prevailing Airbnb cancellation policy trend in Mooloolaba is Firm, used by 45.8% of listings.
- There's a relatively balanced mix between guest-friendly (25.0%) and stricter (50.0%) policies, offering choices for different guest needs.
- Strict cancellation policies are quite rare (4.2%), potentially making listings with this policy less competitive unless justified by high demand or property type.
Recommendations for Hosts
- Consider adopting a Firm policy to align with the 45.8% market standard in Mooloolaba.
- Using a Strict policy might deter some guests, as only 4.2% of listings use it. Evaluate if potential revenue protection outweighs possible lower booking rates.
- Regularly review your cancellation policy against competitors and market demand shifts in Mooloolaba.
Mooloolaba STR Booking Lead Time Analysis (2026)
Average Booking Lead Time by Month
Booking Lead Time Insights for Mooloolaba
- The overall average booking lead time for vacation rentals in Mooloolaba is 37 days.
- Guests book furthest in advance for stays during September (average 42 days), likely coinciding with peak travel demand or local events.
- The shortest booking windows occur for stays in April (average 0 days), indicating more last-minute travel plans during this time.
- Seasonally, Fall (36 days avg.) sees the longest lead times, while Spring (1 days avg.) has the shortest, reflecting typical travel planning cycles.
Recommendations for Hosts
- Use the overall average lead time (37 days) as a baseline for your pricing and availability strategy in Mooloolaba.
- During April, focus on last-minute booking availability and promotions, as guests book with very short notice (0 days avg.).
- Target marketing efforts for the Fall season well in advance (at least 36 days) to capture early planners.
- Monitor your own booking lead times against these Mooloolaba averages to identify opportunities for dynamic pricing adjustments.
Popular & Essential Airbnb Amenities in Mooloolaba (2026)
Amenity Prevalence
Amenity Insights for Mooloolaba
- Essential amenities in Mooloolaba that guests expect include: TV, Kitchen, Wifi, Washer, Microwave, Refrigerator, Stove, Bed linens. Lacking these (any) could significantly impact bookings.
- Popular amenities like Oven, Free parking on premises are common but not universal. Offering these can provide a competitive edge.
Recommendations for Hosts
- Ensure your listing includes all essential amenities for Mooloolaba: TV, Kitchen, Wifi, Washer, Microwave, Refrigerator, Stove, Bed linens.
- Prioritize adding missing essentials: Refrigerator, Stove, Bed linens.
- Consider adding popular differentiators like Oven or Free parking on premises to increase appeal.
- Highlight unique or less common amenities you offer (e.g., hot tub, dedicated workspace, EV charger) in your listing description and photos.
- Regularly check competitor amenities in Mooloolaba to stay competitive.
Mooloolaba Airbnb Guest Demographics & Profile Analysis (2026)
Guest Profile Summary for Mooloolaba
- The typical guest profile for Airbnb in Mooloolaba consists of primarily domestic travelers (82%), often arriving from nearby Brisbane, typically belonging to the Post-2000s (Gen Z/Alpha) group (50%), primarily speaking English or French.
- Domestic travelers account for 81.6% of guests.
- Key international markets include Australia (81.6%) and United Kingdom (5.5%).
- Top languages spoken are English (82.1%) followed by French (5.4%).
- A significant demographic segment is the Post-2000s (Gen Z/Alpha) group, representing 50% of guests.
Recommendations for Hosts
- Target domestic marketing efforts towards travelers from Brisbane and Queensland.
- Tailor amenities and listing descriptions to appeal to the dominant Post-2000s (Gen Z/Alpha) demographic (e.g., highlight fast WiFi, smart home features, local guides).
- Highlight unique local experiences or amenities relevant to the primary guest profile.
- Consider seasonal promotions aligned with peak travel times for key origin markets.
Nearby Short-Term Rental Market Comparison
How does the Mooloolaba Airbnb market stack up against its neighbors? Compare key performance metrics like average monthly revenue, ADR, and occupancy rates in surrounding areas to understand the broader regional STR landscape.
| Market | Active Properties | Monthly Revenue | Daily Rate | Avg. Occupancy |
|---|---|---|---|---|
| Castaways Beach | 19 | $5,252 | $496.71 | 48% |
| Kingfisher Bay | 29 | $4,434 | $337.82 | 46% |
| Happy Valley | 11 | $4,110 | $246.38 | 58% |
| Noosa Heads | 1,033 | $4,015 | $387.33 | 46% |
| Sunrise Beach | 105 | $3,763 | $348.50 | 47% |
| Point Lookout | 10 | $3,561 | $511.53 | 31% |
| Marcus Beach | 21 | $3,482 | $370.16 | 45% |
| Sunshine Beach | 286 | $3,431 | $413.46 | 40% |
| Scenic Rim Regional | 280 | $3,189 | $249.66 | 46% |
| Boonah | 15 | $3,043 | $173.00 | 60% |