River Heads Airbnb Market Analysis 2026: Short Term Rental Data & Vacation Rental Statistics in Queensland, Australia
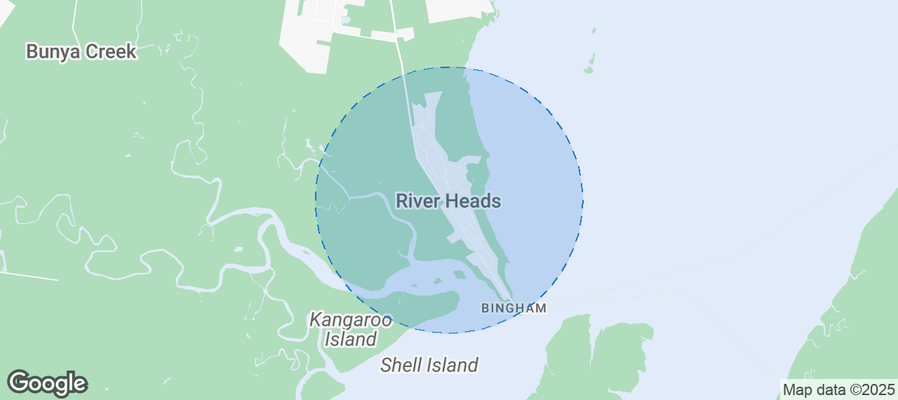
Is Airbnb profitable in River Heads in 2026? Explore comprehensive Airbnb analytics for River Heads, Queensland, Australia to uncover income potential. This 2026 STR market report for River Heads, based on AirROI data from May 2024 to April 2025, reveals key trends in the niche market of 16 active listings.
Whether you're considering an Airbnb investment in River Heads, optimizing your existing vacation rental, or exploring rental arbitrage opportunities, understanding the River Heads Airbnb data is crucial. Leveraging the low regulation environment is key to maximizing your short term rental income potential. Let's dive into the specifics.
Key River Heads Airbnb Performance Metrics Overview
Monthly Airbnb Revenue Variations & Income Potential in River Heads (2026)
Understanding the monthly revenue variations for Airbnb listings in River Heads is key to maximizing your short term rental income potential. Seasonality significantly impacts earnings. Our analysis, based on data from the past 12 months, shows that the peak revenue month for STRs in River Heads is typically December, while June often presents the lowest earnings, highlighting opportunities for strategic pricing adjustments during shoulder and low seasons. Explore the typical Airbnb income in River Heads across different performance tiers:
- Best-in-class properties (Top 10%) achieve $3,419+ monthly, often utilizing dynamic pricing and superior guest experiences.
- Strong performing properties (Top 25%) earn $2,178 or more, indicating effective management and desirable locations/amenities.
- Typical properties (Median) generate around $1,209 per month, representing the average market performance.
- Entry-level properties (Bottom 25%) see earnings around $663, often with potential for optimization.
Average Monthly Airbnb Earnings Trend in River Heads
River Heads Airbnb Occupancy Rate Trends (2026)
Maximize your bookings by understanding the River Heads STR occupancy trends. Seasonal demand shifts significantly influence how often properties are booked. Typically, Aprilsees the highest demand (peak season occupancy), while June experiences the lowest (low season). Effective strategies, like adjusting minimum stays or offering promotions, can boost occupancy during slower periods. Here's how different property tiers perform in River Heads:
- Best-in-class properties (Top 10%) achieve 79%+ occupancy, indicating high desirability and potentially optimized availability.
- Strong performing properties (Top 25%) maintain 65% or higher occupancy, suggesting good market fit and guest satisfaction.
- Typical properties (Median) have an occupancy rate around 41%.
- Entry-level properties (Bottom 25%) average 22% occupancy, potentially facing higher vacancy.
Average Monthly Occupancy Rate Trend in River Heads
Average Daily Rate (ADR) Airbnb Trends in River Heads (2026)
Effective short term rental pricing strategy in River Heads involves understanding monthly ADR fluctuations. The Average Daily Rate (ADR) for Airbnb in River Heads typically peaks in January and dips lowest during October. Leveraging Airbnb dynamic pricing tools or strategies based on this seasonality can significantly boost revenue. Here's a look at the typical nightly rates achieved:
- Best-in-class properties (Top 10%) command rates of $194+ per night, often due to premium features or locations.
- Strong performing properties (Top 25%) achieve nightly rates of $159 or more.
- Typical properties (Median) charge around $98 per night.
- Entry-level properties (Bottom 25%) earn around $72 per night.
Average Daily Rate (ADR) Trend by Month in River Heads
Get Live River Heads Market Intelligence 👇
Explore Real-time Analytics
Airbnb Seasonality Analysis & Trends in River Heads (2025)
Peak Season (December, October, September)
- Revenue averages $1,980 per month
- Occupancy rates average 49.8%
- Daily rates average $116
Shoulder Season
- Revenue averages $1,737 per month
- Occupancy maintains around 46.4%
- Daily rates hold near $119
Low Season (February, May, June)
- Revenue drops to average $1,224 per month
- Occupancy decreases to average 36.6%
- Daily rates adjust to average $115
Seasonality Insights for River Heads
- The Airbnb seasonality in River Heads shows moderate seasonality with distinct peak and low periods. While the sections above show seasonal averages, it's also insightful to look at the extremes:
- During the high season, the absolute peak month showcases River Heads's highest earning potential, with monthly revenues capable of climbing to $2,100, occupancy reaching a high of 55.8%, and ADRs peaking at $138.
- Conversely, the slowest single month of the year, typically falling within the low season, marks the market's lowest point. In this month, revenue might dip to $997, occupancy could drop to 32.7%, and ADRs may adjust down to $106.
- Understanding both the seasonal averages and these monthly peaks and troughs in revenue, occupancy, and ADR is crucial for maximizing your Airbnb profit potential in River Heads.
Seasonal Strategies for Maximizing Profit
- Peak Season: Maximize revenue through premium pricing and potentially longer minimum stays. Ensure high availability.
- Low Season: Offer competitive pricing, special promotions (e.g., extended stay discounts), and flexible cancellation policies. Target off-season travelers like remote workers or budget-conscious guests.
- Shoulder Seasons: Implement dynamic pricing that balances peak and low rates. Target weekend travelers or specific events. Offer slightly more flexible terms than peak season.
- Regularly analyze your own performance against these River Heads seasonality benchmarks and adjust your pricing and availability strategy accordingly.
Best Areas for Airbnb Investment in River Heads (2026)
Exploring the top neighborhoods for short-term rentals in River Heads? This section highlights key areas, outlining why they are attractive for hosts and guests, along with notable local attractions. Consider these locations based on your target guest profile and investment strategy.
| Neighborhood / Area | Why Host Here? (Target Guests & Appeal) | Key Attractions & Landmarks |
|---|---|---|
| River Heads Beach | Beautiful beach area known for its stunning views of the Fraser Coast and proximity to attractions like Fraser Island. Great for families and nature lovers looking for a relaxing getaway. | Fraser Island, Burrum Coast National Park, River Heads Jetty, Local cafes and shops, Scenic picnic spots, Bowen Park |
| Hervey Bay | Nearby coastal city famous for whale watching and eco-tourism. Offers a variety of accommodation options and is very popular among tourists looking for marine life experiences. | Whale Watching Tours, Hervey Bay Botanic Gardens, Urangan Pier, Fraser Coast Discovery Sphere, Wide Bay Beach |
| Maryborough | Historic town known for its heritage buildings and rich history. Attracts tourists interested in culture and history, along with other travellers seeking unique experiences. | Mary Poppins Statue, Heritage Markets, Maryborough Military and Colonial Museum, Queens Park, Customs House |
| Burrum Heads | Charming seaside village with a laid-back atmosphere. Popular for fishing and relaxation, attracting visitors who prefer a quieter beach experience. | Burrum Heads Beach, Burrum River, Fishing spots, Local markets, Picnic areas |
| Point Vernon | Quiet beachside suburb with long sandy beaches and family-friendly atmosphere. Great for visitors wanting to enjoy nature walks and beach activities. | Point Vernon Beach, Walking tracks, Picnic areas, Local shops, Nearby parks |
| Pialba | Commercial hub of Hervey Bay with shops, dining options, and easy access to the beach. Ideal for those looking for convenience and entertainment. | Stockland Hervey Bay, Pialba Beach, Hervey Bay RSL, Local restaurants, Water sports activities |
| Torquay | Residential suburb and popular beach destination, known for its surf beaches and family-friendly environment. Ideal for holidaymakers and beach lovers. | Torquay Beach, Surf Life Saving Club, Scenic walking paths, Beachfront cafes, Water activities |
| Kawungan | Suburban area with easy access to the beach and shopping facilities. Great for families and long-stay guests looking for comfort and convenience. | local parks, shopping centres, beach access, family-friendly activities, scenic outlooks |
Understanding Airbnb License Requirements & STR Laws in River Heads (2026)
While River Heads, Queensland, Australia currently shows low STR regulations, specific Airbnb license requirements might still exist or change. Always verify the latest short term rental regulations and Airbnb license requirements directly with local government authorities for River Heads to ensure full compliance before hosting.
(Source: AirROI data, 2026, finding no licensed listings among those analyzed)
Top Performing Airbnb Properties in River Heads (2026)
Benchmark your potential! Explore examples of top-performing Airbnb properties in River Headsbased on Trailing Twelve Month (TTM) revenue. Analyze their characteristics, revenue, occupancy rate, and ADR to understand what drives success in this market.
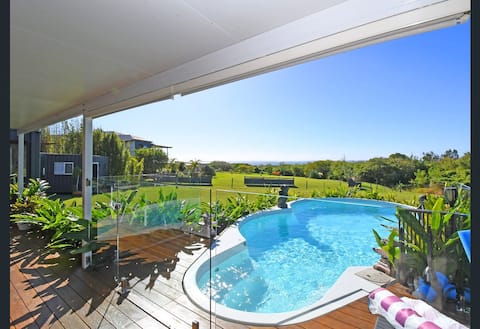
Seaside, Pool, Pet Friendly, Fishing, Boat Shed
Entire Place • 2 bedrooms
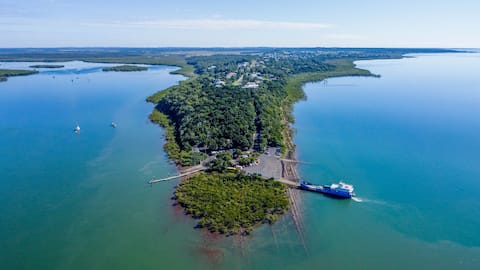
River House II- Waterfront - River Heads
Entire Place • 2 bedrooms
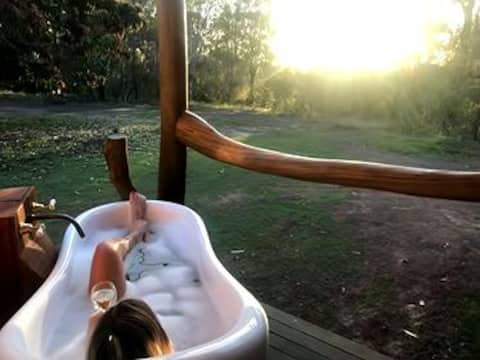
Mango Lodge a Romantic Cabin in River Heads
Entire Place • 1 bedroom
"Vista de la Luna"
Entire Place • 1 bedroom

Hervey Bay. Fraser Island River Heads Pet Friendly
Entire Place • 3 bedrooms
Ocean Outlook Family Escape
Entire Place • 4 bedrooms
Note: Performance varies based on location, size, amenities, seasonality, and management quality. Data reflects the past 12 months.
Top Performing Airbnb Hosts in River Heads (2026)
Learn from the best! This table showcases top-performing Airbnb hosts in River Heads based on the number of properties managed and estimated total revenue over the past year. Analyze their scale and performance metrics.
| Host Name | Properties | Grossing Revenue | Stay Reviews | Avg Rating |
|---|---|---|---|---|
| Suzanne | 3 | $51,103 | 162 | 4.82/5.0 |
| Joanne | 1 | $38,911 | 6 | 4.83/5.0 |
| Boz & Simon | 1 | $34,421 | 50 | 5.00/5.0 |
| Deb | 1 | $19,485 | 23 | 4.96/5.0 |
| David | 1 | $17,854 | 303 | 4.84/5.0 |
| Host #183804956 | 1 | $17,179 | 5 | 5.00/5.0 |
| Danielle | 1 | $14,388 | 7 | 5.00/5.0 |
| Nicolette | 1 | $11,168 | 16 | 4.94/5.0 |
| Amber | 1 | $10,024 | 3 | 5.00/5.0 |
| Ashton | 1 | $7,065 | 20 | 4.85/5.0 |
Analyzing the strategies of top hosts, such as their property selection, pricing, and guest communication, can offer valuable lessons for optimizing your own Airbnb operations in River Heads.
Dive Deeper: Advanced River Heads STR Market Data (2026)
Ready to unlock more insights? AirROI provides access to advanced metrics and comprehensive Airbnb data for River Heads. Explore detailed analytics beyond this report to refine your investment strategy, optimize pricing, and maximize your vacation rental profits.
Explore Advanced MetricsRiver Heads Short-Term Rental Market Composition (2026): Property & Room Types
Room Type Distribution
Property Type Distribution
Market Composition Insights for River Heads
- The River Heads Airbnb market composition is heavily skewed towards Entire Home/Apt listings, which make up 87.5% of the 16 active rentals. This indicates strong guest preference for privacy and space.
- Looking at the property type distribution in River Heads, House properties are the most common (50%), reflecting the local real estate landscape.
- Houses represent a significant 50% portion, catering likely to families or larger groups.
- The presence of 12.5% Hotel/Boutique listings indicates integration with traditional hospitality.
River Heads Airbnb Room Capacity Analysis (2026): Bedroom Distribution
Distribution of Listings by Number of Bedrooms
Room Capacity Insights for River Heads
- The dominant room capacity in River Heads is 1 bedroom listings, making up 50% of the market. This suggests a strong demand for properties suitable for couples or solo travelers.
- Together, 1 bedroom and 3 bedrooms properties represent 75.0% of the active Airbnb listings in River Heads, indicating a high concentration in these sizes.
- A significant 31.3% of listings offer 3+ bedrooms, catering to larger groups and families seeking more space in River Heads.
River Heads Vacation Rental Guest Capacity Trends (2026)
Distribution of Listings by Guest Capacity
Guest Capacity Insights for River Heads
- The most common guest capacity trend in River Heads vacation rentals is listings accommodating 2 guests (37.5%). This suggests the primary traveler segment is likely couples or solo travelers.
- Properties designed for 2 guests and 6 guests dominate the River Heads STR market, accounting for 56.3% of listings.
- 31.3% of properties accommodate 6+ guests, serving the market segment for larger families or group travel in River Heads.
- On average, properties in River Heads are equipped to host 3.8 guests.
River Heads Airbnb Booking Patterns (2026): Available vs. Booked Days
Available Days Distribution
Booked Days Distribution
Booking Pattern Insights for River Heads
- The most common availability pattern in River Heads falls within the 271-366 days range, representing 50% of listings. This suggests many properties have significant open periods on their calendars.
- Approximately 68.8% of listings show high availability (181+ days open annually), indicating potential for increased bookings or specific owner usage patterns.
- For booked days, the 31-90 days range is most frequent in River Heads (37.5%), reflecting common guest stay durations or potential owner blocking patterns.
- A notable 31.3% of properties secure long booking periods (181+ days booked per year), highlighting successful long-term rental strategies or significant owner usage.
River Heads Airbnb Minimum Stay Requirements Analysis
Distribution of Listings by Minimum Night Requirement
1 Night
7 listings
46.7% of total
2 Nights
2 listings
13.3% of total
3 Nights
2 listings
13.3% of total
30+ Nights
4 listings
26.7% of total
Key Insights
- The most prevalent minimum stay requirement in River Heads is 1 Night, adopted by 46.7% of listings. This highlights the market's preference for shorter, flexible bookings.
- A significant segment (26.7%) caters to monthly stays (30+ nights) in River Heads, pointing to opportunities in the extended-stay market.
Recommendations
- Align with the market by considering a 1 Night minimum stay, as 46.7% of River Heads hosts use this setting.
- Explore offering discounts for stays of 30+ nights to attract the 26.7% of the market seeking extended stays.
- Adjust minimum nights based on seasonality – potentially shorter during low season and longer during peak demand periods in River Heads.
River Heads Airbnb Cancellation Policy Trends Analysis (2026)
Flexible
7 listings
50% of total
Moderate
2 listings
14.3% of total
Firm
5 listings
35.7% of total
Cancellation Policy Insights for River Heads
- The prevailing Airbnb cancellation policy trend in River Heads is Flexible, used by 50% of listings.
- There's a relatively balanced mix between guest-friendly (64.3%) and stricter (35.7%) policies, offering choices for different guest needs.
Recommendations for Hosts
- Consider adopting a Flexible policy to align with the 50% market standard in River Heads.
- Regularly review your cancellation policy against competitors and market demand shifts in River Heads.
River Heads STR Booking Lead Time Analysis (2026)
Average Booking Lead Time by Month
Booking Lead Time Insights for River Heads
- The overall average booking lead time for vacation rentals in River Heads is 53 days.
- Guests book furthest in advance for stays during May (average 118 days), likely coinciding with peak travel demand or local events.
- The shortest booking windows occur for stays in August (average 22 days), indicating more last-minute travel plans during this time.
- Seasonally, Spring (66 days avg.) sees the longest lead times, while Winter (50 days avg.) has the shortest, reflecting typical travel planning cycles.
Recommendations for Hosts
- Use the overall average lead time (53 days) as a baseline for your pricing and availability strategy in River Heads.
- For May stays, consider implementing length-of-stay discounts or slightly higher rates for bookings made less than 118 days out to capitalize on advance planning.
- Target marketing efforts for the Spring season well in advance (at least 66 days) to capture early planners.
- Monitor your own booking lead times against these River Heads averages to identify opportunities for dynamic pricing adjustments.
Popular & Essential Airbnb Amenities in River Heads (2026)
Amenity Prevalence
Amenity Insights for River Heads
- Essential amenities in River Heads that guests expect include: Air conditioning, Free parking on premises. Lacking these (any) could significantly impact bookings.
- Popular amenities like Smoke alarm, Kitchen, Heating are common but not universal. Offering these can provide a competitive edge.
Recommendations for Hosts
- Ensure your listing includes all essential amenities for River Heads: Air conditioning, Free parking on premises.
- Consider adding popular differentiators like Smoke alarm or Kitchen to increase appeal.
- Highlight unique or less common amenities you offer (e.g., hot tub, dedicated workspace, EV charger) in your listing description and photos.
- Regularly check competitor amenities in River Heads to stay competitive.
River Heads Airbnb Guest Demographics & Profile Analysis (2026)
Guest Profile Summary for River Heads
- The typical guest profile for Airbnb in River Heads consists of primarily domestic travelers (76%), often arriving from nearby Brisbane, typically belonging to the Post-2000s (Gen Z/Alpha) group (50%), primarily speaking English or German.
- Domestic travelers account for 75.6% of guests.
- Key international markets include Australia (75.6%) and United Kingdom (6.7%).
- Top languages spoken are English (62.3%) followed by German (10.3%).
- A significant demographic segment is the Post-2000s (Gen Z/Alpha) group, representing 50% of guests.
Recommendations for Hosts
- Target domestic marketing efforts towards travelers from Brisbane and England.
- Tailor amenities and listing descriptions to appeal to the dominant Post-2000s (Gen Z/Alpha) demographic (e.g., highlight fast WiFi, smart home features, local guides).
- Highlight unique local experiences or amenities relevant to the primary guest profile.
- Consider seasonal promotions aligned with peak travel times for key origin markets.
Nearby Short-Term Rental Market Comparison
How does the River Heads Airbnb market stack up against its neighbors? Compare key performance metrics like average monthly revenue, ADR, and occupancy rates in surrounding areas to understand the broader regional STR landscape.
| Market | Active Properties | Monthly Revenue | Daily Rate | Avg. Occupancy |
|---|---|---|---|---|
| Castaways Beach | 18 | $5,718 | $498.91 | 50% |
| Kingfisher Bay | 29 | $4,102 | $344.58 | 42% |
| Noosa Heads | 980 | $4,011 | $382.71 | 48% |
| Happy Valley | 10 | $3,530 | $224.60 | 57% |
| Sunrise Beach | 111 | $3,441 | $367.05 | 47% |
| Sunshine Beach | 291 | $3,298 | $403.44 | 42% |
| Marcus Beach | 23 | $2,951 | $446.90 | 42% |
| Seventeen Seventy | 29 | $2,873 | $270.42 | 43% |
| Orchid Beach | 15 | $2,775 | $220.00 | 47% |
| Eurong | 24 | $2,758 | $221.86 | 52% |