Wonga Beach Airbnb Market Analysis 2026: Short Term Rental Data & Vacation Rental Statistics in Queensland, Australia
Is Airbnb profitable in Wonga Beach in 2026? Explore comprehensive Airbnb analytics for Wonga Beach, Queensland, Australia to uncover income potential. This 2026 STR market report for Wonga Beach, based on AirROI data from July 2024 to June 2025, reveals key trends in the niche market of 18 active listings.
Whether you're considering an Airbnb investment in Wonga Beach, optimizing your existing vacation rental, or exploring rental arbitrage opportunities, understanding the Wonga Beach Airbnb data is crucial. Leveraging the low regulation environment is key to maximizing your short term rental income potential. Let's dive into the specifics.
Key Wonga Beach Airbnb Performance Metrics Overview
Monthly Airbnb Revenue Variations & Income Potential in Wonga Beach (2026)
Understanding the monthly revenue variations for Airbnb listings in Wonga Beach is key to maximizing your short term rental income potential. Seasonality significantly impacts earnings. Our analysis, based on data from the past 12 months, shows that the peak revenue month for STRs in Wonga Beach is typically July, while February often presents the lowest earnings, highlighting opportunities for strategic pricing adjustments during shoulder and low seasons. Explore the typical Airbnb income in Wonga Beach across different performance tiers:
- Best-in-class properties (Top 10%) achieve $4,612+ monthly, often utilizing dynamic pricing and superior guest experiences.
- Strong performing properties (Top 25%) earn $2,538 or more, indicating effective management and desirable locations/amenities.
- Typical properties (Median) generate around $1,406 per month, representing the average market performance.
- Entry-level properties (Bottom 25%) see earnings around $914, often with potential for optimization.
Average Monthly Airbnb Earnings Trend in Wonga Beach
Wonga Beach Airbnb Occupancy Rate Trends (2026)
Maximize your bookings by understanding the Wonga Beach STR occupancy trends. Seasonal demand shifts significantly influence how often properties are booked. Typically, Julysees the highest demand (peak season occupancy), while February experiences the lowest (low season). Effective strategies, like adjusting minimum stays or offering promotions, can boost occupancy during slower periods. Here's how different property tiers perform in Wonga Beach:
- Best-in-class properties (Top 10%) achieve 64%+ occupancy, indicating high desirability and potentially optimized availability.
- Strong performing properties (Top 25%) maintain 43% or higher occupancy, suggesting good market fit and guest satisfaction.
- Typical properties (Median) have an occupancy rate around 30%.
- Entry-level properties (Bottom 25%) average 18% occupancy, potentially facing higher vacancy.
Average Monthly Occupancy Rate Trend in Wonga Beach
Average Daily Rate (ADR) Airbnb Trends in Wonga Beach (2026)
Effective short term rental pricing strategy in Wonga Beach involves understanding monthly ADR fluctuations. The Average Daily Rate (ADR) for Airbnb in Wonga Beach typically peaks in June and dips lowest during March. Leveraging Airbnb dynamic pricing tools or strategies based on this seasonality can significantly boost revenue. Here's a look at the typical nightly rates achieved:
- Best-in-class properties (Top 10%) command rates of $340+ per night, often due to premium features or locations.
- Strong performing properties (Top 25%) achieve nightly rates of $275 or more.
- Typical properties (Median) charge around $175 per night.
- Entry-level properties (Bottom 25%) earn around $125 per night.
Average Daily Rate (ADR) Trend by Month in Wonga Beach
Get Live Wonga Beach Market Intelligence 👇

Explore Real-time Analytics
Airbnb Seasonality Analysis & Trends in Wonga Beach (2025)
Peak Season (July, August, September)
- Revenue averages $3,418 per month
- Occupancy rates average 54.6%
- Daily rates average $205
Shoulder Season
- Revenue averages $1,781 per month
- Occupancy maintains around 29.1%
- Daily rates hold near $202
Low Season (February, March, May)
- Revenue drops to average $1,130 per month
- Occupancy decreases to average 22.3%
- Daily rates adjust to average $191
Seasonality Insights for Wonga Beach
- The Airbnb seasonality in Wonga Beach shows highly seasonal trends requiring careful strategy. While the sections above show seasonal averages, it's also insightful to look at the extremes:
- During the high season, the absolute peak month showcases Wonga Beach's highest earning potential, with monthly revenues capable of climbing to $4,005, occupancy reaching a high of 61.1%, and ADRs peaking at $207.
- Conversely, the slowest single month of the year, typically falling within the low season, marks the market's lowest point. In this month, revenue might dip to $961, occupancy could drop to 19.9%, and ADRs may adjust down to $189.
- Understanding both the seasonal averages and these monthly peaks and troughs in revenue, occupancy, and ADR is crucial for maximizing your Airbnb profit potential in Wonga Beach.
Seasonal Strategies for Maximizing Profit
- Peak Season: Maximize revenue through premium pricing and potentially longer minimum stays. Ensure high availability.
- Low Season: Offer competitive pricing, special promotions (e.g., extended stay discounts), and flexible cancellation policies. Target off-season travelers like remote workers or budget-conscious guests.
- Shoulder Seasons: Implement dynamic pricing that balances peak and low rates. Target weekend travelers or specific events. Offer slightly more flexible terms than peak season.
- Regularly analyze your own performance against these Wonga Beach seasonality benchmarks and adjust your pricing and availability strategy accordingly.
Best Areas for Airbnb Investment in Wonga Beach (2026)
Exploring the top neighborhoods for short-term rentals in Wonga Beach? This section highlights key areas, outlining why they are attractive for hosts and guests, along with notable local attractions. Consider these locations based on your target guest profile and investment strategy.
| Neighborhood / Area | Why Host Here? (Target Guests & Appeal) | Key Attractions & Landmarks |
|---|---|---|
| Wonga Beach | A serene coastal area known for its stunning beaches and natural beauty. Ideal for those seeking a peaceful getaway or nature adventure, attracting tourists looking for relaxation and outdoor activities. | Wonga Beach, Mossman Gorge, Daintree Rainforest, Port Douglas shops, Four Mile Beach, Reef Cruises |
| Port Douglas | A vibrant tourist town that serves as a gateway to the Great Barrier Reef. Known for its upscale dining, boutiques, and proximity to natural wonders, perfect for attracting tourists looking for luxury and adventure. | Great Barrier Reef, Daintree Rainforest, Macrossan Street, Four Mile Beach, Wildlife Habitat |
| Daintree Rainforest | One of the oldest rainforests in the world, offering eco-tourism opportunities. Ideal for nature lovers and those looking to immerse themselves in biodiversity, attracting adventure and nature enthusiasts. | Daintree Discovery Centre, Cape Tribulation, Mossman Gorge, River Cruises, Wildlife Tours |
| Mossman | A charming town close to the Daintree Rainforest, known for its beautiful landscapes and local culture. Attracts tourists who are interested in exploring local history and nature. | Mossman Gorge, Mossman Markets, Riverwalk, Mossman Historical Society |
| Bloomfield | A laid-back village near the Bloomfield River and lush rainforests. It offers a unique immersive experience into the beauty of Queensland's nature, appealing to eco-tourists and fishing enthusiasts. | Bloomfield River, Nearby beaches, Eco tours, Fishing spots |
| Cape Tribulation | Famous for its stunning beaches and surrounding rainforests, where the reef meets the rainforest. Attracts eco-tourists and adventure seekers looking for unique outdoor experiences. | Cape Tribulation Beach, Daintree National Park, Beach walks, Kayaking, Snorkelling |
| Cooya Beach | Known for its tranquil atmosphere and beautiful coastal views. A great spot for families and holiday-makers looking for a peaceful retreat away from the hustle and bustle of city life. | Cooya Beach, Fishing spots, Local markets |
| Newell Beach | A beautiful yet quiet beach town that offers a relaxing atmosphere and close proximity to the Great Barrier Reef and local attractions, perfect for laid-back vacationers. | Newell Beach, Fishing spots, Rainforest walks, Local cafes |
Understanding Airbnb License Requirements & STR Laws in Wonga Beach (2026)
While Wonga Beach, Queensland, Australia currently shows low STR regulations, specific Airbnb license requirements might still exist or change. Always verify the latest short term rental regulations and Airbnb license requirements directly with local government authorities for Wonga Beach to ensure full compliance before hosting.
(Source: AirROI data, 2026, finding no licensed listings among those analyzed)
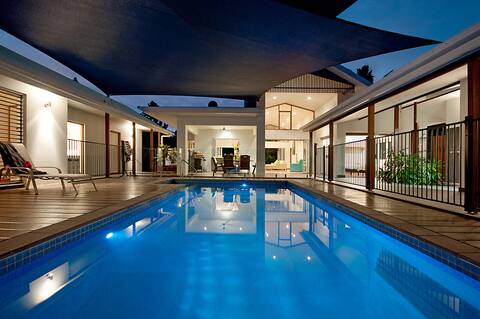
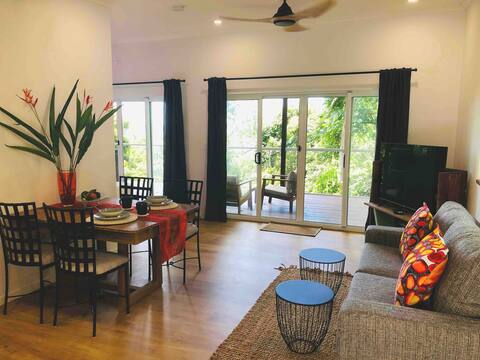
Top Performing Airbnb Properties in Wonga Beach (2026)
Benchmark your potential! Explore examples of top-performing Airbnb properties in Wonga Beachbased on Trailing Twelve Month (TTM) revenue. Analyze their characteristics, revenue, occupancy rate, and ADR to understand what drives success in this market.

Absolute Beachfront WongaBelle- Pet Friendly
Entire Place • 4 bedrooms

Private & secluded holiday home with stunning view
Entire Place • 3 bedrooms
Great Barrier Reef Beach House
Entire Place • 4 bedrooms
Sky at Gunnadoo: rainforest, ocean with jacuzzi
Entire Place • 1 bedroom

Gunnadoo Holiday Hut with Ocean Views and Jacuzzi
Entire Place • 1 bedroom

Artists' Beach Front - remote beach paradise
Entire Place • 5 bedrooms
Note: Performance varies based on location, size, amenities, seasonality, and management quality. Data reflects the past 12 months.
Top Performing Airbnb Hosts in Wonga Beach (2026)
Learn from the best! This table showcases top-performing Airbnb hosts in Wonga Beach based on the number of properties managed and estimated total revenue over the past year. Analyze their scale and performance metrics.
| Host Name | Properties | Grossing Revenue | Stay Reviews | Avg Rating |
|---|---|---|---|---|
| Marcus | 1 | $57,401 | 33 | 4.85/5.0 |
| Gigi & Andrea | 2 | $48,258 | 242 | 4.93/5.0 |
| Katherine | 1 | $46,043 | 47 | 4.91/5.0 |
| Wendy | 1 | $33,889 | 16 | 4.50/5.0 |
| Jule | 2 | $32,200 | 152 | 4.83/5.0 |
| Tina | 1 | $18,610 | 39 | 4.87/5.0 |
| William | 1 | $16,060 | 74 | 4.80/5.0 |
| Ada | 1 | $13,948 | 16 | 4.88/5.0 |
| Madelaine | 1 | $9,170 | 126 | 4.88/5.0 |
| Thomas | 1 | $7,927 | 6 | 4.83/5.0 |
Analyzing the strategies of top hosts, such as their property selection, pricing, and guest communication, can offer valuable lessons for optimizing your own Airbnb operations in Wonga Beach.
Dive Deeper: Advanced Wonga Beach STR Market Data (2026)
Ready to unlock more insights? AirROI provides access to advanced metrics and comprehensive Airbnb data for Wonga Beach. Explore detailed analytics beyond this report to refine your investment strategy, optimize pricing, and maximize your vacation rental profits.
Explore Advanced MetricsWonga Beach Short-Term Rental Market Composition (2026): Property & Room Types
Room Type Distribution
Property Type Distribution
Market Composition Insights for Wonga Beach
- The Wonga Beach Airbnb market composition is heavily skewed towards Entire Home/Apt listings, which make up 94.4% of the 18 active rentals. This indicates strong guest preference for privacy and space.
- Looking at the property type distribution in Wonga Beach, House properties are the most common (77.8%), reflecting the local real estate landscape.
- Houses represent a significant 77.8% portion, catering likely to families or larger groups.
- The presence of 5.6% Hotel/Boutique listings indicates integration with traditional hospitality.
Wonga Beach Airbnb Room Capacity Analysis (2026): Bedroom Distribution
Distribution of Listings by Number of Bedrooms
Room Capacity Insights for Wonga Beach
- The dominant room capacity in Wonga Beach is 1 bedroom listings, making up 38.9% of the market. This suggests a strong demand for properties suitable for couples or solo travelers.
- Together, 1 bedroom and 4 bedrooms properties represent 66.7% of the active Airbnb listings in Wonga Beach, indicating a high concentration in these sizes.
- A significant 50.1% of listings offer 3+ bedrooms, catering to larger groups and families seeking more space in Wonga Beach.
Wonga Beach Vacation Rental Guest Capacity Trends (2026)
Distribution of Listings by Guest Capacity
Guest Capacity Insights for Wonga Beach
- The most common guest capacity trend in Wonga Beach vacation rentals is listings accommodating 8+ guests (44.4%). This suggests the primary traveler segment is likely larger groups.
- Properties designed for 8+ guests and 2 guests dominate the Wonga Beach STR market, accounting for 72.2% of listings.
- 50.0% of properties accommodate 6+ guests, serving the market segment for larger families or group travel in Wonga Beach.
- On average, properties in Wonga Beach are equipped to host 5.0 guests.
Wonga Beach Airbnb Booking Patterns (2026): Available vs. Booked Days
Available Days Distribution
Booked Days Distribution
Booking Pattern Insights for Wonga Beach
- The most common availability pattern in Wonga Beach falls within the 271-366 days range, representing 61.1% of listings. This suggests many properties have significant open periods on their calendars.
- Approximately 100.0% of listings show high availability (181+ days open annually), indicating potential for increased bookings or specific owner usage patterns.
- For booked days, the 31-90 days range is most frequent in Wonga Beach (44.4%), reflecting common guest stay durations or potential owner blocking patterns.
Wonga Beach Airbnb Minimum Stay Requirements Analysis
Distribution of Listings by Minimum Night Requirement
1 Night
3 listings
16.7% of total
2 Nights
3 listings
16.7% of total
3 Nights
7 listings
38.9% of total
4-6 Nights
3 listings
16.7% of total
30+ Nights
2 listings
11.1% of total
Key Insights
- The most prevalent minimum stay requirement in Wonga Beach is 3 Nights, adopted by 38.9% of listings. This highlights the market's preference for longer commitments.
- A significant segment (11.1%) caters to monthly stays (30+ nights) in Wonga Beach, pointing to opportunities in the extended-stay market.
Recommendations
- Align with the market by considering a 3 Nights minimum stay, as 38.9% of Wonga Beach hosts use this setting.
- If feasible, allowing 1-night stays, especially midweek or during low season, could capture last-minute bookings, as only 16.7% currently do.
- Explore offering discounts for stays of 30+ nights to attract the 11.1% of the market seeking extended stays.
- Adjust minimum nights based on seasonality – potentially shorter during low season and longer during peak demand periods in Wonga Beach.
Wonga Beach Airbnb Cancellation Policy Trends Analysis (2026)
Flexible
6 listings
33.3% of total
Moderate
1 listings
5.6% of total
Firm
3 listings
16.7% of total
Strict
8 listings
44.4% of total
Cancellation Policy Insights for Wonga Beach
- The prevailing Airbnb cancellation policy trend in Wonga Beach is Strict, used by 44.4% of listings.
- A majority (61.1%) of hosts in Wonga Beach utilize Firm or Strict policies, indicating a market where hosts prioritize booking security.
Recommendations for Hosts
- Consider adopting a Strict policy to align with the 44.4% market standard in Wonga Beach.
- With 44.4% using Strict terms, this is a viable option in Wonga Beach, particularly for high-value properties or during peak demand periods.
- Regularly review your cancellation policy against competitors and market demand shifts in Wonga Beach.
Wonga Beach STR Booking Lead Time Analysis (2026)
Average Booking Lead Time by Month
Booking Lead Time Insights for Wonga Beach
- The overall average booking lead time for vacation rentals in Wonga Beach is 48 days.
- Guests book furthest in advance for stays during October (average 72 days), likely coinciding with peak travel demand or local events.
- The shortest booking windows occur for stays in February (average 8 days), indicating more last-minute travel plans during this time.
- Seasonally, Fall (57 days avg.) sees the longest lead times, while Winter (41 days avg.) has the shortest, reflecting typical travel planning cycles.
Recommendations for Hosts
- Use the overall average lead time (48 days) as a baseline for your pricing and availability strategy in Wonga Beach.
- For October stays, consider implementing length-of-stay discounts or slightly higher rates for bookings made less than 72 days out to capitalize on advance planning.
- During February, focus on last-minute booking availability and promotions, as guests book with very short notice (8 days avg.).
- Target marketing efforts for the Fall season well in advance (at least 57 days) to capture early planners.
- Monitor your own booking lead times against these Wonga Beach averages to identify opportunities for dynamic pricing adjustments.
Popular & Essential Airbnb Amenities in Wonga Beach (2026)
Amenity data is currently unavailable for Wonga Beach.
Wonga Beach Airbnb Guest Demographics & Profile Analysis (2026)
Guest Profile Summary for Wonga Beach
- The typical guest profile for Airbnb in Wonga Beach consists of primarily domestic travelers (66%), often arriving from nearby Sydney, typically belonging to the Post-2000s (Gen Z/Alpha) group (50%), primarily speaking English or French.
- Domestic travelers account for 65.5% of guests.
- Key international markets include Australia (65.5%) and United States (16.4%).
- Top languages spoken are English (64.1%) followed by French (10.3%).
- A significant demographic segment is the Post-2000s (Gen Z/Alpha) group, representing 50% of guests.
Recommendations for Hosts
- Target domestic marketing efforts towards travelers from Sydney and Cairns.
- Tailor amenities and listing descriptions to appeal to the dominant Post-2000s (Gen Z/Alpha) demographic (e.g., highlight fast WiFi, smart home features, local guides).
- Highlight unique local experiences or amenities relevant to the primary guest profile.
- Consider seasonal promotions aligned with peak travel times for key origin markets.
Nearby Short-Term Rental Market Comparison
How does the Wonga Beach Airbnb market stack up against its neighbors? Compare key performance metrics like average monthly revenue, ADR, and occupancy rates in surrounding areas to understand the broader regional STR landscape.
| Market | Active Properties | Monthly Revenue | Daily Rate | Avg. Occupancy |
|---|---|---|---|---|
| Kewarra Beach | 23 | $3,342 | $429.64 | 45% |
| Cairns Regional | 797 | $3,224 | $293.85 | 46% |
| Port Douglas | 632 | $2,974 | $338.06 | 41% |
| Douglas Shire | 156 | $2,744 | $290.30 | 43% |
| Mossman | 10 | $2,564 | $214.32 | 44% |
| Mission Beach | 52 | $2,530 | $283.72 | 41% |
| Tablelands Regional | 50 | $2,518 | $231.49 | 46% |
| Cairns | 992 | $2,296 | $173.41 | 55% |
| South Mission Beach | 36 | $2,216 | $244.52 | 36% |
| Yungaburra | 52 | $2,179 | $208.15 | 41% |