Woolloongabba Airbnb Market Analysis 2026: Short Term Rental Data & Vacation Rental Statistics in Queensland, Australia
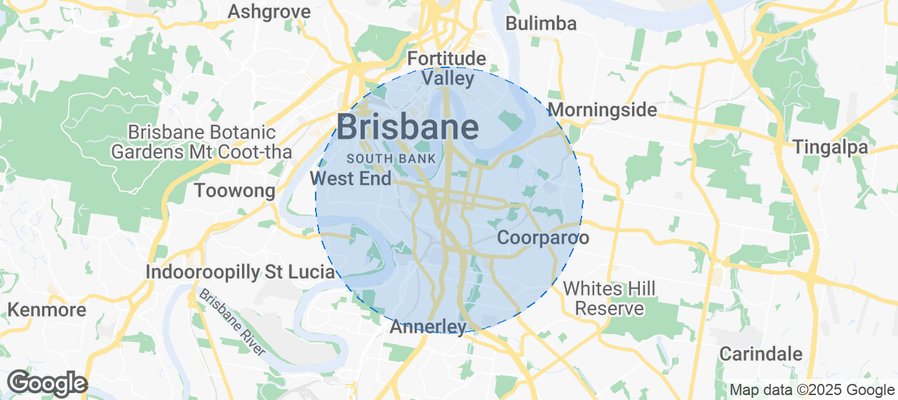
Is Airbnb profitable in Woolloongabba in 2026? Explore comprehensive Airbnb analytics for Woolloongabba, Queensland, Australia to uncover income potential. This 2026 STR market report for Woolloongabba, based on AirROI data from February 2025 to January 2026, reveals key trends in the niche market of 21 active listings.
Whether you're considering an Airbnb investment in Woolloongabba, optimizing your existing vacation rental, or exploring rental arbitrage opportunities, understanding the Woolloongabba Airbnb data is crucial. Leveraging the low regulation environment is key to maximizing your short term rental income potential. Let's dive into the specifics.
Key Woolloongabba Airbnb Performance Metrics Overview
Monthly Airbnb Revenue Variations & Income Potential in Woolloongabba (2026)
Understanding the monthly revenue variations for Airbnb listings in Woolloongabba is key to maximizing your short term rental income potential. Seasonality significantly impacts earnings. Our analysis, based on data from the past 12 months, shows that the peak revenue month for STRs in Woolloongabba is typically December, while May often presents the lowest earnings, highlighting opportunities for strategic pricing adjustments during shoulder and low seasons. Explore the typical Airbnb income in Woolloongabba across different performance tiers:
- Best-in-class properties (Top 10%) achieve $3,617+ monthly, often utilizing dynamic pricing and superior guest experiences.
- Strong performing properties (Top 25%) earn $2,097 or more, indicating effective management and desirable locations/amenities.
- Typical properties (Median) generate around $865 per month, representing the average market performance.
- Entry-level properties (Bottom 25%) see earnings around $506, often with potential for optimization.
Average Monthly Airbnb Earnings Trend in Woolloongabba
Woolloongabba Airbnb Occupancy Rate Trends (2026)
Maximize your bookings by understanding the Woolloongabba STR occupancy trends. Seasonal demand shifts significantly influence how often properties are booked. Typically, Julysees the highest demand (peak season occupancy), while May experiences the lowest (low season). Effective strategies, like adjusting minimum stays or offering promotions, can boost occupancy during slower periods. Here's how different property tiers perform in Woolloongabba:
- Best-in-class properties (Top 10%) achieve 67%+ occupancy, indicating high desirability and potentially optimized availability.
- Strong performing properties (Top 25%) maintain 48% or higher occupancy, suggesting good market fit and guest satisfaction.
- Typical properties (Median) have an occupancy rate around 28%.
- Entry-level properties (Bottom 25%) average 14% occupancy, potentially facing higher vacancy.
Average Monthly Occupancy Rate Trend in Woolloongabba
Average Daily Rate (ADR) Airbnb Trends in Woolloongabba (2026)
Effective short term rental pricing strategy in Woolloongabba involves understanding monthly ADR fluctuations. The Average Daily Rate (ADR) for Airbnb in Woolloongabba typically peaks in December and dips lowest during August. Leveraging Airbnb dynamic pricing tools or strategies based on this seasonality can significantly boost revenue. Here's a look at the typical nightly rates achieved:
- Best-in-class properties (Top 10%) command rates of $209+ per night, often due to premium features or locations.
- Strong performing properties (Top 25%) achieve nightly rates of $174 or more.
- Typical properties (Median) charge around $135 per night.
- Entry-level properties (Bottom 25%) earn around $81 per night.
Average Daily Rate (ADR) Trend by Month in Woolloongabba
Get Live Woolloongabba Market Intelligence 👇
Explore Real-time Analytics
Airbnb Seasonality Analysis & Trends in Woolloongabba (2026)
Peak Season (December, July, August)
- Revenue averages $1,977 per month
- Occupancy rates average 46.8%
- Daily rates average $133
Shoulder Season
- Revenue averages $1,282 per month
- Occupancy maintains around 27.5%
- Daily rates hold near $141
Low Season (February, March, April)
- Revenue drops to average $0 per month
- Occupancy decreases to average 0.0%
- Daily rates adjust to average $129
Seasonality Insights for Woolloongabba
- The Airbnb seasonality in Woolloongabba shows highly seasonal trends requiring careful strategy. While the sections above show seasonal averages, it's also insightful to look at the extremes:
- During the high season, the absolute peak month showcases Woolloongabba's highest earning potential, with monthly revenues capable of climbing to $2,323, occupancy reaching a high of 50.5%, and ADRs peaking at $169.
- Conversely, the slowest single month of the year, typically falling within the low season, marks the market's lowest point. In this month, revenue might dip to $0, occupancy could drop to 0.0%, and ADRs may adjust down to $113.
- Understanding both the seasonal averages and these monthly peaks and troughs in revenue, occupancy, and ADR is crucial for maximizing your Airbnb profit potential in Woolloongabba.
Seasonal Strategies for Maximizing Profit
- Peak Season: Maximize revenue through premium pricing and potentially longer minimum stays. Ensure high availability.
- Low Season: Offer competitive pricing, special promotions (e.g., extended stay discounts), and flexible cancellation policies. Target off-season travelers like remote workers or budget-conscious guests.
- Shoulder Seasons: Implement dynamic pricing that balances peak and low rates. Target weekend travelers or specific events. Offer slightly more flexible terms than peak season.
- Regularly analyze your own performance against these Woolloongabba seasonality benchmarks and adjust your pricing and availability strategy accordingly.
Best Areas for Airbnb Investment in Woolloongabba (2026)
Exploring the top neighborhoods for short-term rentals in Woolloongabba? This section highlights key areas, outlining why they are attractive for hosts and guests, along with notable local attractions. Consider these locations based on your target guest profile and investment strategy.
| Neighborhood / Area | Why Host Here? (Target Guests & Appeal) | Key Attractions & Landmarks |
|---|---|---|
| Woolloongabba Central | Woolloongabba Central is a vibrant area known for its mix of free-spirited culture and historical charm. It is close to the Gabba cricket ground, making it perfect for sports fans, and is well-connected to public transport. | The Gabba, Woolloongabba Antique Centre, Cleveland Street, The Brisbane Cricket Ground, J.J. Holland Park, Shops and cafes |
| Stanley Street | Stanley Street is famous for its diverse range of restaurants and cafes, attracting food enthusiasts and night owls. It serves as a lively hub for locals and tourists alike, making it a great spot for short-term rentals. | Buranda Village, The Buranda Railway Station, South Brisbane, Lang Park, CityCat ferry stops, Parks and cafes |
| Gabba Arts Precinct | The Gabba Arts Precinct is an area undergoing revitalization, with new developments bringing in creative spaces and art galleries, attracting a trendy crowd and tourists seeking unique experiences. | Art galleries, The Brisbane Powerhouse, Cultural events, Live music venues, Local artisan markets, Herston Quarter |
| Ipswich Road | Ipswich Road is a major thoroughfare offering easy access to the Brisbane CBD as well as a variety of shops and nightlife options perfect for those who want to be close to the action. | Local cafes, Brisbane CBD, Shopping centers, Public transport access, Nearby parks, Bars and clubs |
| Woolloongabba Market | The Woolloongabba Market is a popular open-air market that features everything from food stalls to arts and crafts, attracting both locals and tourists looking for unique products and experiences. | Woolloongabba Antique Centre, Food stalls, Local crafts, Weekend markets, Community events, Live music |
| Carlisle Street | This quieter residential street is just a short walk from more bustling areas, making it an attractive location for families and visitors looking for a more home-like stay with easy access to city attractions. | Local parks, Family-friendly cafes, Shops, Close to public transport, Quiet neighborhood, Easy access to downtown |
| GabbaGreen | GabbaGreen is a new green precinct focused on sustainability and community living. It appeals to eco-conscious travelers and those looking for a peaceful escape while still being near city life. | Public parks, Walking trails, Sustainable stores, Community events, Yoga and wellness centers, Outdoor cafes |
| Woolloongabba Diner District | The Diner District is well-known for its array of diners and eateries, catering to a variety of tastes, making it a hotspot for food lovers and social gatherings, perfect for vacationers. | Local diners, Food festivals, Outdoor seating areas, Nightlife, Live music venues, Street art |
Understanding Airbnb License Requirements & STR Laws in Woolloongabba (2026)
While Woolloongabba, Queensland, Australia currently shows low STR regulations, specific Airbnb license requirements might still exist or change. Always verify the latest short term rental regulations and Airbnb license requirements directly with local government authorities for Woolloongabba to ensure full compliance before hosting.
(Source: AirROI data, 2026, finding no licensed listings among those analyzed)
Top Performing Airbnb Properties in Woolloongabba (2026)
Benchmark your potential! Explore examples of top-performing Airbnb properties in Woolloongabbabased on Trailing Twelve Month (TTM) revenue. Analyze their characteristics, revenue, occupancy rate, and ADR to understand what drives success in this market.
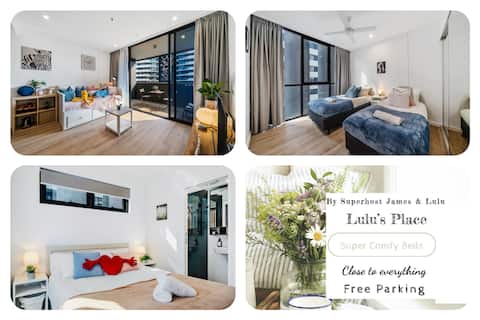
Lulu's Place, Super Comfy Beds! Close to Shops!
Entire Place • 2 bedrooms
Stylish Escape Near The Gabba
Entire Place • 2 bedrooms

Relax. Repeat – Spacious 4BR in the Gabba
Entire Place • 4 bedrooms
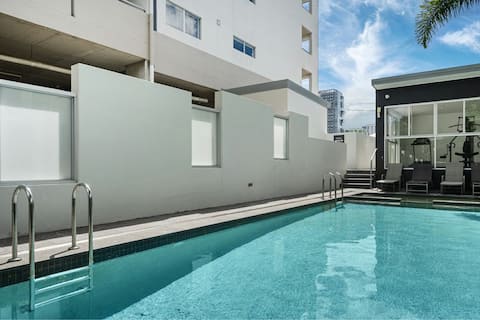
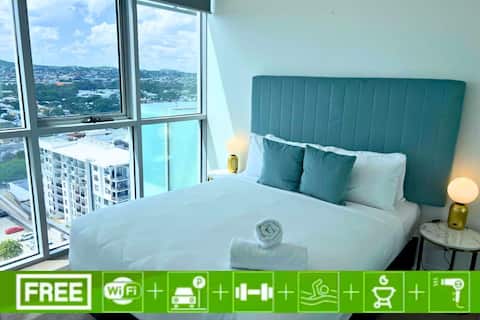
Stylish 1-Bed Apartment | Balcony, Pool & Gym
Entire Place • 1 bedroom
Gabba's Lookout, Comfy Beds, Pool Spa & Sauna
Entire Place • 2 bedrooms

Modern Comfort with Gabba Views & Great Amenities
Entire Place • 2 bedrooms
Note: Performance varies based on location, size, amenities, seasonality, and management quality. Data reflects the past 12 months.
Top Performing Airbnb Hosts in Woolloongabba (2026)
Learn from the best! This table showcases top-performing Airbnb hosts in Woolloongabba based on the number of properties managed and estimated total revenue over the past year. Analyze their scale and performance metrics.
| Host Name | Properties | Grossing Revenue | Stay Reviews | Avg Rating |
|---|---|---|---|---|
| Shang | 8 | $75,927 | 102 | 4.72/5.0 |
| James | 1 | $38,509 | 69 | 4.96/5.0 |
| Mauricio | 7 | $23,993 | 35 | 3.88/5.0 |
| Kay | 1 | $13,101 | 1 | Not Rated |
| Daisy | 2 | $11,941 | 7 | 4.67/5.0 |
| Idaly | 2 | $5,686 | 7 | 5.00/5.0 |
Analyzing the strategies of top hosts, such as their property selection, pricing, and guest communication, can offer valuable lessons for optimizing your own Airbnb operations in Woolloongabba.
Dive Deeper: Advanced Woolloongabba STR Market Data (2026)
Ready to unlock more insights? AirROI provides access to advanced metrics and comprehensive Airbnb data for Woolloongabba. Explore detailed analytics beyond this report to refine your investment strategy, optimize pricing, and maximize your vacation rental profits.
Explore Advanced MetricsWoolloongabba Short-Term Rental Market Composition (2026): Property & Room Types
Room Type Distribution
Property Type Distribution
Market Composition Insights for Woolloongabba
- The Woolloongabba Airbnb market composition is heavily skewed towards Entire Home/Apt listings, which make up 57.1% of the 21 active rentals. This indicates strong guest preference for privacy and space.
- However, a notable 42.9% share for Private Rooms suggests opportunities for budget-conscious travelers or hosts renting out spare rooms.
- Looking at the property type distribution in Woolloongabba, Apartment/Condo properties are the most common (57.1%), reflecting the local real estate landscape.
- The presence of 33.3% Hotel/Boutique listings indicates integration with traditional hospitality.
Woolloongabba Airbnb Room Capacity Analysis (2026): Bedroom Distribution
Distribution of Listings by Number of Bedrooms
Room Capacity Insights for Woolloongabba
- The dominant room capacity in Woolloongabba is 2 bedrooms listings, making up 38.1% of the market. This suggests a strong demand for properties suitable for couples or solo travelers.
- Together, 2 bedrooms and 1 bedroom properties represent 47.6% of the active Airbnb listings in Woolloongabba, indicating a high concentration in these sizes.
- Listings with 3+ bedrooms (9.6%) represent a smaller niche, potentially indicating an underserved market for larger group accommodations in Woolloongabba.
Woolloongabba Vacation Rental Guest Capacity Trends (2026)
Distribution of Listings by Guest Capacity
Guest Capacity Insights for Woolloongabba
- The most common guest capacity trend in Woolloongabba vacation rentals is listings accommodating 4 guests (33.3%). This suggests the primary traveler segment is likely small families or groups.
- Properties designed for 4 guests and 5 guests dominate the Woolloongabba STR market, accounting for 42.8% of listings.
- Listings for large groups (6+ guests) are relatively rare (4.8%), potentially indicating an opportunity for hosts targeting this segment in Woolloongabba.
- On average, properties in Woolloongabba are equipped to host 2.4 guests.
Woolloongabba Airbnb Booking Patterns (2026): Available vs. Booked Days
Available Days Distribution
Booked Days Distribution
Booking Pattern Insights for Woolloongabba
- The most common availability pattern in Woolloongabba falls within the 271-366 days range, representing 90.5% of listings. This suggests many properties have significant open periods on their calendars.
- Approximately 95.3% of listings show high availability (181+ days open annually), indicating potential for increased bookings or specific owner usage patterns.
- For booked days, the 31-90 days range is most frequent in Woolloongabba (66.7%), reflecting common guest stay durations or potential owner blocking patterns.
- A notable 4.8% of properties secure long booking periods (181+ days booked per year), highlighting successful long-term rental strategies or significant owner usage.
Woolloongabba Airbnb Minimum Stay Requirements Analysis
Distribution of Listings by Minimum Night Requirement
1 Night
8 listings
38.1% of total
2 Nights
10 listings
47.6% of total
7-29 Nights
1 listings
4.8% of total
30+ Nights
2 listings
9.5% of total
Key Insights
- The most prevalent minimum stay requirement in Woolloongabba is 2 Nights, adopted by 47.6% of listings. This highlights the market's preference for shorter, flexible bookings.
- A strong majority (85.7%) of the Woolloongabba Airbnb data shows acceptance of very short stays (1-2 nights), indicating a dynamic, high-turnover market.
Recommendations
- Align with the market by considering a 2 Nights minimum stay, as 47.6% of Woolloongabba hosts use this setting.
- Explore offering discounts for stays of 30+ nights to attract the 9.5% of the market seeking extended stays.
- Adjust minimum nights based on seasonality – potentially shorter during low season and longer during peak demand periods in Woolloongabba.
Woolloongabba Airbnb Cancellation Policy Trends Analysis (2026)
Flexible
10 listings
47.6% of total
Moderate
9 listings
42.9% of total
Firm
2 listings
9.5% of total
Cancellation Policy Insights for Woolloongabba
- The prevailing Airbnb cancellation policy trend in Woolloongabba is Flexible, used by 47.6% of listings.
- The market strongly favors guest-friendly terms, with 90.5% of listings offering Flexible or Moderate policies. This suggests guests in Woolloongabba may expect booking flexibility.
Recommendations for Hosts
- Consider adopting a Flexible policy to align with the 47.6% market standard in Woolloongabba.
- Regularly review your cancellation policy against competitors and market demand shifts in Woolloongabba.
Woolloongabba STR Booking Lead Time Analysis (2026)
Average Booking Lead Time by Month
Booking Lead Time Insights for Woolloongabba
- The overall average booking lead time for vacation rentals in Woolloongabba is 22 days.
- Guests book furthest in advance for stays during January (average 58 days), likely coinciding with peak travel demand or local events.
- The shortest booking windows occur for stays in April (average 0 days), indicating more last-minute travel plans during this time.
- Seasonally, Winter (26 days avg.) sees the longest lead times, while Spring (0 days avg.) has the shortest, reflecting typical travel planning cycles.
Recommendations for Hosts
- Use the overall average lead time (22 days) as a baseline for your pricing and availability strategy in Woolloongabba.
- For January stays, consider implementing length-of-stay discounts or slightly higher rates for bookings made less than 58 days out to capitalize on advance planning.
- During April, focus on last-minute booking availability and promotions, as guests book with very short notice (0 days avg.).
- Target marketing efforts for the Winter season well in advance (at least 26 days) to capture early planners.
- Monitor your own booking lead times against these Woolloongabba averages to identify opportunities for dynamic pricing adjustments.
Popular & Essential Airbnb Amenities in Woolloongabba (2026)
Amenity Prevalence
Amenity Insights for Woolloongabba
- Essential amenities in Woolloongabba that guests expect include: Wifi, Kitchen. Lacking these (any) could significantly impact bookings.
- Popular amenities like Cooking basics, Smoke alarm, Washer are common but not universal. Offering these can provide a competitive edge.
Recommendations for Hosts
- Ensure your listing includes all essential amenities for Woolloongabba: Wifi, Kitchen.
- Prioritize adding missing essentials: Kitchen.
- Consider adding popular differentiators like Cooking basics or Smoke alarm to increase appeal.
- Highlight unique or less common amenities you offer (e.g., hot tub, dedicated workspace, EV charger) in your listing description and photos.
- Regularly check competitor amenities in Woolloongabba to stay competitive.
Woolloongabba Airbnb Guest Demographics & Profile Analysis (2026)
Guest Profile Summary for Woolloongabba
- The typical guest profile for Airbnb in Woolloongabba consists of primarily domestic travelers (71%), often arriving from nearby Adelaide, typically belonging to the Post-2000s (Gen Z/Alpha) group (50%), primarily speaking English or Chinese.
- Domestic travelers account for 71.4% of guests.
- Key international markets include Australia (71.4%) and New Zealand (4.8%).
- Top languages spoken are English (55.6%) followed by Chinese (9.3%).
- A significant demographic segment is the Post-2000s (Gen Z/Alpha) group, representing 50% of guests.
Recommendations for Hosts
- Target domestic marketing efforts towards travelers from Adelaide and Gold Coast.
- Tailor amenities and listing descriptions to appeal to the dominant Post-2000s (Gen Z/Alpha) demographic (e.g., highlight fast WiFi, smart home features, local guides).
- Highlight unique local experiences or amenities relevant to the primary guest profile.
- Consider seasonal promotions aligned with peak travel times for key origin markets.
Nearby Short-Term Rental Market Comparison
How does the Woolloongabba Airbnb market stack up against its neighbors? Compare key performance metrics like average monthly revenue, ADR, and occupancy rates in surrounding areas to understand the broader regional STR landscape.
| Market | Active Properties | Monthly Revenue | Daily Rate | Avg. Occupancy |
|---|---|---|---|---|
| Castaways Beach | 19 | $5,252 | $496.71 | 48% |
| Fingal | 13 | $4,377 | $305.13 | 54% |
| Noosa Heads | 1,033 | $4,015 | $387.33 | 46% |
| Byron Bay | 997 | $3,963 | $424.38 | 42% |
| Byron Shire Council | 193 | $3,807 | $423.69 | 42% |
| Sunrise Beach | 105 | $3,763 | $348.50 | 47% |
| Burleigh Heads | 28 | $3,610 | $342.10 | 50% |
| Point Lookout | 10 | $3,561 | $511.53 | 31% |
| Ewingsdale | 53 | $3,534 | $571.35 | 40% |
| Marcus Beach | 21 | $3,482 | $370.16 | 45% |