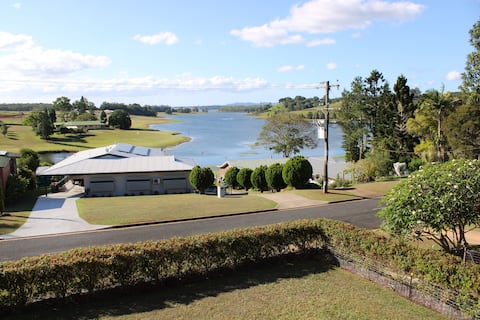
Yungaburra Airbnb Market Analysis 2026: Short Term Rental Data & Vacation Rental Statistics in Queensland, Australia
Is Airbnb profitable in Yungaburra in 2026? Explore comprehensive Airbnb analytics for Yungaburra, Queensland, Australia to uncover income potential. This 2026 STR market report for Yungaburra, based on AirROI data from February 2025 to January 2026, reveals key trends in the niche market of 54 active listings.
Whether you're considering an Airbnb investment in Yungaburra, optimizing your existing vacation rental, or exploring rental arbitrage opportunities, understanding the Yungaburra Airbnb data is crucial. Leveraging the low regulation environment is key to maximizing your short term rental income potential. Let's dive into the specifics.
Key Yungaburra Airbnb Performance Metrics Overview
Monthly Airbnb Revenue Variations & Income Potential in Yungaburra (2026)
Understanding the monthly revenue variations for Airbnb listings in Yungaburra is key to maximizing your short term rental income potential. Seasonality significantly impacts earnings. Our analysis, based on data from the past 12 months, shows that the peak revenue month for STRs in Yungaburra is typically July, while February often presents the lowest earnings, highlighting opportunities for strategic pricing adjustments during shoulder and low seasons. Explore the typical Airbnb income in Yungaburra across different performance tiers:
- Best-in-class properties (Top 10%) achieve $5,405+ monthly, often utilizing dynamic pricing and superior guest experiences.
- Strong performing properties (Top 25%) earn $3,542 or more, indicating effective management and desirable locations/amenities.
- Typical properties (Median) generate around $2,026 per month, representing the average market performance.
- Entry-level properties (Bottom 25%) see earnings around $998, often with potential for optimization.
Average Monthly Airbnb Earnings Trend in Yungaburra
Yungaburra Airbnb Occupancy Rate Trends (2026)
Maximize your bookings by understanding the Yungaburra STR occupancy trends. Seasonal demand shifts significantly influence how often properties are booked. Typically, Julysees the highest demand (peak season occupancy), while February experiences the lowest (low season). Effective strategies, like adjusting minimum stays or offering promotions, can boost occupancy during slower periods. Here's how different property tiers perform in Yungaburra:
- Best-in-class properties (Top 10%) achieve 76%+ occupancy, indicating high desirability and potentially optimized availability.
- Strong performing properties (Top 25%) maintain 60% or higher occupancy, suggesting good market fit and guest satisfaction.
- Typical properties (Median) have an occupancy rate around 36%.
- Entry-level properties (Bottom 25%) average 19% occupancy, potentially facing higher vacancy.
Average Monthly Occupancy Rate Trend in Yungaburra
Average Daily Rate (ADR) Airbnb Trends in Yungaburra (2026)
Effective short term rental pricing strategy in Yungaburra involves understanding monthly ADR fluctuations. The Average Daily Rate (ADR) for Airbnb in Yungaburra typically peaks in July and dips lowest during February. Leveraging Airbnb dynamic pricing tools or strategies based on this seasonality can significantly boost revenue. Here's a look at the typical nightly rates achieved:
- Best-in-class properties (Top 10%) command rates of $330+ per night, often due to premium features or locations.
- Strong performing properties (Top 25%) achieve nightly rates of $230 or more.
- Typical properties (Median) charge around $194 per night.
- Entry-level properties (Bottom 25%) earn around $143 per night.
Average Daily Rate (ADR) Trend by Month in Yungaburra
Get Live Yungaburra Market Intelligence 👇

Explore Real-time Analytics
Airbnb Seasonality Analysis & Trends in Yungaburra (2026)
Peak Season (July, September, August)
- Revenue averages $3,314 per month
- Occupancy rates average 50.4%
- Daily rates average $209
Shoulder Season
- Revenue averages $2,673 per month
- Occupancy maintains around 39.7%
- Daily rates hold near $204
Low Season (February, March, May)
- Revenue drops to average $1,742 per month
- Occupancy decreases to average 30.0%
- Daily rates adjust to average $201
Seasonality Insights for Yungaburra
- The Airbnb seasonality in Yungaburra shows highly seasonal trends requiring careful strategy. While the sections above show seasonal averages, it's also insightful to look at the extremes:
- During the high season, the absolute peak month showcases Yungaburra's highest earning potential, with monthly revenues capable of climbing to $3,537, occupancy reaching a high of 52.3%, and ADRs peaking at $212.
- Conversely, the slowest single month of the year, typically falling within the low season, marks the market's lowest point. In this month, revenue might dip to $1,165, occupancy could drop to 23.7%, and ADRs may adjust down to $195.
- Understanding both the seasonal averages and these monthly peaks and troughs in revenue, occupancy, and ADR is crucial for maximizing your Airbnb profit potential in Yungaburra.
Seasonal Strategies for Maximizing Profit
- Peak Season: Maximize revenue through premium pricing and potentially longer minimum stays. Ensure high availability.
- Low Season: Offer competitive pricing, special promotions (e.g., extended stay discounts), and flexible cancellation policies. Target off-season travelers like remote workers or budget-conscious guests.
- Shoulder Seasons: Implement dynamic pricing that balances peak and low rates. Target weekend travelers or specific events. Offer slightly more flexible terms than peak season.
- Regularly analyze your own performance against these Yungaburra seasonality benchmarks and adjust your pricing and availability strategy accordingly.
Best Areas for Airbnb Investment in Yungaburra (2026)
Exploring the top neighborhoods for short-term rentals in Yungaburra? This section highlights key areas, outlining why they are attractive for hosts and guests, along with notable local attractions. Consider these locations based on your target guest profile and investment strategy.
| Neighborhood / Area | Why Host Here? (Target Guests & Appeal) | Key Attractions & Landmarks |
|---|---|---|
| Lake Yungaburra | Scenic location on the shores of Lake Tinaroo, ideal for nature lovers and water sports enthusiasts. Provides a peaceful retreat and excellent fishing opportunities. | Lake Tinaroo, Yungaburra Markets, Crater Lakes National Park, Platypus Park, Curtain Fig Tree |
| Yungaburra Village | Charming village atmosphere with historic buildings, cafes, and shops. A great base for exploring the Atherton Tablelands and experiencing local culture. | Yungaburra Markets, Yungaburra Pub, Historic Yungaburra, Antique shops, Local art galleries |
| Atherton Tablelands | Beautiful highlands known for their stunning landscapes, waterfalls, and agritourism. Attracts visitors interested in ecology, hiking, and exploring Australia’s natural beauty. | Millaa Millaa Falls, Munga Thirri National Park, Curtain Fig Tree, Malanda Falls, Mount Hypipamee |
| Barrine Falls | Famous for its beautiful crater lake and waterfall. A popular spot for picnicking and swimming, making it a perfect family-friendly destination. | Lake Barrine, Barrine Rainforest Cruises, Picnic areas, Wildlife viewing, Nature walks |
| Gordonvale | A small town with rich history and access to beautiful landscapes. Close to Cairns makes it convenient for tourists looking to explore both city and nature. | Cacheu Valley, Ravenshoe, Gordonvale Heritage Walk, Local sheep farms, Aboriginal cultural sights |
| Malanda | Known for its beautiful waterfall and historical significance in the dairy industry. Attractive to visitors interested in nature and agriculture. | Malanda Falls, Malanda Dairy Centre, Bird watching, Local wildlife, Bushwalking tracks |
| Herberton | Historic town with heritage-listed buildings and museums. A great destination for history buffs and those interested in local culture and the gold rush era. | Herberton Historic Village, Historic buildings, Train rides, Museums, Local markets |
| Tinaroo Dam | A popular destination for water activities such as boating and fishing. It provides beautiful views and outdoor recreational opportunities. | Tinaroo Dam wall, Fishing spots, Picnic areas, Water sports, Scenic views |
Understanding Airbnb License Requirements & STR Laws in Yungaburra (2026)
While Yungaburra, Queensland, Australia currently shows low STR regulations, specific Airbnb license requirements might still exist or change. Always verify the latest short term rental regulations and Airbnb license requirements directly with local government authorities for Yungaburra to ensure full compliance before hosting.
(Source: AirROI data, 2026, finding no licensed listings among those analyzed)
Top Performing Airbnb Properties in Yungaburra (2026)
Benchmark your potential! Explore examples of top-performing Airbnb properties in Yungaburrabased on Trailing Twelve Month (TTM) revenue. Analyze their characteristics, revenue, occupancy rate, and ADR to understand what drives success in this market.

Luxury on Lake Tinaroo Lakefront Living
Entire Place • 5 bedrooms

LakeSide Tinaroo only 2.5km from Yungaburra town
Entire Place • 4 bedrooms

Oleander Escape Lake Front Retreat
Entire Place • 4 bedrooms

Lakeside Escape - Waterfrontage at Tinaburra
Entire Place • 4 bedrooms
Hamptons Haven | Lakeside Yungaburra
Entire Place • 5 bedrooms

Lake Tinaroo Waterfront Retreat
Entire Place • 3 bedrooms
Note: Performance varies based on location, size, amenities, seasonality, and management quality. Data reflects the past 12 months.
Top Performing Airbnb Hosts in Yungaburra (2026)
Learn from the best! This table showcases top-performing Airbnb hosts in Yungaburra based on the number of properties managed and estimated total revenue over the past year. Analyze their scale and performance metrics.
| Host Name | Properties | Grossing Revenue | Stay Reviews | Avg Rating |
|---|---|---|---|---|
| Gina | 13 | $211,767 | 286 | 4.85/5.0 |
| Thomas | 2 | $155,336 | 194 | 4.87/5.0 |
| Britt | 1 | $102,631 | 21 | 4.90/5.0 |
| Melissa | 1 | $72,340 | 142 | 4.95/5.0 |
| Debbie | 2 | $63,194 | 518 | 4.93/5.0 |
| Michelle | 1 | $59,406 | 39 | 5.00/5.0 |
| Shirley | 1 | $52,111 | 75 | 4.93/5.0 |
| Ric & Jilly | 1 | $49,377 | 172 | 4.92/5.0 |
| Brooke | 3 | $48,226 | 131 | 4.97/5.0 |
| Kerrie | 1 | $46,909 | 283 | 4.84/5.0 |
Analyzing the strategies of top hosts, such as their property selection, pricing, and guest communication, can offer valuable lessons for optimizing your own Airbnb operations in Yungaburra.
Dive Deeper: Advanced Yungaburra STR Market Data (2026)
Ready to unlock more insights? AirROI provides access to advanced metrics and comprehensive Airbnb data for Yungaburra. Explore detailed analytics beyond this report to refine your investment strategy, optimize pricing, and maximize your vacation rental profits.
Explore Advanced MetricsYungaburra Short-Term Rental Market Composition (2026): Property & Room Types
Room Type Distribution
Property Type Distribution
Market Composition Insights for Yungaburra
- The Yungaburra Airbnb market composition is heavily skewed towards Entire Home/Apt listings, which make up 90.7% of the 54 active rentals. This indicates strong guest preference for privacy and space.
- Looking at the property type distribution in Yungaburra, House properties are the most common (75.9%), reflecting the local real estate landscape.
- Houses represent a significant 75.9% portion, catering likely to families or larger groups.
- The presence of 7.4% Hotel/Boutique listings indicates integration with traditional hospitality.
- Smaller segments like apartment/condo, others (combined 5.6%) offer potential for unique stay experiences.
Yungaburra Airbnb Room Capacity Analysis (2026): Bedroom Distribution
Distribution of Listings by Number of Bedrooms
Room Capacity Insights for Yungaburra
- The dominant room capacity in Yungaburra is 1 bedroom listings, making up 42.6% of the market. This suggests a strong demand for properties suitable for couples or solo travelers.
- Together, 1 bedroom and 2 bedrooms properties represent 64.8% of the active Airbnb listings in Yungaburra, indicating a high concentration in these sizes.
- A significant 35.2% of listings offer 3+ bedrooms, catering to larger groups and families seeking more space in Yungaburra.
Yungaburra Vacation Rental Guest Capacity Trends (2026)
Distribution of Listings by Guest Capacity
Guest Capacity Insights for Yungaburra
- The most common guest capacity trend in Yungaburra vacation rentals is listings accommodating 2 guests (25.9%). This suggests the primary traveler segment is likely couples or solo travelers.
- Properties designed for 2 guests and 4 guests dominate the Yungaburra STR market, accounting for 51.8% of listings.
- 39.0% of properties accommodate 6+ guests, serving the market segment for larger families or group travel in Yungaburra.
- On average, properties in Yungaburra are equipped to host 4.7 guests.
Yungaburra Airbnb Booking Patterns (2026): Available vs. Booked Days
Available Days Distribution
Booked Days Distribution
Booking Pattern Insights for Yungaburra
- The most common availability pattern in Yungaburra falls within the 271-366 days range, representing 44.4% of listings. This suggests many properties have significant open periods on their calendars.
- Approximately 72.2% of listings show high availability (181+ days open annually), indicating potential for increased bookings or specific owner usage patterns.
- For booked days, the 91-180 days range is most frequent in Yungaburra (31.5%), reflecting common guest stay durations or potential owner blocking patterns.
- A notable 29.7% of properties secure long booking periods (181+ days booked per year), highlighting successful long-term rental strategies or significant owner usage.
Yungaburra Airbnb Minimum Stay Requirements Analysis
Distribution of Listings by Minimum Night Requirement
1 Night
19 listings
35.2% of total
2 Nights
18 listings
33.3% of total
3 Nights
2 listings
3.7% of total
30+ Nights
15 listings
27.8% of total
Key Insights
- The most prevalent minimum stay requirement in Yungaburra is 1 Night, adopted by 35.2% of listings. This highlights the market's preference for shorter, flexible bookings.
- A strong majority (68.5%) of the Yungaburra Airbnb data shows acceptance of very short stays (1-2 nights), indicating a dynamic, high-turnover market.
- A significant segment (27.8%) caters to monthly stays (30+ nights) in Yungaburra, pointing to opportunities in the extended-stay market.
Recommendations
- Align with the market by considering a 1 Night minimum stay, as 35.2% of Yungaburra hosts use this setting.
- Explore offering discounts for stays of 30+ nights to attract the 27.8% of the market seeking extended stays.
- Adjust minimum nights based on seasonality – potentially shorter during low season and longer during peak demand periods in Yungaburra.
Yungaburra Airbnb Cancellation Policy Trends Analysis (2026)
Flexible
15 listings
27.8% of total
Moderate
11 listings
20.4% of total
Firm
26 listings
48.1% of total
Strict
2 listings
3.7% of total
Cancellation Policy Insights for Yungaburra
- The prevailing Airbnb cancellation policy trend in Yungaburra is Firm, used by 48.1% of listings.
- A majority (51.8%) of hosts in Yungaburra utilize Firm or Strict policies, indicating a market where hosts prioritize booking security.
- Strict cancellation policies are quite rare (3.7%), potentially making listings with this policy less competitive unless justified by high demand or property type.
Recommendations for Hosts
- Consider adopting a Firm policy to align with the 48.1% market standard in Yungaburra.
- Using a Strict policy might deter some guests, as only 3.7% of listings use it. Evaluate if potential revenue protection outweighs possible lower booking rates.
- Regularly review your cancellation policy against competitors and market demand shifts in Yungaburra.
Yungaburra STR Booking Lead Time Analysis (2026)
Average Booking Lead Time by Month
Booking Lead Time Insights for Yungaburra
- The overall average booking lead time for vacation rentals in Yungaburra is 70 days.
- Guests book furthest in advance for stays during October (average 120 days), likely coinciding with peak travel demand or local events.
- The shortest booking windows occur for stays in March (average 26 days), indicating more last-minute travel plans during this time.
- Seasonally, Fall (95 days avg.) sees the longest lead times, while Spring (55 days avg.) has the shortest, reflecting typical travel planning cycles.
Recommendations for Hosts
- Use the overall average lead time (70 days) as a baseline for your pricing and availability strategy in Yungaburra.
- For October stays, consider implementing length-of-stay discounts or slightly higher rates for bookings made less than 120 days out to capitalize on advance planning.
- Target marketing efforts for the Fall season well in advance (at least 95 days) to capture early planners.
- Monitor your own booking lead times against these Yungaburra averages to identify opportunities for dynamic pricing adjustments.
Popular & Essential Airbnb Amenities in Yungaburra (2026)
Amenity Prevalence
Amenity Insights for Yungaburra
- Essential amenities in Yungaburra that guests expect include: Free parking on premises, Smoke alarm. Lacking these (any) could significantly impact bookings.
- Popular amenities like Essentials, Dishes and silverware, Refrigerator are common but not universal. Offering these can provide a competitive edge.
Recommendations for Hosts
- Ensure your listing includes all essential amenities for Yungaburra: Free parking on premises, Smoke alarm.
- Prioritize adding missing essentials: Smoke alarm.
- Consider adding popular differentiators like Essentials or Dishes and silverware to increase appeal.
- Highlight unique or less common amenities you offer (e.g., hot tub, dedicated workspace, EV charger) in your listing description and photos.
- Regularly check competitor amenities in Yungaburra to stay competitive.
Yungaburra Airbnb Guest Demographics & Profile Analysis (2026)
Guest Profile Summary for Yungaburra
- The typical guest profile for Airbnb in Yungaburra consists of primarily domestic travelers (86%), often arriving from nearby Queensland, typically belonging to the Post-2000s (Gen Z/Alpha) group (50%), primarily speaking English or French.
- Domestic travelers account for 86.1% of guests.
- Key international markets include Australia (86.1%) and United States (4%).
- Top languages spoken are English (72.7%) followed by French (6.1%).
- A significant demographic segment is the Post-2000s (Gen Z/Alpha) group, representing 50% of guests.
Recommendations for Hosts
- Target domestic marketing efforts towards travelers from Queensland and Cairns.
- Tailor amenities and listing descriptions to appeal to the dominant Post-2000s (Gen Z/Alpha) demographic (e.g., highlight fast WiFi, smart home features, local guides).
- Highlight unique local experiences or amenities relevant to the primary guest profile.
- Consider seasonal promotions aligned with peak travel times for key origin markets.
Nearby Short-Term Rental Market Comparison
How does the Yungaburra Airbnb market stack up against its neighbors? Compare key performance metrics like average monthly revenue, ADR, and occupancy rates in surrounding areas to understand the broader regional STR landscape.
| Market | Active Properties | Monthly Revenue | Daily Rate | Avg. Occupancy |
|---|---|---|---|---|
| Kewarra Beach | 47 | $4,698 | $360.15 | 51% |
| Palm Cove | 99 | $3,938 | $361.83 | 48% |
| Cairns Regional | 693 | $3,554 | $312.48 | 43% |
| Trinity Beach | 14 | $3,387 | $316.88 | 50% |
| Port Douglas | 647 | $2,992 | $339.48 | 40% |
| Douglas Shire | 149 | $2,812 | $291.13 | 41% |
| Mossman | 11 | $2,656 | $212.54 | 48% |
| Cairns North | 27 | $2,548 | $217.45 | 52% |
| Tablelands Regional | 41 | $2,533 | $248.64 | 46% |
| Cairns | 917 | $2,531 | $177.00 | 54% |