Kettering Airbnb Market Analysis 2025: Short Term Rental Data & Vacation Rental Statistics in Tasmania, Australia
Is Airbnb profitable in Kettering in 2025? Explore comprehensive Airbnb analytics for Kettering, Tasmania, Australia to uncover income potential. This 2025 STR market report for Kettering, based on AirROI data from October 2024 to September 2025, reveals key trends in the niche market of 18 active listings.
Whether you're considering an Airbnb investment in Kettering, optimizing your existing vacation rental, or exploring rental arbitrage opportunities, understanding the Kettering Airbnb data is crucial. Navigating the high regulation landscape is key to maximizing your short term rental income potential. Let's dive into the specifics.
Key Kettering Airbnb Performance Metrics Overview
Monthly Airbnb Revenue Variations & Income Potential in Kettering (2025)
Understanding the monthly revenue variations for Airbnb listings in Kettering is key to maximizing your short term rental income potential. Seasonality significantly impacts earnings. Our analysis, based on data from the past 12 months, shows that the peak revenue month for STRs in Kettering is typically December, while May often presents the lowest earnings, highlighting opportunities for strategic pricing adjustments during shoulder and low seasons. Explore the typical Airbnb income in Kettering across different performance tiers:
- Best-in-class properties (Top 10%) achieve $3,497+ monthly, often utilizing dynamic pricing and superior guest experiences.
- Strong performing properties (Top 25%) earn $2,593 or more, indicating effective management and desirable locations/amenities.
- Typical properties (Median) generate around $1,598 per month, representing the average market performance.
- Entry-level properties (Bottom 25%) see earnings around $799, often with potential for optimization.
Average Monthly Airbnb Earnings Trend in Kettering
Kettering Airbnb Occupancy Rate Trends (2025)
Maximize your bookings by understanding the Kettering STR occupancy trends. Seasonal demand shifts significantly influence how often properties are booked. Typically, Januarysees the highest demand (peak season occupancy), while August experiences the lowest (low season). Effective strategies, like adjusting minimum stays or offering promotions, can boost occupancy during slower periods. Here's how different property tiers perform in Kettering:
- Best-in-class properties (Top 10%) achieve 69%+ occupancy, indicating high desirability and potentially optimized availability.
- Strong performing properties (Top 25%) maintain 57% or higher occupancy, suggesting good market fit and guest satisfaction.
- Typical properties (Median) have an occupancy rate around 38%.
- Entry-level properties (Bottom 25%) average 19% occupancy, potentially facing higher vacancy.
Average Monthly Occupancy Rate Trend in Kettering
Average Daily Rate (ADR) Airbnb Trends in Kettering (2025)
Effective short term rental pricing strategy in Kettering involves understanding monthly ADR fluctuations. The Average Daily Rate (ADR) for Airbnb in Kettering typically peaks in January and dips lowest during May. Leveraging Airbnb dynamic pricing tools or strategies based on this seasonality can significantly boost revenue. Here's a look at the typical nightly rates achieved:
- Best-in-class properties (Top 10%) command rates of $220+ per night, often due to premium features or locations.
- Strong performing properties (Top 25%) achieve nightly rates of $179 or more.
- Typical properties (Median) charge around $150 per night.
- Entry-level properties (Bottom 25%) earn around $122 per night.
Average Daily Rate (ADR) Trend by Month in Kettering
Get Live Kettering Market Intelligence 👇

Explore Real-time Analytics
Airbnb Seasonality Analysis & Trends in Kettering (2025)
Peak Season (December, January, February)
- Revenue averages $2,940 per month
- Occupancy rates average 61.6%
- Daily rates average $162
Shoulder Season
- Revenue averages $1,585 per month
- Occupancy maintains around 34.9%
- Daily rates hold near $153
Low Season (May, August, November)
- Revenue drops to average $1,188 per month
- Occupancy decreases to average 25.9%
- Daily rates adjust to average $149
Seasonality Insights for Kettering
- The Airbnb seasonality in Kettering shows highly seasonal trends requiring careful strategy. While the sections above show seasonal averages, it's also insightful to look at the extremes:
- During the high season, the absolute peak month showcases Kettering's highest earning potential, with monthly revenues capable of climbing to $3,368, occupancy reaching a high of 66.7%, and ADRs peaking at $165.
- Conversely, the slowest single month of the year, typically falling within the low season, marks the market's lowest point. In this month, revenue might dip to $1,019, occupancy could drop to 23.8%, and ADRs may adjust down to $143.
- Understanding both the seasonal averages and these monthly peaks and troughs in revenue, occupancy, and ADR is crucial for maximizing your Airbnb profit potential in Kettering.
Seasonal Strategies for Maximizing Profit
- Peak Season: Maximize revenue through premium pricing and potentially longer minimum stays. Ensure high availability.
- Low Season: Offer competitive pricing, special promotions (e.g., extended stay discounts), and flexible cancellation policies. Target off-season travelers like remote workers or budget-conscious guests.
- Shoulder Seasons: Implement dynamic pricing that balances peak and low rates. Target weekend travelers or specific events. Offer slightly more flexible terms than peak season.
- Regularly analyze your own performance against these Kettering seasonality benchmarks and adjust your pricing and availability strategy accordingly.
Best Areas for Airbnb Investment in Kettering (2025)
Exploring the top neighborhoods for short-term rentals in Kettering? This section highlights key areas, outlining why they are attractive for hosts and guests, along with notable local attractions. Consider these locations based on your target guest profile and investment strategy.
| Neighborhood / Area | Why Host Here? (Target Guests & Appeal) | Key Attractions & Landmarks |
|---|---|---|
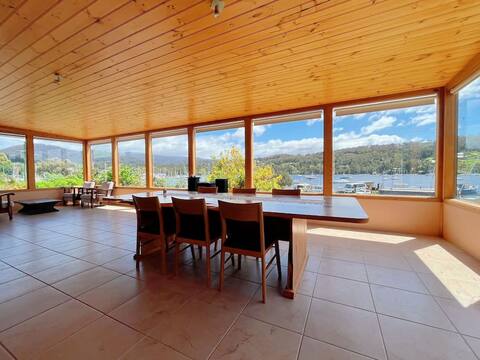
| Kettering Village | A charming village atmosphere with stunning waterfront views and proximity to Bruny Island. Popular for visitors wanting a peaceful retreat close to nature. | Bruny Island Ferry, Kettering Boatshed, Coningham Nature Reserve, Local markets, Nearby hiking trails |
| North West Bay | Beautiful coastal area known for its breathtaking views and outdoor activities. Attracts nature lovers and those looking for a serene getaway. | North West Bay River, Scenic walking tracks, Fishing spots, Local beaches, Picnic areas |
| Kettering Yacht Club | A hub for sailing enthusiasts with easy access to waterways. Ideal for guests who enjoy sailing or boating activities. | Yacht club events, Sailing lessons, Scenic boat trips, Waterfront dining, Marina views |
| Churchill Park | A picturesque park area offering green spaces and recreational facilities. Perfect for families and outdoor enthusiasts. | Playgrounds, Barbecue spots, Walking paths, Community events, Sports facilities |
| Tinderbox | A peaceful suburb known for its natural beauty and proximity to the water. Great for a quiet retreat in nature. | Tinderbox Marine Reserve, Beaches, Bushwalking trails, Bird watching, Scenic lookouts |
| Coningham | Located near the Coningham Beach, this area offers a laid-back vibe and beautiful coastal scenery. | Coningham Beach, Coningham Nature Reserve, Walking trails, Local wildlife, Water sports |
| Snug | A quaint community with a beautiful beach and fantastic views, perfect for a tranquil weekend getaway. | Snug Beach, Local cafes, Nature walks, Fishing spots, Scenic coastal drives |
| Esperance | A small, serene area known for its stunning beaches and natural beauty, attracting visitors seeking relaxation. | Esperance Beach, Hiking trails, Wildlife parks, Local art galleries, Scenic drives |
Understanding Airbnb License Requirements & STR Laws in Kettering (2025)
Yes, Kettering, Tasmania, Australia enforces high STR regulations. Obtaining a license and ensuring compliance is almost certainly required according to current 2025 STR laws. Always verify the latest short term rental regulations and Airbnb license requirements directly with local government authorities for Kettering to ensure full compliance before hosting.
(Source: AirROI data, 2025, based on 72% licensed listings)
Top Performing Airbnb Properties in Kettering (2025)
Benchmark your potential! Explore examples of top-performing Airbnb properties in Ketteringbased on Trailing Twelve Month (TTM) revenue. Analyze their characteristics, revenue, occupancy rate, and ADR to understand what drives success in this market.

Little Oyster Bayview - one bedroom cottage
Entire Place • 1 bedroom
Coastal Cabin next to Bruny Island Ferry
Entire Place • 4 bedrooms
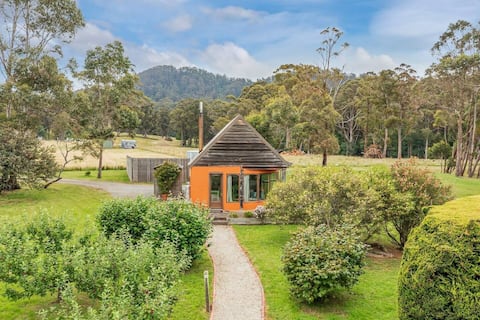
Herons Studio—A Picturesque Couple’s Cottage
Entire Place • 1 bedroom
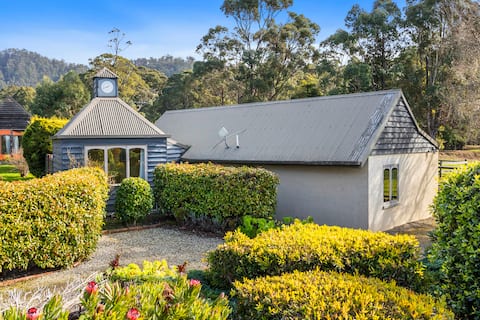
The Clocktower—Serene Stay at Herons Rise Vineyard
Entire Place • 2 bedrooms
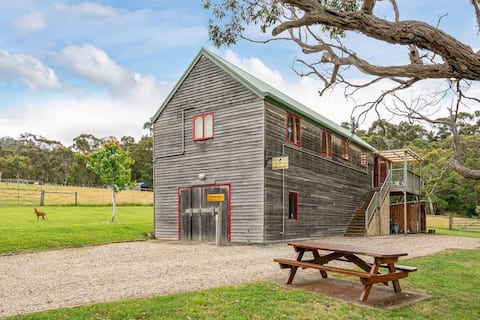
Wine Loft—Cosy Country Retreat with Ocean Views
Entire Place • 2 bedrooms

Kettering Moorings accommodation
Entire Place • 1 bedroom
Note: Performance varies based on location, size, amenities, seasonality, and management quality. Data reflects the past 12 months.
Top Performing Airbnb Hosts in Kettering (2025)
Learn from the best! This table showcases top-performing Airbnb hosts in Kettering based on the number of properties managed and estimated total revenue over the past year. Analyze their scale and performance metrics.
| Host Name | Properties | Grossing Revenue | Stay Reviews | Avg Rating |
|---|---|---|---|---|
| Hosting Hobart | 3 | $74,217 | 170 | 4.56/5.0 |
| Judy | 1 | $40,545 | 85 | 5.00/5.0 |
| Bowen | 1 | $32,729 | 38 | 4.55/5.0 |
| John | 1 | $21,822 | 340 | 4.98/5.0 |
| Karen | 1 | $20,122 | 16 | 5.00/5.0 |
| Lucy | 1 | $20,113 | 251 | 4.98/5.0 |
| Marcus | 1 | $17,274 | 38 | 4.97/5.0 |
| Craig | 2 | $17,187 | 15 | 5.00/5.0 |
| Doug | 1 | $12,222 | 195 | 4.98/5.0 |
| Theodora | 1 | $9,664 | 12 | 4.92/5.0 |
Analyzing the strategies of top hosts, such as their property selection, pricing, and guest communication, can offer valuable lessons for optimizing your own Airbnb operations in Kettering.
Dive Deeper: Advanced Kettering STR Market Data (2025)
Ready to unlock more insights? AirROI provides access to advanced metrics and comprehensive Airbnb data for Kettering. Explore detailed analytics beyond this report to refine your investment strategy, optimize pricing, and maximize your vacation rental profits.
Explore Advanced MetricsKettering Short-Term Rental Market Composition (2025): Property & Room Types
Room Type Distribution
Property Type Distribution
Market Composition Insights for Kettering
- The Kettering Airbnb market composition is heavily skewed towards Entire Home/Apt listings, which make up 100% of the 18 active rentals. This indicates strong guest preference for privacy and space.
- Looking at the property type distribution in Kettering, House properties are the most common (38.9%), reflecting the local real estate landscape.
- Houses represent a significant 38.9% portion, catering likely to families or larger groups.
- The presence of 27.8% Hotel/Boutique listings indicates integration with traditional hospitality.
Kettering Airbnb Room Capacity Analysis (2025): Bedroom Distribution
Distribution of Listings by Number of Bedrooms
Room Capacity Insights for Kettering
- The dominant room capacity in Kettering is 1 bedroom listings, making up 50% of the market. This suggests a strong demand for properties suitable for couples or solo travelers.
- Together, 1 bedroom and 2 bedrooms properties represent 88.9% of the active Airbnb listings in Kettering, indicating a high concentration in these sizes.
Kettering Vacation Rental Guest Capacity Trends (2025)
Distribution of Listings by Guest Capacity
Guest Capacity Insights for Kettering
- The most common guest capacity trend in Kettering vacation rentals is listings accommodating 2 guests (44.4%). This suggests the primary traveler segment is likely couples or solo travelers.
- Properties designed for 2 guests and 4 guests dominate the Kettering STR market, accounting for 66.6% of listings.
- A significant 44.4% of listings cater specifically to 1-2 guests, highlighting strong demand from couples and solo travelers in Kettering.
- 16.7% of properties accommodate 6+ guests, serving the market segment for larger families or group travel in Kettering.
- On average, properties in Kettering are equipped to host 3.5 guests.
Kettering Airbnb Booking Patterns (2025): Available vs. Booked Days
Available Days Distribution
Booked Days Distribution
Booking Pattern Insights for Kettering
- The most common availability pattern in Kettering falls within the 181-270 days range, representing 50% of listings. This suggests many properties have significant open periods on their calendars.
- Approximately 88.9% of listings show high availability (181+ days open annually), indicating potential for increased bookings or specific owner usage patterns.
- For booked days, the 91-180 days range is most frequent in Kettering (50%), reflecting common guest stay durations or potential owner blocking patterns.
- A notable 16.7% of properties secure long booking periods (181+ days booked per year), highlighting successful long-term rental strategies or significant owner usage.
Kettering Airbnb Minimum Stay Requirements Analysis
Distribution of Listings by Minimum Night Requirement
1 Night
5 listings
29.4% of total
2 Nights
7 listings
41.2% of total
30+ Nights
5 listings
29.4% of total
Key Insights
- The most prevalent minimum stay requirement in Kettering is 2 Nights, adopted by 41.2% of listings. This highlights the market's preference for shorter, flexible bookings.
- A strong majority (70.6%) of the Kettering Airbnb data shows acceptance of very short stays (1-2 nights), indicating a dynamic, high-turnover market.
- A significant segment (29.4%) caters to monthly stays (30+ nights) in Kettering, pointing to opportunities in the extended-stay market.
Recommendations
- Align with the market by considering a 2 Nights minimum stay, as 41.2% of Kettering hosts use this setting.
- If feasible, allowing 1-night stays, especially midweek or during low season, could capture last-minute bookings, as only 29.4% currently do.
- Explore offering discounts for stays of 30+ nights to attract the 29.4% of the market seeking extended stays.
- Adjust minimum nights based on seasonality – potentially shorter during low season and longer during peak demand periods in Kettering.
Kettering Airbnb Cancellation Policy Trends Analysis (2025)
Super Strict 30 Days
1 listings
5.9% of total
Flexible
6 listings
35.3% of total
Moderate
3 listings
17.6% of total
Firm
5 listings
29.4% of total
Strict
2 listings
11.8% of total
Cancellation Policy Insights for Kettering
- The prevailing Airbnb cancellation policy trend in Kettering is Flexible, used by 35.3% of listings.
- There's a relatively balanced mix between guest-friendly (52.9%) and stricter (41.2%) policies, offering choices for different guest needs.
Recommendations for Hosts
- Consider adopting a Flexible policy to align with the 35.3% market standard in Kettering.
- Using a Strict policy might deter some guests, as only 11.8% of listings use it. Evaluate if potential revenue protection outweighs possible lower booking rates.
- Regularly review your cancellation policy against competitors and market demand shifts in Kettering.
Kettering STR Booking Lead Time Analysis (2025)
Average Booking Lead Time by Month
Booking Lead Time Insights for Kettering
- The overall average booking lead time for vacation rentals in Kettering is 48 days.
- Guests book furthest in advance for stays during November (average 70 days), likely coinciding with peak travel demand or local events.
- The shortest booking windows occur for stays in July (average 11 days), indicating more last-minute travel plans during this time.
- Seasonally, Winter (57 days avg.) sees the longest lead times, while Summer (16 days avg.) has the shortest, reflecting typical travel planning cycles.
Recommendations for Hosts
- Use the overall average lead time (48 days) as a baseline for your pricing and availability strategy in Kettering.
- For November stays, consider implementing length-of-stay discounts or slightly higher rates for bookings made less than 70 days out to capitalize on advance planning.
- During July, focus on last-minute booking availability and promotions, as guests book with very short notice (11 days avg.).
- Target marketing efforts for the Winter season well in advance (at least 57 days) to capture early planners.
- Monitor your own booking lead times against these Kettering averages to identify opportunities for dynamic pricing adjustments.
Popular & Essential Airbnb Amenities in Kettering (2025)
Amenity Prevalence
Amenity Insights for Kettering
- Essential amenities in Kettering that guests expect include: Dishes and silverware, Smoke alarm, TV. Lacking these (any) could significantly impact bookings.
- Popular amenities like Cooking basics, Microwave, Heating are common but not universal. Offering these can provide a competitive edge.
Recommendations for Hosts
- Ensure your listing includes all essential amenities for Kettering: Dishes and silverware, Smoke alarm, TV.
- Consider adding popular differentiators like Cooking basics or Microwave to increase appeal.
- Highlight unique or less common amenities you offer (e.g., hot tub, dedicated workspace, EV charger) in your listing description and photos.
- Regularly check competitor amenities in Kettering to stay competitive.
Kettering Airbnb Guest Demographics & Profile Analysis (2025)
Guest Profile Summary for Kettering
- The typical guest profile for Airbnb in Kettering consists of primarily domestic travelers (81%), often arriving from nearby Melbourne, typically belonging to the Post-2000s (Gen Z/Alpha) group (50%), primarily speaking English or Chinese.
- Domestic travelers account for 81.0% of guests.
- Key international markets include Australia (81%) and United Kingdom (5.1%).
- Top languages spoken are English (64.5%) followed by Chinese (6.5%).
- A significant demographic segment is the Post-2000s (Gen Z/Alpha) group, representing 50% of guests.
Recommendations for Hosts
- Target domestic marketing efforts towards travelers from Melbourne and Brisbane.
- Tailor amenities and listing descriptions to appeal to the dominant Post-2000s (Gen Z/Alpha) demographic (e.g., highlight fast WiFi, smart home features, local guides).
- Highlight unique local experiences or amenities relevant to the primary guest profile.
- Consider seasonal promotions aligned with peak travel times for key origin markets.
Nearby Short-Term Rental Market Comparison
How does the Kettering Airbnb market stack up against its neighbors? Compare key performance metrics like average monthly revenue, ADR, and occupancy rates in surrounding areas to understand the broader regional STR landscape.
| Market | Active Properties | Monthly Revenue | Daily Rate | Avg. Occupancy |
|---|---|---|---|---|
| Sandford | 13 | $4,164 | $214.34 | 62% |
| Coles Bay | 143 | $3,823 | $255.71 | 52% |
| Glamorgan-Spring Bay | 64 | $3,705 | $247.62 | 54% |
| Alonnah | 41 | $3,177 | $226.76 | 47% |
| Adventure Bay | 49 | $3,081 | $214.74 | 52% |
| Swansea | 56 | $2,944 | $262.97 | 44% |
| City of Clarence | 18 | $2,936 | $303.95 | 45% |
| Hobart | 1,656 | $2,605 | $187.26 | 54% |
| Opossum Bay | 17 | $2,578 | $273.12 | 38% |
| Kingborough | 90 | $2,524 | $222.72 | 44% |