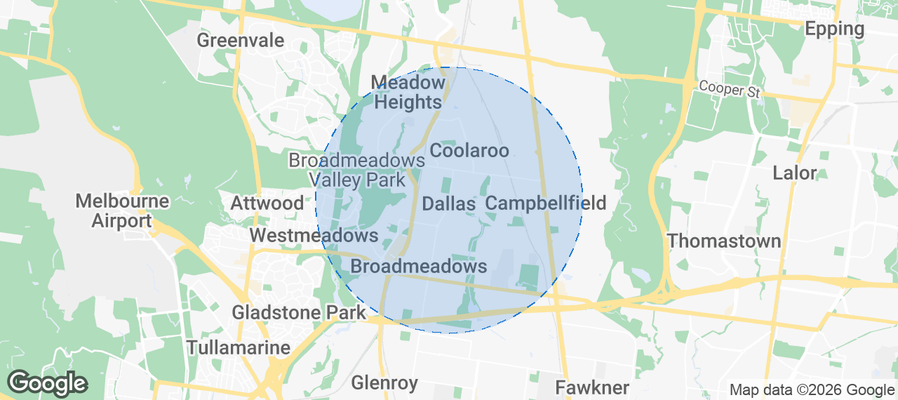
Dallas Airbnb Market Analysis 2026: Short Term Rental Data & Vacation Rental Statistics in Victoria, Australia
Is Airbnb profitable in Dallas in 2026? Explore comprehensive Airbnb analytics for Dallas, Victoria, Australia to uncover income potential. This 2026 STR market report for Dallas, based on AirROI data from February 2025 to January 2026, reveals key trends in the niche market of 20 active listings.
Whether you're considering an Airbnb investment in Dallas, optimizing your existing vacation rental, or exploring rental arbitrage opportunities, understanding the Dallas Airbnb data is crucial. Leveraging the low regulation environment is key to maximizing your short term rental income potential. Let's dive into the specifics.
Key Dallas Airbnb Performance Metrics Overview
Monthly Airbnb Revenue Variations & Income Potential in Dallas (2026)
Understanding the monthly revenue variations for Airbnb listings in Dallas is key to maximizing your short term rental income potential. Seasonality significantly impacts earnings. Our analysis, based on data from the past 12 months, shows that the peak revenue month for STRs in Dallas is typically November, while May often presents the lowest earnings, highlighting opportunities for strategic pricing adjustments during shoulder and low seasons. Explore the typical Airbnb income in Dallas across different performance tiers:
- Best-in-class properties (Top 10%) achieve $795+ monthly, often utilizing dynamic pricing and superior guest experiences.
- Strong performing properties (Top 25%) earn $716 or more, indicating effective management and desirable locations/amenities.
- Typical properties (Median) generate around $524 per month, representing the average market performance.
- Entry-level properties (Bottom 25%) see earnings around $373, often with potential for optimization.
Average Monthly Airbnb Earnings Trend in Dallas
Dallas Airbnb Occupancy Rate Trends (2026)
Maximize your bookings by understanding the Dallas STR occupancy trends. Seasonal demand shifts significantly influence how often properties are booked. Typically, Novembersees the highest demand (peak season occupancy), while May experiences the lowest (low season). Effective strategies, like adjusting minimum stays or offering promotions, can boost occupancy during slower periods. Here's how different property tiers perform in Dallas:
- Best-in-class properties (Top 10%) achieve 77%+ occupancy, indicating high desirability and potentially optimized availability.
- Strong performing properties (Top 25%) maintain 67% or higher occupancy, suggesting good market fit and guest satisfaction.
- Typical properties (Median) have an occupancy rate around 49%.
- Entry-level properties (Bottom 25%) average 35% occupancy, potentially facing higher vacancy.
Average Monthly Occupancy Rate Trend in Dallas
Average Daily Rate (ADR) Airbnb Trends in Dallas (2026)
Effective short term rental pricing strategy in Dallas involves understanding monthly ADR fluctuations. The Average Daily Rate (ADR) for Airbnb in Dallas typically peaks in December and dips lowest during August. Leveraging Airbnb dynamic pricing tools or strategies based on this seasonality can significantly boost revenue. Here's a look at the typical nightly rates achieved:
- Best-in-class properties (Top 10%) command rates of $41+ per night, often due to premium features or locations.
- Strong performing properties (Top 25%) achieve nightly rates of $38 or more.
- Typical properties (Median) charge around $33 per night.
- Entry-level properties (Bottom 25%) earn around $31 per night.
Average Daily Rate (ADR) Trend by Month in Dallas
Get Live Dallas Market Intelligence 👇
Explore Real-time Analytics
Airbnb Seasonality Analysis & Trends in Dallas (2026)
Peak Season (November, July, September)
- Revenue averages $742 per month
- Occupancy rates average 72.4%
- Daily rates average $37
Shoulder Season
- Revenue averages $458 per month
- Occupancy maintains around 39.9%
- Daily rates hold near $39
Low Season (February, March, April)
- Revenue drops to average $0 per month
- Occupancy decreases to average 0.0%
- Daily rates adjust to average $34
Seasonality Insights for Dallas
- The Airbnb seasonality in Dallas shows highly seasonal trends requiring careful strategy. While the sections above show seasonal averages, it's also insightful to look at the extremes:
- During the high season, the absolute peak month showcases Dallas's highest earning potential, with monthly revenues capable of climbing to $856, occupancy reaching a high of 77.6%, and ADRs peaking at $47.
- Conversely, the slowest single month of the year, typically falling within the low season, marks the market's lowest point. In this month, revenue might dip to $0, occupancy could drop to 0.0%, and ADRs may adjust down to $31.
- Understanding both the seasonal averages and these monthly peaks and troughs in revenue, occupancy, and ADR is crucial for maximizing your Airbnb profit potential in Dallas.
Seasonal Strategies for Maximizing Profit
- Peak Season: Maximize revenue through premium pricing and potentially longer minimum stays. Ensure high availability.
- Low Season: Offer competitive pricing, special promotions (e.g., extended stay discounts), and flexible cancellation policies. Target off-season travelers like remote workers or budget-conscious guests.
- Shoulder Seasons: Implement dynamic pricing that balances peak and low rates. Target weekend travelers or specific events. Offer slightly more flexible terms than peak season.
- Regularly analyze your own performance against these Dallas seasonality benchmarks and adjust your pricing and availability strategy accordingly.
Best Areas for Airbnb Investment in Dallas (2026)
Exploring the top neighborhoods for short-term rentals in Dallas? This section highlights key areas, outlining why they are attractive for hosts and guests, along with notable local attractions. Consider these locations based on your target guest profile and investment strategy.
| Neighborhood / Area | Why Host Here? (Target Guests & Appeal) | Key Attractions & Landmarks |
|---|---|---|
| City Centre | The vibrant heart of Dallas, known for its dining, shopping, and entertainment options. Attracts tourists and business travelers alike. | Dallas Museum of Art, Klyde Warren Park, Reunion Tower, The Dallas World Aquarium, Uptown Dallas |
| Deep Ellum | A historic and artsy neighborhood famous for its nightlife and live music venues. Popular with young adults and creatives looking for a lively atmosphere. | Deep Ellum Arts District, Bishop Arts District, Dallas street art, Live music venues, Boutique shops |
| Bishop Arts District | A trendy neighborhood known for its unique shops, restaurants, and artistic vibe. Great for those looking for a local experience away from the tourist spots. | Bishop Arts Theatre, Local boutiques, Art galleries, Unique dining options, Food trucks |
| Oak Lawn | A diverse and vibrant neighborhood known for its nightlife and LGBTQ+ friendly environment. Popular for travelers seeking nightlife and fun. | Dallas Cowboys Stadium, Oaklawn Park, Nightclubs and bars, Dallas Voice, Cedar Springs Road |
| Uptown | A stylish and upscale area with a blend of residences, restaurants, and shops. Attracts young professionals and visitors looking for luxury. | Katy Trail, West Village, Restaurants and cafes, Nightlife, Luxury shopping |
| Lakewood | A scenic neighborhood known for its parks and proximity to White Rock Lake. Great for nature lovers and families. | White Rock Lake, Dallas Arboretum, Lakewood Park, Biking and walking trails, Scenic views |
| Lower Greenville | A popular dining and nightlife area known for its eclectic bars and restaurants. Attracts a youthful crowd looking for a fun evening out. | Greenville Avenue, Live music venues, Restaurants and bars, Cafes, Unique shops |
| Fort Worth | A vibrant part of the Dallas-Fort Worth metroplex with its own attractions and cultural experiences, appealing to a wide range of visitors. | Fort Worth Stockyards, Kimbell Art Museum, Fort Worth Zoo, Sundance Square, Cultural District |
Understanding Airbnb License Requirements & STR Laws in Dallas (2026)
While Dallas, Victoria, Australia currently shows low STR regulations, specific Airbnb license requirements might still exist or change. Always verify the latest short term rental regulations and Airbnb license requirements directly with local government authorities for Dallas to ensure full compliance before hosting.
(Source: AirROI data, 2026, finding no licensed listings among those analyzed)
Top Performing Airbnb Properties in Dallas (2026)
Benchmark your potential! Explore examples of top-performing Airbnb properties in Dallasbased on Trailing Twelve Month (TTM) revenue. Analyze their characteristics, revenue, occupancy rate, and ADR to understand what drives success in this market.

Sunshine coast - Budget friendly private room
Private Room • N/A

The Capsule - SMALL budget friendly private room
Private Room • N/A

The Stopover - Budget friendly private room
Private Room • N/A

The Terminal - SMALL budget friendly private room
Private Room • N/A

The Crossroads - Budget friendly private room
Private Room • N/A

The Link - Budget friendly private room
Private Room • N/A
Note: Performance varies based on location, size, amenities, seasonality, and management quality. Data reflects the past 12 months.
Top Performing Airbnb Hosts in Dallas (2026)
Learn from the best! This table showcases top-performing Airbnb hosts in Dallas based on the number of properties managed and estimated total revenue over the past year. Analyze their scale and performance metrics.
| Host Name | Properties | Grossing Revenue | Stay Reviews | Avg Rating |
|---|---|---|---|---|
| Oliver | 20 | $56,496 | 402 | 4.96/5.0 |
Analyzing the strategies of top hosts, such as their property selection, pricing, and guest communication, can offer valuable lessons for optimizing your own Airbnb operations in Dallas.
Dive Deeper: Advanced Dallas STR Market Data (2026)
Ready to unlock more insights? AirROI provides access to advanced metrics and comprehensive Airbnb data for Dallas. Explore detailed analytics beyond this report to refine your investment strategy, optimize pricing, and maximize your vacation rental profits.
Explore Advanced MetricsDallas Short-Term Rental Market Composition (2026): Property & Room Types
Room Type Distribution
Property Type Distribution
Market Composition Insights for Dallas
- The Dallas Airbnb market composition is heavily skewed towards Private Room listings, which make up 95% of the 20 active rentals. This indicates strong guest preference for privacy and space.
- Looking at the property type distribution in Dallas, House properties are the most common (100%), reflecting the local real estate landscape.
- Houses represent a significant 100% portion, catering likely to families or larger groups.
Dallas Airbnb Room Capacity Analysis (2026): Bedroom Distribution
Distribution of Listings by Number of Bedrooms
Room Capacity Insights for Dallas
- The dominant room capacity in Dallas is 1 bedroom listings, making up 5% of the market. This suggests a strong demand for properties suitable for couples or solo travelers.
Dallas Vacation Rental Guest Capacity Trends (2026)
Distribution of Listings by Guest Capacity
Guest Capacity Insights for Dallas
- The most common guest capacity trend in Dallas vacation rentals is listings accommodating 1 guest (5%). This suggests the primary traveler segment is likely couples or solo travelers.
- On average, properties in Dallas are equipped to host 0.1 guests.
Dallas Airbnb Booking Patterns (2026): Available vs. Booked Days
Available Days Distribution
Booked Days Distribution
Booking Pattern Insights for Dallas
- The most common availability pattern in Dallas falls within the 271-366 days range, representing 55% of listings. This suggests many properties have significant open periods on their calendars.
- Approximately 90.0% of listings show high availability (181+ days open annually), indicating potential for increased bookings or specific owner usage patterns.
- For booked days, the 1-30 days range is most frequent in Dallas (45%), reflecting common guest stay durations or potential owner blocking patterns.
- A notable 15.0% of properties secure long booking periods (181+ days booked per year), highlighting successful long-term rental strategies or significant owner usage.
Dallas Airbnb Minimum Stay Requirements Analysis
Distribution of Listings by Minimum Night Requirement
1 Night
20 listings
100% of total
Key Insights
- The most prevalent minimum stay requirement in Dallas is 1 Night, adopted by 100% of listings. This highlights the market's preference for shorter, flexible bookings.
- A strong majority (100.0%) of the Dallas Airbnb data shows acceptance of very short stays (1-2 nights), indicating a dynamic, high-turnover market.
Recommendations
- Align with the market by considering a 1 Night minimum stay, as 100% of Dallas hosts use this setting.
- Adjust minimum nights based on seasonality – potentially shorter during low season and longer during peak demand periods in Dallas.
Dallas Airbnb Cancellation Policy Trends Analysis (2026)
Flexible
20 listings
100% of total
Cancellation Policy Insights for Dallas
- The prevailing Airbnb cancellation policy trend in Dallas is Flexible, used by 100% of listings.
- The market strongly favors guest-friendly terms, with 100.0% of listings offering Flexible or Moderate policies. This suggests guests in Dallas may expect booking flexibility.
Recommendations for Hosts
- Consider adopting a Flexible policy to align with the 100% market standard in Dallas.
- Given the high prevalence of Flexible policies (100%), offering this can enhance booking appeal, especially during shoulder seasons.
- Regularly review your cancellation policy against competitors and market demand shifts in Dallas.
Dallas STR Booking Lead Time Analysis (2026)
Average Booking Lead Time by Month
Booking Lead Time Insights for Dallas
- The overall average booking lead time for vacation rentals in Dallas is 4 days.
- Guests book furthest in advance for stays during January (average 14 days), likely coinciding with peak travel demand or local events.
- The shortest booking windows occur for stays in April (average 0 days), indicating more last-minute travel plans during this time.
- Seasonally, Winter (9 days avg.) sees the longest lead times, while Spring (0 days avg.) has the shortest, reflecting typical travel planning cycles.
Recommendations for Hosts
- Use the overall average lead time (4 days) as a baseline for your pricing and availability strategy in Dallas.
- Target marketing efforts for the Winter season well in advance (at least 9 days) to capture early planners.
- Monitor your own booking lead times against these Dallas averages to identify opportunities for dynamic pricing adjustments.
Popular & Essential Airbnb Amenities in Dallas (2026)
Amenity Prevalence
No amenities with partial availability (less than 100%) were found to display in the chart. All essential amenities might be present in all listings. Check insights below.
Amenity Insights for Dallas
- Essential amenities in Dallas that guests expect include: Freezer, Iron, Body soap, Portable fans, Stove, Dishes and silverware, Heating, Baking sheet, Free street parking, Wifi. Lacking these (any) could significantly impact bookings.
Recommendations for Hosts
- Ensure your listing includes all essential amenities for Dallas: Freezer, Iron, Body soap, Portable fans, Stove, Dishes and silverware, Heating, Baking sheet, Free street parking, Wifi.
- Highlight unique or less common amenities you offer (e.g., hot tub, dedicated workspace, EV charger) in your listing description and photos.
- Regularly check competitor amenities in Dallas to stay competitive.
Dallas Airbnb Guest Demographics & Profile Analysis (2026)
Guest Profile Summary for Dallas
- The typical guest profile for Airbnb in Dallas consists of a mix of domestic (55%) and international guests, often arriving from nearby Melbourne, typically belonging to the Post-2000s (Gen Z/Alpha) group (50%), primarily speaking English or Spanish.
- Domestic travelers account for 54.7% of guests.
- Key international markets include Australia (54.7%) and New Zealand (9.5%).
- Top languages spoken are English (50%) followed by Spanish (6%).
- A significant demographic segment is the Post-2000s (Gen Z/Alpha) group, representing 50% of guests.
Recommendations for Hosts
- Balance marketing efforts between domestic and international channels based on the guest mix.
- Tailor amenities and listing descriptions to appeal to the dominant Post-2000s (Gen Z/Alpha) demographic (e.g., highlight fast WiFi, smart home features, local guides).
- Highlight unique local experiences or amenities relevant to the primary guest profile.
- Consider seasonal promotions aligned with peak travel times for key origin markets.
Nearby Short-Term Rental Market Comparison
How does the Dallas Airbnb market stack up against its neighbors? Compare key performance metrics like average monthly revenue, ADR, and occupancy rates in surrounding areas to understand the broader regional STR landscape.
| Market | Active Properties | Monthly Revenue | Daily Rate | Avg. Occupancy |
|---|---|---|---|---|
| Macedon | 10 | $4,310 | $475.96 | 38% |
| Port Melbourne | 10 | $3,912 | $298.03 | 51% |
| Mount Martha | 15 | $3,621 | $514.62 | 30% |
| Leopold | 12 | $2,959 | $432.77 | 36% |
| Lyonville | 10 | $2,925 | $349.98 | 36% |
| Lancefield | 19 | $2,920 | $219.11 | 39% |
| Daylesford | 444 | $2,889 | $293.59 | 36% |
| Shire of Strathbogie | 38 | $2,866 | $343.39 | 36% |
| Shire of Murrindindi | 76 | $2,833 | $311.08 | 37% |
| Shire of Hepburn | 272 | $2,794 | $309.30 | 36% |