Docklands Airbnb Market Analysis 2026: Short Term Rental Data & Vacation Rental Statistics in Victoria, Australia
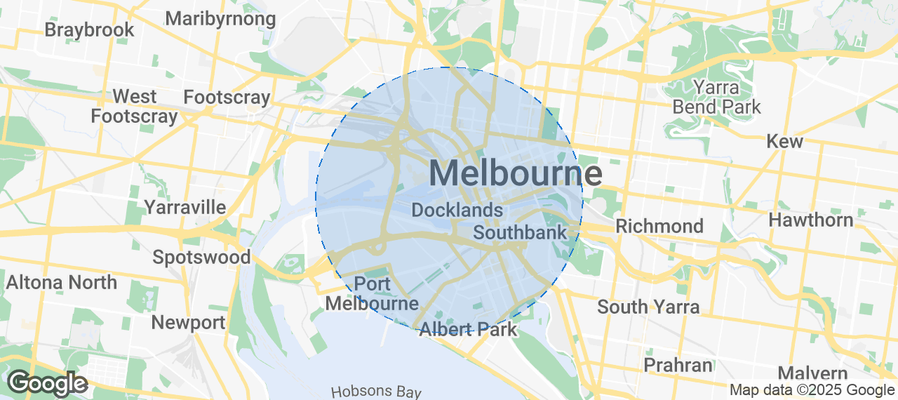
Is Airbnb profitable in Docklands in 2026? Explore comprehensive Airbnb analytics for Docklands, Victoria, Australia to uncover income potential. This 2026 STR market report for Docklands, based on AirROI data from February 2025 to January 2026, reveals key trends in the niche market of 60 active listings.
Whether you're considering an Airbnb investment in Docklands, optimizing your existing vacation rental, or exploring rental arbitrage opportunities, understanding the Docklands Airbnb data is crucial. Leveraging the low regulation environment is key to maximizing your short term rental income potential. Let's dive into the specifics.
Key Docklands Airbnb Performance Metrics Overview
Monthly Airbnb Revenue Variations & Income Potential in Docklands (2026)
Understanding the monthly revenue variations for Airbnb listings in Docklands is key to maximizing your short term rental income potential. Seasonality significantly impacts earnings. Our analysis, based on data from the past 12 months, shows that the peak revenue month for STRs in Docklands is typically December, while May often presents the lowest earnings, highlighting opportunities for strategic pricing adjustments during shoulder and low seasons. Explore the typical Airbnb income in Docklands across different performance tiers:
- Best-in-class properties (Top 10%) achieve $4,612+ monthly, often utilizing dynamic pricing and superior guest experiences.
- Strong performing properties (Top 25%) earn $3,431 or more, indicating effective management and desirable locations/amenities.
- Typical properties (Median) generate around $2,310 per month, representing the average market performance.
- Entry-level properties (Bottom 25%) see earnings around $1,413, often with potential for optimization.
Average Monthly Airbnb Earnings Trend in Docklands
Docklands Airbnb Occupancy Rate Trends (2026)
Maximize your bookings by understanding the Docklands STR occupancy trends. Seasonal demand shifts significantly influence how often properties are booked. Typically, Julysees the highest demand (peak season occupancy), while May experiences the lowest (low season). Effective strategies, like adjusting minimum stays or offering promotions, can boost occupancy during slower periods. Here's how different property tiers perform in Docklands:
- Best-in-class properties (Top 10%) achieve 77%+ occupancy, indicating high desirability and potentially optimized availability.
- Strong performing properties (Top 25%) maintain 66% or higher occupancy, suggesting good market fit and guest satisfaction.
- Typical properties (Median) have an occupancy rate around 49%.
- Entry-level properties (Bottom 25%) average 31% occupancy, potentially facing higher vacancy.
Average Monthly Occupancy Rate Trend in Docklands
Average Daily Rate (ADR) Airbnb Trends in Docklands (2026)
Effective short term rental pricing strategy in Docklands involves understanding monthly ADR fluctuations. The Average Daily Rate (ADR) for Airbnb in Docklands typically peaks in January and dips lowest during July. Leveraging Airbnb dynamic pricing tools or strategies based on this seasonality can significantly boost revenue. Here's a look at the typical nightly rates achieved:
- Best-in-class properties (Top 10%) command rates of $253+ per night, often due to premium features or locations.
- Strong performing properties (Top 25%) achieve nightly rates of $189 or more.
- Typical properties (Median) charge around $151 per night.
- Entry-level properties (Bottom 25%) earn around $119 per night.
Average Daily Rate (ADR) Trend by Month in Docklands
Get Live Docklands Market Intelligence 👇
Explore Real-time Analytics
Airbnb Seasonality Analysis & Trends in Docklands (2026)
Peak Season (December, January, October)
- Revenue averages $3,390 per month
- Occupancy rates average 53.8%
- Daily rates average $215
Shoulder Season
- Revenue averages $2,377 per month
- Occupancy maintains around 45.8%
- Daily rates hold near $172
Low Season (February, March, April)
- Revenue drops to average $0 per month
- Occupancy decreases to average 0.0%
- Daily rates adjust to average $157
Seasonality Insights for Docklands
- The Airbnb seasonality in Docklands shows highly seasonal trends requiring careful strategy. While the sections above show seasonal averages, it's also insightful to look at the extremes:
- During the high season, the absolute peak month showcases Docklands's highest earning potential, with monthly revenues capable of climbing to $3,780, occupancy reaching a high of 60.6%, and ADRs peaking at $217.
- Conversely, the slowest single month of the year, typically falling within the low season, marks the market's lowest point. In this month, revenue might dip to $0, occupancy could drop to 0.0%, and ADRs may adjust down to $144.
- Understanding both the seasonal averages and these monthly peaks and troughs in revenue, occupancy, and ADR is crucial for maximizing your Airbnb profit potential in Docklands.
Seasonal Strategies for Maximizing Profit
- Peak Season: Maximize revenue through premium pricing and potentially longer minimum stays. Ensure high availability.
- Low Season: Offer competitive pricing, special promotions (e.g., extended stay discounts), and flexible cancellation policies. Target off-season travelers like remote workers or budget-conscious guests.
- Shoulder Seasons: Implement dynamic pricing that balances peak and low rates. Target weekend travelers or specific events. Offer slightly more flexible terms than peak season.
- Regularly analyze your own performance against these Docklands seasonality benchmarks and adjust your pricing and availability strategy accordingly.
Best Areas for Airbnb Investment in Docklands (2026)
Exploring the top neighborhoods for short-term rentals in Docklands? This section highlights key areas, outlining why they are attractive for hosts and guests, along with notable local attractions. Consider these locations based on your target guest profile and investment strategy.
| Neighborhood / Area | Why Host Here? (Target Guests & Appeal) | Key Attractions & Landmarks |
|---|---|---|
| Yarra's Edge | A picturesque waterfront community with luxurious amenities and beautiful views. Popular for its proximity to the city and serene environment, making it ideal for short stays. | Docklands Park, Melbourne Star Observation Wheel, Yarra River, MCEC (Melbourne Convention and Exhibition Centre), Jeff's Shed (Melbourne Exhibition Centre) |
| Victoria Harbour | A vibrant area with modern apartments and a focus on lifestyle, attracting both business and leisure travelers. Offers great access to shopping and dining by the water. | Harbour Town Shopping Centre, NewQuay Promenade, The District Docklands, Docklands Waterfront, Bolte Bridge View |
| Southbank | A cultural precinct not far from Docklands known for its arts scene, restaurants, and riverfront. Easily accessible and favored by tourists visiting the city’s attractions. | Arts Centre Melbourne, National Gallery of Victoria, Melbourne Cricket Ground (MCG), Crown Casino, Southbank Promenade |
| Etihad Stadium Area | Home to the Marvel Stadium, this area is bustling during sports events and concerts, making it a great spot for tourists during game seasons. | Marvel Stadium, Docklands Icehouse, Rialto Towers, Southern Cross Station, Harbour Town's dining |
| The District Docklands | An entertainment and shopping hub that attracts locals and tourists alike. Perfect for those looking for a lively stay with easy access to various activities. | The District Docklands shopping and dining, Timezone Docklands, ArtVo Immersive Gallery, DOCKLANDS PARK, Melbourne Star |
| NewQuay | A thriving waterfront area with plenty of dining options and close to scenic views. It’s a prime spot for visitors looking for a vibrant yet relaxing atmosphere. | NewQuay Promenade, The Melbourne Star, Docklands Stadium, Victoria Harbour, Harbour Town |
| Rialto Towers | The Rialto Towers offers a blend of office space and food options, attracting both corporate and leisure travelers looking for a central location. | Rialto Observation Deck, Historic buildings, Dining options in the area, Close to Southern Cross Station, Docklands Cinema |
| Melbourne Convention and Exhibition Centre (MCEC) | Located near the Docklands, this area attracts a lot of event-goers and business travelers seeking accommodations during major conventions and exhibitions. | MCEC, Casino complex nearby, Crown Entertainment Complex, Restaurants and cafes, Public Art displays |
Understanding Airbnb License Requirements & STR Laws in Docklands (2026)
While Docklands, Victoria, Australia currently shows low STR regulations, specific Airbnb license requirements might still exist or change. Always verify the latest short term rental regulations and Airbnb license requirements directly with local government authorities for Docklands to ensure full compliance before hosting.
(Source: AirROI data, 2026, finding no licensed listings among those analyzed)
Top Performing Airbnb Properties in Docklands (2026)
Benchmark your potential! Explore examples of top-performing Airbnb properties in Docklandsbased on Trailing Twelve Month (TTM) revenue. Analyze their characteristics, revenue, occupancy rate, and ADR to understand what drives success in this market.

Sunsets & Bay Views | Spacious 3BR 2BA w Parking
Entire Place • 3 bedrooms

Yarra view| Pool & Free Parking| 1 Min to Tram
Entire Place • 2 bedrooms

Waterfront Apartment
Entire Place • 1 bedroom

CBD 3B2B 270° Skyline Getaway@WSP Hot tub&gym&pool
Entire Place • 3 bedrooms

Paradise Where River Meets Ocean | Free Parking
Entire Place • 2 bedrooms

Steps to Crown Casino / 3Br Pool, Gym & Parking
Entire Place • 3 bedrooms
Note: Performance varies based on location, size, amenities, seasonality, and management quality. Data reflects the past 12 months.
Top Performing Airbnb Hosts in Docklands (2026)
Learn from the best! This table showcases top-performing Airbnb hosts in Docklands based on the number of properties managed and estimated total revenue over the past year. Analyze their scale and performance metrics.
| Host Name | Properties | Grossing Revenue | Stay Reviews | Avg Rating |
|---|---|---|---|---|
| Rest Collection | 3 | $86,608 | 32 | 4.78/5.0 |
| Maria & Sam | 1 | $72,812 | 43 | 5.00/5.0 |
| Penny | 1 | $70,766 | 36 | 4.89/5.0 |
| VShine | 2 | $67,933 | 57 | 4.78/5.0 |
| David | 3 | $55,636 | 23 | 4.98/5.0 |
| Ming & Zhi | 2 | $48,228 | 75 | 4.80/5.0 |
| Victoria | 1 | $46,504 | 13 | 5.00/5.0 |
| Robyn | 2 | $41,778 | 12 | 4.94/5.0 |
| Danny | 2 | $41,055 | 39 | 4.71/5.0 |
| Advante Homes | 2 | $39,031 | 8 | 3.63/5.0 |
Analyzing the strategies of top hosts, such as their property selection, pricing, and guest communication, can offer valuable lessons for optimizing your own Airbnb operations in Docklands.
Dive Deeper: Advanced Docklands STR Market Data (2026)
Ready to unlock more insights? AirROI provides access to advanced metrics and comprehensive Airbnb data for Docklands. Explore detailed analytics beyond this report to refine your investment strategy, optimize pricing, and maximize your vacation rental profits.
Explore Advanced MetricsDocklands Short-Term Rental Market Composition (2026): Property & Room Types
Room Type Distribution
Property Type Distribution
Market Composition Insights for Docklands
- The Docklands Airbnb market composition is heavily skewed towards Entire Home/Apt listings, which make up 95% of the 60 active rentals. This indicates strong guest preference for privacy and space.
- Looking at the property type distribution in Docklands, Apartment/Condo properties are the most common (95%), reflecting the local real estate landscape.
Docklands Airbnb Room Capacity Analysis (2026): Bedroom Distribution
Distribution of Listings by Number of Bedrooms
Room Capacity Insights for Docklands
- The dominant room capacity in Docklands is 2 bedrooms listings, making up 45% of the market. This suggests a strong demand for properties suitable for couples or solo travelers.
- Together, 2 bedrooms and 1 bedroom properties represent 83.3% of the active Airbnb listings in Docklands, indicating a high concentration in these sizes.
Docklands Vacation Rental Guest Capacity Trends (2026)
Distribution of Listings by Guest Capacity
Guest Capacity Insights for Docklands
- The most common guest capacity trend in Docklands vacation rentals is listings accommodating 2 guests (28.3%). This suggests the primary traveler segment is likely couples or solo travelers.
- Properties designed for 2 guests and 4 guests dominate the Docklands STR market, accounting for 53.3% of listings.
- 20.0% of properties accommodate 6+ guests, serving the market segment for larger families or group travel in Docklands.
- On average, properties in Docklands are equipped to host 4.0 guests.
Docklands Airbnb Booking Patterns (2026): Available vs. Booked Days
Available Days Distribution
Booked Days Distribution
Booking Pattern Insights for Docklands
- The most common availability pattern in Docklands falls within the 181-270 days range, representing 46.7% of listings. This suggests many properties have significant open periods on their calendars.
- Approximately 88.4% of listings show high availability (181+ days open annually), indicating potential for increased bookings or specific owner usage patterns.
- For booked days, the 91-180 days range is most frequent in Docklands (48.3%), reflecting common guest stay durations or potential owner blocking patterns.
- A notable 13.3% of properties secure long booking periods (181+ days booked per year), highlighting successful long-term rental strategies or significant owner usage.
Docklands Airbnb Minimum Stay Requirements Analysis
Distribution of Listings by Minimum Night Requirement
1 Night
6 listings
10% of total
2 Nights
9 listings
15% of total
3 Nights
1 listings
1.7% of total
4-6 Nights
1 listings
1.7% of total
7-29 Nights
9 listings
15% of total
30+ Nights
34 listings
56.7% of total
Key Insights
- The most prevalent minimum stay requirement in Docklands is 30+ Nights, adopted by 56.7% of listings. This highlights the market's preference for longer commitments.
- A significant segment (56.7%) caters to monthly stays (30+ nights) in Docklands, pointing to opportunities in the extended-stay market.
Recommendations
- Align with the market by considering a 30+ Nights minimum stay, as 56.7% of Docklands hosts use this setting.
- If feasible, allowing 1-night stays, especially midweek or during low season, could capture last-minute bookings, as only 10% currently do.
- Explore offering discounts for stays of 30+ nights to attract the 56.7% of the market seeking extended stays.
- Adjust minimum nights based on seasonality – potentially shorter during low season and longer during peak demand periods in Docklands.
Docklands Airbnb Cancellation Policy Trends Analysis (2026)
Super Strict 30 Days
1 listings
1.7% of total
Flexible
10 listings
16.7% of total
Moderate
13 listings
21.7% of total
Firm
29 listings
48.3% of total
Strict
7 listings
11.7% of total
Cancellation Policy Insights for Docklands
- The prevailing Airbnb cancellation policy trend in Docklands is Firm, used by 48.3% of listings.
- A majority (60.0%) of hosts in Docklands utilize Firm or Strict policies, indicating a market where hosts prioritize booking security.
Recommendations for Hosts
- Consider adopting a Firm policy to align with the 48.3% market standard in Docklands.
- Using a Strict policy might deter some guests, as only 11.7% of listings use it. Evaluate if potential revenue protection outweighs possible lower booking rates.
- Regularly review your cancellation policy against competitors and market demand shifts in Docklands.
Docklands STR Booking Lead Time Analysis (2026)
Average Booking Lead Time by Month
Booking Lead Time Insights for Docklands
- The overall average booking lead time for vacation rentals in Docklands is 29 days.
- Guests book furthest in advance for stays during October (average 48 days), likely coinciding with peak travel demand or local events.
- The shortest booking windows occur for stays in April (average 0 days), indicating more last-minute travel plans during this time.
- Seasonally, Fall (39 days avg.) sees the longest lead times, while Spring (0 days avg.) has the shortest, reflecting typical travel planning cycles.
Recommendations for Hosts
- Use the overall average lead time (29 days) as a baseline for your pricing and availability strategy in Docklands.
- For October stays, consider implementing length-of-stay discounts or slightly higher rates for bookings made less than 48 days out to capitalize on advance planning.
- During April, focus on last-minute booking availability and promotions, as guests book with very short notice (0 days avg.).
- Target marketing efforts for the Fall season well in advance (at least 39 days) to capture early planners.
- Monitor your own booking lead times against these Docklands averages to identify opportunities for dynamic pricing adjustments.
Popular & Essential Airbnb Amenities in Docklands (2026)
Amenity Prevalence
Amenity Insights for Docklands
- Essential amenities in Docklands that guests expect include: Kitchen, Air conditioning, Wifi, TV. Lacking these (any) could significantly impact bookings.
- Popular amenities like Smoke alarm, Hair dryer, Hot water are common but not universal. Offering these can provide a competitive edge.
Recommendations for Hosts
- Ensure your listing includes all essential amenities for Docklands: Kitchen, Air conditioning, Wifi, TV.
- Prioritize adding missing essentials: Air conditioning, Wifi, TV.
- Consider adding popular differentiators like Smoke alarm or Hair dryer to increase appeal.
- Highlight unique or less common amenities you offer (e.g., hot tub, dedicated workspace, EV charger) in your listing description and photos.
- Regularly check competitor amenities in Docklands to stay competitive.
Docklands Airbnb Guest Demographics & Profile Analysis (2026)
Guest Profile Summary for Docklands
- The typical guest profile for Airbnb in Docklands consists of primarily domestic travelers (71%), often arriving from nearby Melbourne, typically belonging to the Post-2000s (Gen Z/Alpha) group (50%), primarily speaking English or Chinese.
- Domestic travelers account for 71.1% of guests.
- Key international markets include Australia (71.1%) and Singapore (4.3%).
- Top languages spoken are English (56.9%) followed by Chinese (9.9%).
- A significant demographic segment is the Post-2000s (Gen Z/Alpha) group, representing 50% of guests.
Recommendations for Hosts
- Target domestic marketing efforts towards travelers from Melbourne and Adelaide.
- Tailor amenities and listing descriptions to appeal to the dominant Post-2000s (Gen Z/Alpha) demographic (e.g., highlight fast WiFi, smart home features, local guides).
- Highlight unique local experiences or amenities relevant to the primary guest profile.
- Consider seasonal promotions aligned with peak travel times for key origin markets.
Nearby Short-Term Rental Market Comparison
How does the Docklands Airbnb market stack up against its neighbors? Compare key performance metrics like average monthly revenue, ADR, and occupancy rates in surrounding areas to understand the broader regional STR landscape.
| Market | Active Properties | Monthly Revenue | Daily Rate | Avg. Occupancy |
|---|---|---|---|---|
| Macedon | 10 | $4,310 | $475.97 | 38% |
| Port Melbourne | 10 | $3,912 | $298.03 | 51% |
| Mount Martha | 15 | $3,621 | $514.62 | 30% |
| Leopold | 12 | $2,959 | $432.77 | 36% |
| Lyonville | 10 | $2,925 | $349.98 | 36% |
| Lancefield | 19 | $2,920 | $219.11 | 39% |
| Daylesford | 444 | $2,889 | $293.59 | 36% |
| Shire of Strathbogie | 38 | $2,866 | $343.39 | 36% |
| Shire of Murrindindi | 76 | $2,833 | $311.08 | 37% |
| Shire of Hepburn | 272 | $2,794 | $309.30 | 36% |