Foster Airbnb Market Analysis 2025: Short Term Rental Data & Vacation Rental Statistics in Victoria, Australia
Is Airbnb profitable in Foster in 2025? Explore comprehensive Airbnb analytics for Foster, Victoria, Australia to uncover income potential. This 2025 STR market report for Foster, based on AirROI data from October 2024 to September 2025, reveals key trends in the niche market of 17 active listings.
Whether you're considering an Airbnb investment in Foster, optimizing your existing vacation rental, or exploring rental arbitrage opportunities, understanding the Foster Airbnb data is crucial. Leveraging the low regulation environment is key to maximizing your short term rental income potential. Let's dive into the specifics.
Key Foster Airbnb Performance Metrics Overview
Monthly Airbnb Revenue Variations & Income Potential in Foster (2025)
Understanding the monthly revenue variations for Airbnb listings in Foster is key to maximizing your short term rental income potential. Seasonality significantly impacts earnings. Our analysis, based on data from the past 12 months, shows that the peak revenue month for STRs in Foster is typically January, while August often presents the lowest earnings, highlighting opportunities for strategic pricing adjustments during shoulder and low seasons. Explore the typical Airbnb income in Foster across different performance tiers:
- Best-in-class properties (Top 10%) achieve $6,150+ monthly, often utilizing dynamic pricing and superior guest experiences.
- Strong performing properties (Top 25%) earn $3,804 or more, indicating effective management and desirable locations/amenities.
- Typical properties (Median) generate around $2,528 per month, representing the average market performance.
- Entry-level properties (Bottom 25%) see earnings around $1,405, often with potential for optimization.
Average Monthly Airbnb Earnings Trend in Foster
Foster Airbnb Occupancy Rate Trends (2025)
Maximize your bookings by understanding the Foster STR occupancy trends. Seasonal demand shifts significantly influence how often properties are booked. Typically, Januarysees the highest demand (peak season occupancy), while September experiences the lowest (low season). Effective strategies, like adjusting minimum stays or offering promotions, can boost occupancy during slower periods. Here's how different property tiers perform in Foster:
- Best-in-class properties (Top 10%) achieve 70%+ occupancy, indicating high desirability and potentially optimized availability.
- Strong performing properties (Top 25%) maintain 54% or higher occupancy, suggesting good market fit and guest satisfaction.
- Typical properties (Median) have an occupancy rate around 37%.
- Entry-level properties (Bottom 25%) average 23% occupancy, potentially facing higher vacancy.
Average Monthly Occupancy Rate Trend in Foster
Average Daily Rate (ADR) Airbnb Trends in Foster (2025)
Effective short term rental pricing strategy in Foster involves understanding monthly ADR fluctuations. The Average Daily Rate (ADR) for Airbnb in Foster typically peaks in December and dips lowest during August. Leveraging Airbnb dynamic pricing tools or strategies based on this seasonality can significantly boost revenue. Here's a look at the typical nightly rates achieved:
- Best-in-class properties (Top 10%) command rates of $436+ per night, often due to premium features or locations.
- Strong performing properties (Top 25%) achieve nightly rates of $283 or more.
- Typical properties (Median) charge around $215 per night.
- Entry-level properties (Bottom 25%) earn around $147 per night.
Average Daily Rate (ADR) Trend by Month in Foster
Get Live Foster Market Intelligence 👇
Explore Real-time Analytics
Airbnb Seasonality Analysis & Trends in Foster (2025)
Peak Season (January, December, March)
- Revenue averages $4,513 per month
- Occupancy rates average 56.3%
- Daily rates average $252
Shoulder Season
- Revenue averages $2,793 per month
- Occupancy maintains around 38.2%
- Daily rates hold near $243
Low Season (June, August, September)
- Revenue drops to average $1,939 per month
- Occupancy decreases to average 27.6%
- Daily rates adjust to average $228
Seasonality Insights for Foster
- The Airbnb seasonality in Foster shows highly seasonal trends requiring careful strategy. While the sections above show seasonal averages, it's also insightful to look at the extremes:
- During the high season, the absolute peak month showcases Foster's highest earning potential, with monthly revenues capable of climbing to $5,116, occupancy reaching a high of 62.8%, and ADRs peaking at $255.
- Conversely, the slowest single month of the year, typically falling within the low season, marks the market's lowest point. In this month, revenue might dip to $1,715, occupancy could drop to 24.7%, and ADRs may adjust down to $226.
- Understanding both the seasonal averages and these monthly peaks and troughs in revenue, occupancy, and ADR is crucial for maximizing your Airbnb profit potential in Foster.
Seasonal Strategies for Maximizing Profit
- Peak Season: Maximize revenue through premium pricing and potentially longer minimum stays. Ensure high availability.
- Low Season: Offer competitive pricing, special promotions (e.g., extended stay discounts), and flexible cancellation policies. Target off-season travelers like remote workers or budget-conscious guests.
- Shoulder Seasons: Implement dynamic pricing that balances peak and low rates. Target weekend travelers or specific events. Offer slightly more flexible terms than peak season.
- Regularly analyze your own performance against these Foster seasonality benchmarks and adjust your pricing and availability strategy accordingly.
Best Areas for Airbnb Investment in Foster (2025)
Exploring the top neighborhoods for short-term rentals in Foster? This section highlights key areas, outlining why they are attractive for hosts and guests, along with notable local attractions. Consider these locations based on your target guest profile and investment strategy.
| Neighborhood / Area | Why Host Here? (Target Guests & Appeal) | Key Attractions & Landmarks |
|---|---|---|
| Foster Beach | A picturesque beach area known for its stunning natural beauty. Ideal for tourists seeking relaxation and outdoor activities like swimming, fishing, and hiking. | Foster Beach, Waratah Bay, Port Franklin, Bayside Boardwalk, Promontory National Park |
| Foster Town Centre | The heart of Foster offering local shops, restaurants, and essential services. Convenient for guests looking for amenities and a local vibe. | Foster Market, Foster History Walk, Local cafes, Art galleries, Community events |
| Wilsons Promontory | A major natural attraction near Foster providing breathtaking landscapes and wildlife. It's perfect for nature lovers and travelers looking for adventure. | Wilsons Promontory National Park, Squeaky Beach, Lilly Pilly Gully, Tidal River, Sandy Point |
| Foster Art and Craft Centre | A cultural hub in Foster that showcases local artisans and crafts, appealing to visitors interested in arts and crafts experiences. | Foster Art and Craft Centre, Local art exhibitions, Craft workshops, Artisan markets |
| Lake Foster | A tranquil spot for relaxation and bird watching, popular among nature enthusiasts and families looking for a peaceful getaway. | Lake Foster, Picnic areas, Walking trails, Bird watching spots |
| Glenmaggie | A nearby area with a large dam and recreational activities. Attractive for guests interested in boating, fishing, and water sports. | Glenmaggie Reservoir, Fishing spots, Camping areas, Water sports activities |
| Shallow Inlet | A serene inlet perfect for watersports and beachcombing. Draws visitors looking for a quiet seaside experience away from busier areas. | Shallow Inlet Beach, Kayaking, Fishing, Bird watching |
| Meeniyan | Charming township close to Foster with cafes and boutique shops. Ideal for visitors wishing to explore the local community vibe and support small businesses. | Meeniyan Hall, Local shops, Cafes and restaurants, Annual festivals |
Understanding Airbnb License Requirements & STR Laws in Foster (2025)
While Foster, Victoria, Australia currently shows low STR regulations, specific Airbnb license requirements might still exist or change. Always verify the latest short term rental regulations and Airbnb license requirements directly with local government authorities for Foster to ensure full compliance before hosting.
(Source: AirROI data, 2025, finding no licensed listings among those analyzed)
Top Performing Airbnb Properties in Foster (2025)
Benchmark your potential! Explore examples of top-performing Airbnb properties in Fosterbased on Trailing Twelve Month (TTM) revenue. Analyze their characteristics, revenue, occupancy rate, and ADR to understand what drives success in this market.
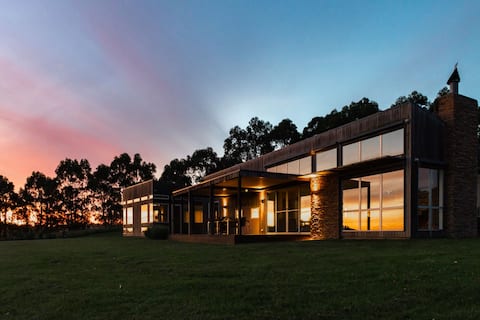
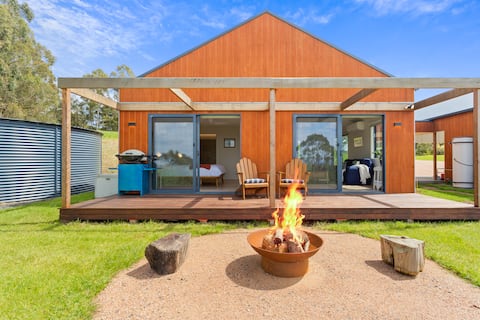
Tall Trees Country Escape
Entire Place • 4 bedrooms
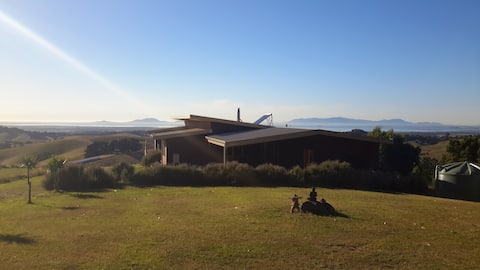
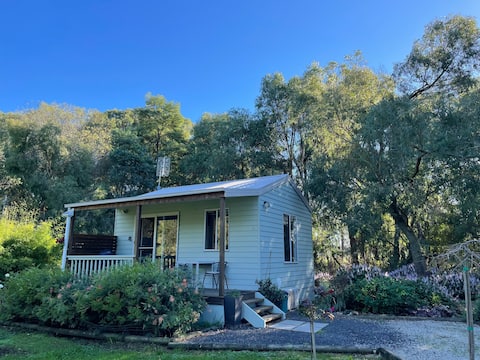
Odiyana Retreat and Farm Stay. Magical Prom Views
Entire Place • 5 bedrooms
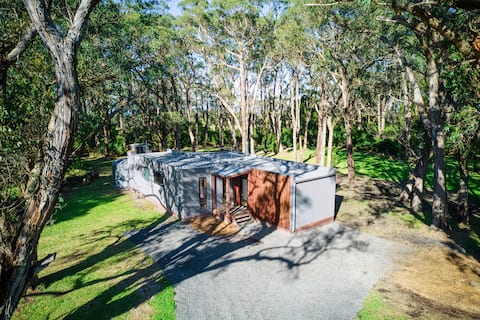
Emerald House
Entire Place • 3 bedrooms

Woodland Mirth Luxury near Wilsons Prom / Foster
Entire Place • 4 bedrooms
Eagles Nest
Entire Place • 1 bedroom
Tindoona Cottages - Studio Cottage
Entire Place • 1 bedroom
Note: Performance varies based on location, size, amenities, seasonality, and management quality. Data reflects the past 12 months.
Top Performing Airbnb Hosts in Foster (2025)
Learn from the best! This table showcases top-performing Airbnb hosts in Foster based on the number of properties managed and estimated total revenue over the past year. Analyze their scale and performance metrics.
| Host Name | Properties | Grossing Revenue | Stay Reviews | Avg Rating |
|---|---|---|---|---|
| Getaway PM | 1 | $73,836 | 47 | 4.94/5.0 |
| David | 1 | $63,509 | 187 | 4.87/5.0 |
| Mitchell | 2 | $54,326 | 109 | 5.00/5.0 |
| Jane | 1 | $52,075 | 21 | 4.81/5.0 |
| Lisa | 1 | $38,707 | 133 | 4.89/5.0 |
| Sallie | 1 | $32,144 | 71 | 4.94/5.0 |
| Tristan | 1 | $29,834 | 36 | 4.86/5.0 |
| Prom Coast Holidays | 1 | $29,272 | 4 | 4.75/5.0 |
| Stephanie | 1 | $27,325 | 52 | 4.87/5.0 |
| Lori | 1 | $26,789 | 16 | 4.88/5.0 |
Analyzing the strategies of top hosts, such as their property selection, pricing, and guest communication, can offer valuable lessons for optimizing your own Airbnb operations in Foster.
Dive Deeper: Advanced Foster STR Market Data (2025)
Ready to unlock more insights? AirROI provides access to advanced metrics and comprehensive Airbnb data for Foster. Explore detailed analytics beyond this report to refine your investment strategy, optimize pricing, and maximize your vacation rental profits.
Explore Advanced MetricsFoster Short-Term Rental Market Composition (2025): Property & Room Types
Room Type Distribution
Property Type Distribution
Market Composition Insights for Foster
- The Foster Airbnb market composition is heavily skewed towards Entire Home/Apt listings, which make up 100% of the 17 active rentals. This indicates strong guest preference for privacy and space.
- Looking at the property type distribution in Foster, House properties are the most common (70.6%), reflecting the local real estate landscape.
- Houses represent a significant 70.6% portion, catering likely to families or larger groups.
- The presence of 5.9% Hotel/Boutique listings indicates integration with traditional hospitality.
Foster Airbnb Room Capacity Analysis (2025): Bedroom Distribution
Distribution of Listings by Number of Bedrooms
Room Capacity Insights for Foster
- The dominant room capacity in Foster is 3 bedrooms listings, making up 29.4% of the market. This suggests a strong demand for properties suitable for families or small groups.
- Together, 3 bedrooms and 2 bedrooms properties represent 52.9% of the active Airbnb listings in Foster, indicating a high concentration in these sizes.
- A significant 52.9% of listings offer 3+ bedrooms, catering to larger groups and families seeking more space in Foster.
Foster Vacation Rental Guest Capacity Trends (2025)
Distribution of Listings by Guest Capacity
Guest Capacity Insights for Foster
- The most common guest capacity trend in Foster vacation rentals is listings accommodating 8+ guests (29.4%). This suggests the primary traveler segment is likely larger groups.
- Properties designed for 8+ guests and 4 guests dominate the Foster STR market, accounting for 47.0% of listings.
- 53.0% of properties accommodate 6+ guests, serving the market segment for larger families or group travel in Foster.
- On average, properties in Foster are equipped to host 5.6 guests.
Foster Airbnb Booking Patterns (2025): Available vs. Booked Days
Available Days Distribution
Booked Days Distribution
Booking Pattern Insights for Foster
- The most common availability pattern in Foster falls within the 181-270 days range, representing 58.8% of listings. This suggests many properties have significant open periods on their calendars.
- Approximately 82.3% of listings show high availability (181+ days open annually), indicating potential for increased bookings or specific owner usage patterns.
- For booked days, the 91-180 days range is most frequent in Foster (52.9%), reflecting common guest stay durations or potential owner blocking patterns.
- A notable 23.5% of properties secure long booking periods (181+ days booked per year), highlighting successful long-term rental strategies or significant owner usage.
Foster Airbnb Minimum Stay Requirements Analysis
Distribution of Listings by Minimum Night Requirement
2 Nights
8 listings
47.1% of total
4-6 Nights
1 listings
5.9% of total
30+ Nights
8 listings
47.1% of total
Key Insights
- The most prevalent minimum stay requirement in Foster is 2 Nights, adopted by 47.1% of listings. This highlights the market's preference for shorter, flexible bookings.
- A significant segment (47.1%) caters to monthly stays (30+ nights) in Foster, pointing to opportunities in the extended-stay market.
Recommendations
- Align with the market by considering a 2 Nights minimum stay, as 47.1% of Foster hosts use this setting.
- A 2-night minimum appears standard (47.1%). Consider this for weekends or peak periods.
- Explore offering discounts for stays of 30+ nights to attract the 47.1% of the market seeking extended stays.
- Adjust minimum nights based on seasonality – potentially shorter during low season and longer during peak demand periods in Foster.
Foster Airbnb Cancellation Policy Trends Analysis (2025)
Super Strict 60 Days
2 listings
11.8% of total
Super Strict 30 Days
1 listings
5.9% of total
Flexible
1 listings
5.9% of total
Moderate
8 listings
47.1% of total
Firm
1 listings
5.9% of total
Strict
4 listings
23.5% of total
Cancellation Policy Insights for Foster
- The prevailing Airbnb cancellation policy trend in Foster is Moderate, used by 47.1% of listings.
- There's a relatively balanced mix between guest-friendly (53.0%) and stricter (29.4%) policies, offering choices for different guest needs.
Recommendations for Hosts
- Consider adopting a Moderate policy to align with the 47.1% market standard in Foster.
- Regularly review your cancellation policy against competitors and market demand shifts in Foster.
Foster STR Booking Lead Time Analysis (2025)
Average Booking Lead Time by Month
Booking Lead Time Insights for Foster
- The overall average booking lead time for vacation rentals in Foster is 53 days.
- Guests book furthest in advance for stays during November (average 81 days), likely coinciding with peak travel demand or local events.
- The shortest booking windows occur for stays in July (average 16 days), indicating more last-minute travel plans during this time.
- Seasonally, Fall (62 days avg.) sees the longest lead times, while Summer (42 days avg.) has the shortest, reflecting typical travel planning cycles.
Recommendations for Hosts
- Use the overall average lead time (53 days) as a baseline for your pricing and availability strategy in Foster.
- For November stays, consider implementing length-of-stay discounts or slightly higher rates for bookings made less than 81 days out to capitalize on advance planning.
- Target marketing efforts for the Fall season well in advance (at least 62 days) to capture early planners.
- Monitor your own booking lead times against these Foster averages to identify opportunities for dynamic pricing adjustments.
Popular & Essential Airbnb Amenities in Foster (2025)
Amenity Prevalence
Amenity Insights for Foster
- Essential amenities in Foster that guests expect include: Refrigerator, Kitchen. Lacking these (any) could significantly impact bookings.
- Popular amenities like Stove, TV, BBQ grill are common but not universal. Offering these can provide a competitive edge.
Recommendations for Hosts
- Ensure your listing includes all essential amenities for Foster: Refrigerator, Kitchen.
- Consider adding popular differentiators like Stove or TV to increase appeal.
- Highlight unique or less common amenities you offer (e.g., hot tub, dedicated workspace, EV charger) in your listing description and photos.
- Regularly check competitor amenities in Foster to stay competitive.
Foster Airbnb Guest Demographics & Profile Analysis (2025)
Guest Profile Summary for Foster
- The typical guest profile for Airbnb in Foster consists of primarily domestic travelers (80%), often arriving from nearby Melbourne, typically belonging to the Post-2000s (Gen Z/Alpha) group (50%), primarily speaking English or Spanish.
- Domestic travelers account for 80.3% of guests.
- Key international markets include Australia (80.3%) and United Kingdom (6.6%).
- Top languages spoken are English (64.1%) followed by Spanish (9%).
- A significant demographic segment is the Post-2000s (Gen Z/Alpha) group, representing 50% of guests.
Recommendations for Hosts
- Target domestic marketing efforts towards travelers from Melbourne and Victoria.
- Tailor amenities and listing descriptions to appeal to the dominant Post-2000s (Gen Z/Alpha) demographic (e.g., highlight fast WiFi, smart home features, local guides).
- Highlight unique local experiences or amenities relevant to the primary guest profile.
- Consider seasonal promotions aligned with peak travel times for key origin markets.
Nearby Short-Term Rental Market Comparison
How does the Foster Airbnb market stack up against its neighbors? Compare key performance metrics like average monthly revenue, ADR, and occupancy rates in surrounding areas to understand the broader regional STR landscape.
| Market | Active Properties | Monthly Revenue | Daily Rate | Avg. Occupancy |
|---|---|---|---|---|
| Kinglake | 14 | $3,110 | $269.62 | 43% |
| Shire of Murrindindi | 80 | $2,999 | $302.11 | 39% |
| Shire of Mansfield | 93 | $2,980 | $380.12 | 34% |
| Yanakie | 17 | $2,919 | $224.44 | 53% |
| Jamieson | 36 | $2,739 | $284.21 | 35% |
| Mansfield | 132 | $2,730 | $313.58 | 34% |
| Bonnie Doon | 23 | $2,723 | $417.15 | 28% |
| Smiths Beach | 87 | $2,679 | $295.94 | 36% |
| Walkerville | 15 | $2,610 | $271.47 | 38% |
| Sawmill Settlement | 87 | $2,536 | $411.84 | 29% |