Korumburra Airbnb Market Analysis 2026: Short Term Rental Data & Vacation Rental Statistics in Victoria, Australia
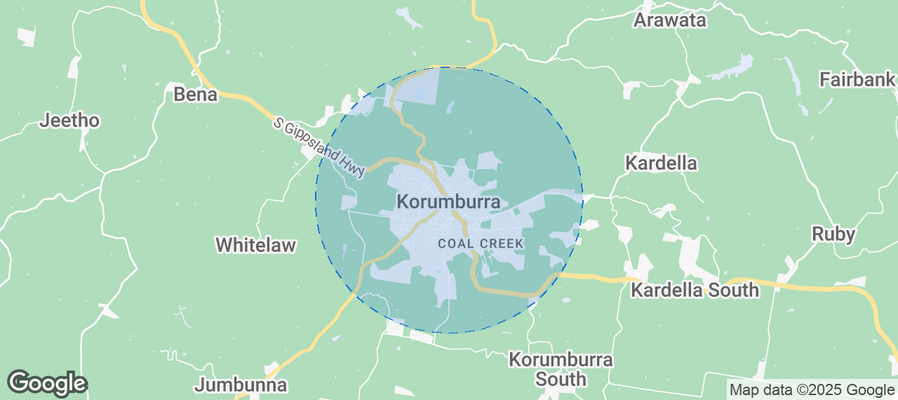
Is Airbnb profitable in Korumburra in 2026? Explore comprehensive Airbnb analytics for Korumburra, Victoria, Australia to uncover income potential. This 2026 STR market report for Korumburra, based on AirROI data from February 2025 to January 2026, reveals key trends in the niche market of 19 active listings.
Whether you're considering an Airbnb investment in Korumburra, optimizing your existing vacation rental, or exploring rental arbitrage opportunities, understanding the Korumburra Airbnb data is crucial. Leveraging the low regulation environment is key to maximizing your short term rental income potential. Let's dive into the specifics.
Key Korumburra Airbnb Performance Metrics Overview
Monthly Airbnb Revenue Variations & Income Potential in Korumburra (2026)
Understanding the monthly revenue variations for Airbnb listings in Korumburra is key to maximizing your short term rental income potential. Seasonality significantly impacts earnings. Our analysis, based on data from the past 12 months, shows that the peak revenue month for STRs in Korumburra is typically August, while September often presents the lowest earnings, highlighting opportunities for strategic pricing adjustments during shoulder and low seasons. Explore the typical Airbnb income in Korumburra across different performance tiers:
- Best-in-class properties (Top 10%) achieve $3,868+ monthly, often utilizing dynamic pricing and superior guest experiences.
- Strong performing properties (Top 25%) earn $3,014 or more, indicating effective management and desirable locations/amenities.
- Typical properties (Median) generate around $1,993 per month, representing the average market performance.
- Entry-level properties (Bottom 25%) see earnings around $1,055, often with potential for optimization.
Average Monthly Airbnb Earnings Trend in Korumburra
Korumburra Airbnb Occupancy Rate Trends (2026)
Maximize your bookings by understanding the Korumburra STR occupancy trends. Seasonal demand shifts significantly influence how often properties are booked. Typically, Aprilsees the highest demand (peak season occupancy), while September experiences the lowest (low season). Effective strategies, like adjusting minimum stays or offering promotions, can boost occupancy during slower periods. Here's how different property tiers perform in Korumburra:
- Best-in-class properties (Top 10%) achieve 80%+ occupancy, indicating high desirability and potentially optimized availability.
- Strong performing properties (Top 25%) maintain 66% or higher occupancy, suggesting good market fit and guest satisfaction.
- Typical properties (Median) have an occupancy rate around 45%.
- Entry-level properties (Bottom 25%) average 23% occupancy, potentially facing higher vacancy.
Average Monthly Occupancy Rate Trend in Korumburra
Average Daily Rate (ADR) Airbnb Trends in Korumburra (2026)
Effective short term rental pricing strategy in Korumburra involves understanding monthly ADR fluctuations. The Average Daily Rate (ADR) for Airbnb in Korumburra typically peaks in July and dips lowest during March. Leveraging Airbnb dynamic pricing tools or strategies based on this seasonality can significantly boost revenue. Here's a look at the typical nightly rates achieved:
- Best-in-class properties (Top 10%) command rates of $217+ per night, often due to premium features or locations.
- Strong performing properties (Top 25%) achieve nightly rates of $180 or more.
- Typical properties (Median) charge around $141 per night.
- Entry-level properties (Bottom 25%) earn around $99 per night.
Average Daily Rate (ADR) Trend by Month in Korumburra
Get Live Korumburra Market Intelligence 👇
Explore Real-time Analytics
Airbnb Seasonality Analysis & Trends in Korumburra (2026)
Peak Season (August, July, December)
- Revenue averages $2,548 per month
- Occupancy rates average 47.1%
- Daily rates average $161
Shoulder Season
- Revenue averages $2,222 per month
- Occupancy maintains around 47.9%
- Daily rates hold near $156
Low Season (May, September, October)
- Revenue drops to average $1,741 per month
- Occupancy decreases to average 41.4%
- Daily rates adjust to average $158
Seasonality Insights for Korumburra
- The Airbnb seasonality in Korumburra shows moderate seasonality with distinct peak and low periods. While the sections above show seasonal averages, it's also insightful to look at the extremes:
- During the high season, the absolute peak month showcases Korumburra's highest earning potential, with monthly revenues capable of climbing to $2,602, occupancy reaching a high of 51.7%, and ADRs peaking at $165.
- Conversely, the slowest single month of the year, typically falling within the low season, marks the market's lowest point. In this month, revenue might dip to $1,610, occupancy could drop to 39.3%, and ADRs may adjust down to $151.
- Understanding both the seasonal averages and these monthly peaks and troughs in revenue, occupancy, and ADR is crucial for maximizing your Airbnb profit potential in Korumburra.
Seasonal Strategies for Maximizing Profit
- Peak Season: Maximize revenue through premium pricing and potentially longer minimum stays. Ensure high availability.
- Low Season: Offer competitive pricing, special promotions (e.g., extended stay discounts), and flexible cancellation policies. Target off-season travelers like remote workers or budget-conscious guests.
- Shoulder Seasons: Implement dynamic pricing that balances peak and low rates. Target weekend travelers or specific events. Offer slightly more flexible terms than peak season.
- Regularly analyze your own performance against these Korumburra seasonality benchmarks and adjust your pricing and availability strategy accordingly.
Best Areas for Airbnb Investment in Korumburra (2026)
Exploring the top neighborhoods for short-term rentals in Korumburra? This section highlights key areas, outlining why they are attractive for hosts and guests, along with notable local attractions. Consider these locations based on your target guest profile and investment strategy.
| Neighborhood / Area | Why Host Here? (Target Guests & Appeal) | Key Attractions & Landmarks |
|---|---|---|
| Korumburra CBD | The central business district of Korumburra, it offers proximity to shops, cafes, and services. Attractive for visitors looking for convenience and local culture. | Korumburra's Memorial Park, Burra Brewery, Korumburra's Historical Museum, local shops and cafes |
| Coal Creek | A popular tourist attraction featuring a recreated 19th-century township. Ideal for those looking to experience Victoria's gold mining history. | Coal Creek Community Park and Museum, Scenic walking trails, Historic buildings and exhibits, Picnic areas |
| Korumburra Botanical Gardens | A beautiful garden area great for relaxation and picnics. Draws visitors looking to enjoy nature and local flora. | Botanical gardens, Walking paths, Native plant displays, Gardening workshops |
| St. Joseph's Church | An architecturally stunning church that draws visitors both for its beauty and its significance, situated in a peaceful setting perfect for quiet retreats. | Historical architecture, Church services, Community events |
| Korumburra Community Centre | A hub for local events and activities. Hosts several community-led activities which can attract visitors looking for local interaction. | Workshops, Local art shows, Community events |
| Surrounding Farms and Vineyards | The scenic countryside surrounding Korumburra is home to wineries and farms, appealing to guests interested in agritourism. | Wineries, Farm tours, Cheese tasting, Scenic views |
| Local Markets | Korumburra hosts several local markets showcasing handmade goods and local produce, attracting visitors interested in unique shopping experiences. | Korumburra Farmers Market, Craft markets, Live music |
| Great Southern Rail Trail | A beautiful rail trail that offers bike and walking access to the surrounding areas, attracting outdoor enthusiasts. | Biking trails, Walking paths, Scenic landscapes |
Understanding Airbnb License Requirements & STR Laws in Korumburra (2026)
While Korumburra, Victoria, Australia currently shows low STR regulations, specific Airbnb license requirements might still exist or change. Always verify the latest short term rental regulations and Airbnb license requirements directly with local government authorities for Korumburra to ensure full compliance before hosting.
(Source: AirROI data, 2026, finding no licensed listings among those analyzed)
Top Performing Airbnb Properties in Korumburra (2026)
Benchmark your potential! Explore examples of top-performing Airbnb properties in Korumburrabased on Trailing Twelve Month (TTM) revenue. Analyze their characteristics, revenue, occupancy rate, and ADR to understand what drives success in this market.

Lush rural retreat
Entire Place • 4 bedrooms

Settlers Cottage at Korumburra
Entire Place • 1 bedroom
Korumburra Farmhouse
Entire Place • 3 bedrooms

South Gippsland Farm Stay - Barcoo Studio
Entire Place • 1 bedroom

Citrus Grove: private/ modern/dog-friendly/acreage
Entire Place • 3 bedrooms

Centella House
Entire Place • 4 bedrooms
Note: Performance varies based on location, size, amenities, seasonality, and management quality. Data reflects the past 12 months.
Top Performing Airbnb Hosts in Korumburra (2026)
Learn from the best! This table showcases top-performing Airbnb hosts in Korumburra based on the number of properties managed and estimated total revenue over the past year. Analyze their scale and performance metrics.
| Host Name | Properties | Grossing Revenue | Stay Reviews | Avg Rating |
|---|---|---|---|---|
| Sean | 1 | $47,241 | 17 | 4.88/5.0 |
| Carmel | 1 | $45,633 | 111 | 4.99/5.0 |
| Jody | 1 | $36,232 | 82 | 4.95/5.0 |
| Lauren | 1 | $31,901 | 60 | 4.97/5.0 |
| Linda | 1 | $30,439 | 113 | 4.91/5.0 |
| Sarah | 1 | $30,336 | 24 | 5.00/5.0 |
| Jamie | 1 | $30,239 | 246 | 4.90/5.0 |
| Sue | 1 | $29,496 | 80 | 4.93/5.0 |
| Georgia | 1 | $28,001 | 105 | 4.93/5.0 |
| Emily | 1 | $27,127 | 79 | 4.99/5.0 |
Analyzing the strategies of top hosts, such as their property selection, pricing, and guest communication, can offer valuable lessons for optimizing your own Airbnb operations in Korumburra.
Dive Deeper: Advanced Korumburra STR Market Data (2026)
Ready to unlock more insights? AirROI provides access to advanced metrics and comprehensive Airbnb data for Korumburra. Explore detailed analytics beyond this report to refine your investment strategy, optimize pricing, and maximize your vacation rental profits.
Explore Advanced MetricsKorumburra Short-Term Rental Market Composition (2026): Property & Room Types
Room Type Distribution
Property Type Distribution
Market Composition Insights for Korumburra
- The Korumburra Airbnb market composition is heavily skewed towards Entire Home/Apt listings, which make up 84.2% of the 19 active rentals. This indicates strong guest preference for privacy and space.
- Looking at the property type distribution in Korumburra, House properties are the most common (57.9%), reflecting the local real estate landscape.
- Houses represent a significant 57.9% portion, catering likely to families or larger groups.
- The presence of 15.8% Hotel/Boutique listings indicates integration with traditional hospitality.
Korumburra Airbnb Room Capacity Analysis (2026): Bedroom Distribution
Distribution of Listings by Number of Bedrooms
Room Capacity Insights for Korumburra
- The dominant room capacity in Korumburra is 2 bedrooms listings, making up 26.3% of the market. This suggests a strong demand for properties suitable for couples or solo travelers.
- Together, 2 bedrooms and 3 bedrooms properties represent 52.6% of the active Airbnb listings in Korumburra, indicating a high concentration in these sizes.
- A significant 36.8% of listings offer 3+ bedrooms, catering to larger groups and families seeking more space in Korumburra.
Korumburra Vacation Rental Guest Capacity Trends (2026)
Distribution of Listings by Guest Capacity
Guest Capacity Insights for Korumburra
- The most common guest capacity trend in Korumburra vacation rentals is listings accommodating 4 guests (21.1%). This suggests the primary traveler segment is likely small families or groups.
- Properties designed for 4 guests and 6 guests dominate the Korumburra STR market, accounting for 36.9% of listings.
- 36.8% of properties accommodate 6+ guests, serving the market segment for larger families or group travel in Korumburra.
- On average, properties in Korumburra are equipped to host 4.0 guests.
Korumburra Airbnb Booking Patterns (2026): Available vs. Booked Days
Available Days Distribution
Booked Days Distribution
Booking Pattern Insights for Korumburra
- The most common availability pattern in Korumburra falls within the 181-270 days range, representing 36.8% of listings. This suggests many properties have significant open periods on their calendars.
- Approximately 57.9% of listings show high availability (181+ days open annually), indicating potential for increased bookings or specific owner usage patterns.
- For booked days, the 91-180 days range is most frequent in Korumburra (36.8%), reflecting common guest stay durations or potential owner blocking patterns.
- A notable 42.1% of properties secure long booking periods (181+ days booked per year), highlighting successful long-term rental strategies or significant owner usage.
Korumburra Airbnb Minimum Stay Requirements Analysis
Distribution of Listings by Minimum Night Requirement
1 Night
10 listings
52.6% of total
2 Nights
6 listings
31.6% of total
30+ Nights
3 listings
15.8% of total
Key Insights
- The most prevalent minimum stay requirement in Korumburra is 1 Night, adopted by 52.6% of listings. This highlights the market's preference for shorter, flexible bookings.
- A strong majority (84.2%) of the Korumburra Airbnb data shows acceptance of very short stays (1-2 nights), indicating a dynamic, high-turnover market.
- A significant segment (15.8%) caters to monthly stays (30+ nights) in Korumburra, pointing to opportunities in the extended-stay market.
Recommendations
- Align with the market by considering a 1 Night minimum stay, as 52.6% of Korumburra hosts use this setting.
- Explore offering discounts for stays of 30+ nights to attract the 15.8% of the market seeking extended stays.
- Adjust minimum nights based on seasonality – potentially shorter during low season and longer during peak demand periods in Korumburra.
Korumburra Airbnb Cancellation Policy Trends Analysis (2026)
Limited
2 listings
10.5% of total
Super Strict 30 Days
1 listings
5.3% of total
Flexible
6 listings
31.6% of total
Moderate
7 listings
36.8% of total
Firm
2 listings
10.5% of total
Strict
1 listings
5.3% of total
Cancellation Policy Insights for Korumburra
- The prevailing Airbnb cancellation policy trend in Korumburra is Moderate, used by 36.8% of listings.
- There's a relatively balanced mix between guest-friendly (68.4%) and stricter (15.8%) policies, offering choices for different guest needs.
- Strict cancellation policies are quite rare (5.3%), potentially making listings with this policy less competitive unless justified by high demand or property type.
Recommendations for Hosts
- Consider adopting a Moderate policy to align with the 36.8% market standard in Korumburra.
- Using a Strict policy might deter some guests, as only 5.3% of listings use it. Evaluate if potential revenue protection outweighs possible lower booking rates.
- Regularly review your cancellation policy against competitors and market demand shifts in Korumburra.
Korumburra STR Booking Lead Time Analysis (2026)
Average Booking Lead Time by Month
Booking Lead Time Insights for Korumburra
- The overall average booking lead time for vacation rentals in Korumburra is 41 days.
- Guests book furthest in advance for stays during February (average 62 days), likely coinciding with peak travel demand or local events.
- The shortest booking windows occur for stays in May (average 18 days), indicating more last-minute travel plans during this time.
- Seasonally, Winter (55 days avg.) sees the longest lead times, while Summer (25 days avg.) has the shortest, reflecting typical travel planning cycles.
Recommendations for Hosts
- Use the overall average lead time (41 days) as a baseline for your pricing and availability strategy in Korumburra.
- For February stays, consider implementing length-of-stay discounts or slightly higher rates for bookings made less than 62 days out to capitalize on advance planning.
- Target marketing efforts for the Winter season well in advance (at least 55 days) to capture early planners.
- Monitor your own booking lead times against these Korumburra averages to identify opportunities for dynamic pricing adjustments.
Popular & Essential Airbnb Amenities in Korumburra (2026)
Amenity Prevalence
Amenity Insights for Korumburra
- Essential amenities in Korumburra that guests expect include: TV, Smoke alarm, Hot water. Lacking these (any) could significantly impact bookings.
- Popular amenities like Wifi, Bed linens, Microwave are common but not universal. Offering these can provide a competitive edge.
- Warning: Wifi is not universally provided but is considered essential globally. Ensure reliable Wifi is offered.
Recommendations for Hosts
- Ensure your listing includes all essential amenities for Korumburra: TV, Smoke alarm, Hot water.
- Consider adding popular differentiators like Wifi or Bed linens to increase appeal.
- Highlight unique or less common amenities you offer (e.g., hot tub, dedicated workspace, EV charger) in your listing description and photos.
- Regularly check competitor amenities in Korumburra to stay competitive.
Korumburra Airbnb Guest Demographics & Profile Analysis (2026)
Guest Profile Summary for Korumburra
- The typical guest profile for Airbnb in Korumburra consists of primarily domestic travelers (91%), often arriving from nearby Melbourne, typically belonging to the Post-2000s (Gen Z/Alpha) group (50%), primarily speaking English or Chinese.
- Domestic travelers account for 91.1% of guests.
- Key international markets include Australia (91.1%) and United Kingdom (3.9%).
- Top languages spoken are English (76.8%) followed by Chinese (4.2%).
- A significant demographic segment is the Post-2000s (Gen Z/Alpha) group, representing 50% of guests.
Recommendations for Hosts
- Target domestic marketing efforts towards travelers from Melbourne and Victoria.
- Tailor amenities and listing descriptions to appeal to the dominant Post-2000s (Gen Z/Alpha) demographic (e.g., highlight fast WiFi, smart home features, local guides).
- Highlight unique local experiences or amenities relevant to the primary guest profile.
- Consider seasonal promotions aligned with peak travel times for key origin markets.
Nearby Short-Term Rental Market Comparison
How does the Korumburra Airbnb market stack up against its neighbors? Compare key performance metrics like average monthly revenue, ADR, and occupancy rates in surrounding areas to understand the broader regional STR landscape.
| Market | Active Properties | Monthly Revenue | Daily Rate | Avg. Occupancy |
|---|---|---|---|---|
| Macedon | 10 | $4,310 | $475.97 | 38% |
| Port Melbourne | 10 | $3,912 | $298.03 | 51% |
| Mount Martha | 15 | $3,621 | $514.62 | 30% |
| Leopold | 12 | $2,959 | $432.77 | 36% |
| Lyonville | 10 | $2,925 | $349.98 | 36% |
| Lancefield | 19 | $2,920 | $219.11 | 39% |
| Shire of Mansfield | 84 | $2,896 | $372.92 | 32% |
| Daylesford | 444 | $2,889 | $293.59 | 36% |
| Yanakie | 17 | $2,882 | $227.69 | 47% |
| Shire of Murrindindi | 76 | $2,833 | $311.08 | 37% |