Port Welshpool Airbnb Market Analysis 2026: Short Term Rental Data & Vacation Rental Statistics in Victoria, Australia
Is Airbnb profitable in Port Welshpool in 2026? Explore comprehensive Airbnb analytics for Port Welshpool, Victoria, Australia to uncover income potential. This 2026 STR market report for Port Welshpool, based on AirROI data from February 2025 to January 2026, reveals key trends in the niche market of 19 active listings.
Whether you're considering an Airbnb investment in Port Welshpool, optimizing your existing vacation rental, or exploring rental arbitrage opportunities, understanding the Port Welshpool Airbnb data is crucial. Leveraging the low regulation environment is key to maximizing your short term rental income potential. Let's dive into the specifics.
Key Port Welshpool Airbnb Performance Metrics Overview
Monthly Airbnb Revenue Variations & Income Potential in Port Welshpool (2026)
Understanding the monthly revenue variations for Airbnb listings in Port Welshpool is key to maximizing your short term rental income potential. Seasonality significantly impacts earnings. Our analysis, based on data from the past 12 months, shows that the peak revenue month for STRs in Port Welshpool is typically April, while August often presents the lowest earnings, highlighting opportunities for strategic pricing adjustments during shoulder and low seasons. Explore the typical Airbnb income in Port Welshpool across different performance tiers:
- Best-in-class properties (Top 10%) achieve $3,702+ monthly, often utilizing dynamic pricing and superior guest experiences.
- Strong performing properties (Top 25%) earn $2,522 or more, indicating effective management and desirable locations/amenities.
- Typical properties (Median) generate around $1,497 per month, representing the average market performance.
- Entry-level properties (Bottom 25%) see earnings around $854, often with potential for optimization.
Average Monthly Airbnb Earnings Trend in Port Welshpool
Port Welshpool Airbnb Occupancy Rate Trends (2026)
Maximize your bookings by understanding the Port Welshpool STR occupancy trends. Seasonal demand shifts significantly influence how often properties are booked. Typically, Aprilsees the highest demand (peak season occupancy), while August experiences the lowest (low season). Effective strategies, like adjusting minimum stays or offering promotions, can boost occupancy during slower periods. Here's how different property tiers perform in Port Welshpool:
- Best-in-class properties (Top 10%) achieve 66%+ occupancy, indicating high desirability and potentially optimized availability.
- Strong performing properties (Top 25%) maintain 46% or higher occupancy, suggesting good market fit and guest satisfaction.
- Typical properties (Median) have an occupancy rate around 23%.
- Entry-level properties (Bottom 25%) average 14% occupancy, potentially facing higher vacancy.
Average Monthly Occupancy Rate Trend in Port Welshpool
Average Daily Rate (ADR) Airbnb Trends in Port Welshpool (2026)
Effective short term rental pricing strategy in Port Welshpool involves understanding monthly ADR fluctuations. The Average Daily Rate (ADR) for Airbnb in Port Welshpool typically peaks in December and dips lowest during July. Leveraging Airbnb dynamic pricing tools or strategies based on this seasonality can significantly boost revenue. Here's a look at the typical nightly rates achieved:
- Best-in-class properties (Top 10%) command rates of $277+ per night, often due to premium features or locations.
- Strong performing properties (Top 25%) achieve nightly rates of $250 or more.
- Typical properties (Median) charge around $221 per night.
- Entry-level properties (Bottom 25%) earn around $157 per night.
Average Daily Rate (ADR) Trend by Month in Port Welshpool
Get Live Port Welshpool Market Intelligence 👇

Explore Real-time Analytics
Airbnb Seasonality Analysis & Trends in Port Welshpool (2026)
Peak Season (April, January, March)
- Revenue averages $2,559 per month
- Occupancy rates average 43.2%
- Daily rates average $210
Shoulder Season
- Revenue averages $1,771 per month
- Occupancy maintains around 30.7%
- Daily rates hold near $209
Low Season (May, August, October)
- Revenue drops to average $1,175 per month
- Occupancy decreases to average 21.2%
- Daily rates adjust to average $203
Seasonality Insights for Port Welshpool
- The Airbnb seasonality in Port Welshpool shows highly seasonal trends requiring careful strategy. While the sections above show seasonal averages, it's also insightful to look at the extremes:
- During the high season, the absolute peak month showcases Port Welshpool's highest earning potential, with monthly revenues capable of climbing to $2,683, occupancy reaching a high of 48.0%, and ADRs peaking at $226.
- Conversely, the slowest single month of the year, typically falling within the low season, marks the market's lowest point. In this month, revenue might dip to $836, occupancy could drop to 16.1%, and ADRs may adjust down to $201.
- Understanding both the seasonal averages and these monthly peaks and troughs in revenue, occupancy, and ADR is crucial for maximizing your Airbnb profit potential in Port Welshpool.
Seasonal Strategies for Maximizing Profit
- Peak Season: Maximize revenue through premium pricing and potentially longer minimum stays. Ensure high availability.
- Low Season: Offer competitive pricing, special promotions (e.g., extended stay discounts), and flexible cancellation policies. Target off-season travelers like remote workers or budget-conscious guests.
- Shoulder Seasons: Implement dynamic pricing that balances peak and low rates. Target weekend travelers or specific events. Offer slightly more flexible terms than peak season.
- Regularly analyze your own performance against these Port Welshpool seasonality benchmarks and adjust your pricing and availability strategy accordingly.
Best Areas for Airbnb Investment in Port Welshpool (2026)
Exploring the top neighborhoods for short-term rentals in Port Welshpool? This section highlights key areas, outlining why they are attractive for hosts and guests, along with notable local attractions. Consider these locations based on your target guest profile and investment strategy.
| Neighborhood / Area | Why Host Here? (Target Guests & Appeal) | Key Attractions & Landmarks |
|---|---|---|
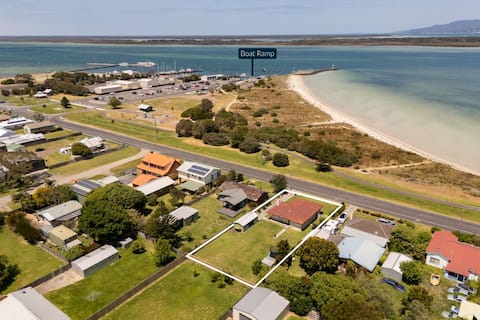
| Port Welshpool Beach | A secluded and scenic beach area, perfect for travelers seeking relaxation and nature. With beautiful views and a tranquil atmosphere, it attracts families and couples looking for a getaway. | Port Welshpool Long Jetty, Corner Inlet, Wilson's Promontory National Park, Fishing and boating activities, Scenic coastal walks |
| Wilson's Promontory | Famous for its stunning national park, this area is a prime destination for nature lovers and adventure seekers. The park offers hiking, wildlife watching, and pristine beaches, making it ideal for unique Airbnb experiences. | Squeaky Beach, Tidal River, Wilsons Promontory Lighthouse, Hiking trails, Wildlife spotting |
| Agnes Falls | Unique natural attraction known for the highest single-drop waterfall in Victoria. This picturesque site draws visitors who appreciate natural beauty and photography opportunities, enhancing Airbnb appeal. | Agnes Falls Scenic Reserve, Walking trails, Picnic areas, Wildlife spotting |
| Port Welshpool Marina | A key area for boating and fishing enthusiasts. Hosting in this area provides easy access to water activities, appealing to those looking for active vacations. | Fishing charters, Boat ramp, Local eateries, Coastal views |
| Prom Country Cheese | A local dairy farm and cheese-making facility offering tastings and tours. This attracts culinary tourists and families, making for a unique Airbnb experience. | Cheese tastings, Farm tours, Local produce shopping |
| Yanakie | Gateway to Wilson's Promontory, Yanakie is ideal for visitors heading to the park. Its proximity to nature and local charm make it a valuable area for Airbnb listings. | Yanakie Beach, The Prom Wildlife Park, Access to national park trails |
| Fishing Locations | Port Welshpool is known for its excellent fishing spots, attracting fishing enthusiasts all year round. Hosting here would likely attract a dedicated niche market. | Fishing charters, Jetty fishing, Scenic fishing spots |
| Local Wineries | The surrounding area has several wineries, appealing to visitors interested in wine tourism. This adds a cultural and culinary twist to the Airbnb experience. | Wine tastings, Vineyard tours, Local produce |
Understanding Airbnb License Requirements & STR Laws in Port Welshpool (2026)
While Port Welshpool, Victoria, Australia currently shows low STR regulations, specific Airbnb license requirements might still exist or change. Always verify the latest short term rental regulations and Airbnb license requirements directly with local government authorities for Port Welshpool to ensure full compliance before hosting.
(Source: AirROI data, 2026, finding no licensed listings among those analyzed)
Top Performing Airbnb Properties in Port Welshpool (2026)
Benchmark your potential! Explore examples of top-performing Airbnb properties in Port Welshpoolbased on Trailing Twelve Month (TTM) revenue. Analyze their characteristics, revenue, occupancy rate, and ADR to understand what drives success in this market.

Beach Haven
Entire Place • 5 bedrooms

"Victorias Secret" Home away from home
Entire Place • 2 bedrooms
Casa Mar Vista
Entire Place • 3 bedrooms

Reel Seaclusion - Port Welshpool
Entire Place • 3 bedrooms
Comfy home by the sea
Entire Place • 3 bedrooms

Fisherman’s retreat
Entire Place • 5 bedrooms
Note: Performance varies based on location, size, amenities, seasonality, and management quality. Data reflects the past 12 months.
Top Performing Airbnb Hosts in Port Welshpool (2026)
Learn from the best! This table showcases top-performing Airbnb hosts in Port Welshpool based on the number of properties managed and estimated total revenue over the past year. Analyze their scale and performance metrics.
| Host Name | Properties | Grossing Revenue | Stay Reviews | Avg Rating |
|---|---|---|---|---|
| Lisa | 6 | $71,940 | 83 | 4.98/5.0 |
| Arvin | 1 | $42,996 | 99 | 4.93/5.0 |
| Kerry | 1 | $31,423 | 200 | 4.76/5.0 |
| Caleb | 1 | $30,797 | 6 | 4.67/5.0 |
| Bec | 1 | $26,969 | 64 | 4.66/5.0 |
| Mike | 1 | $24,312 | 28 | 4.82/5.0 |
| Andy | 1 | $22,210 | 39 | 4.87/5.0 |
| Carly | 1 | $17,130 | 123 | 4.72/5.0 |
| Mona Melfa | 1 | $15,324 | 18 | 4.94/5.0 |
| Kathryn | 1 | $14,612 | 51 | 4.67/5.0 |
Analyzing the strategies of top hosts, such as their property selection, pricing, and guest communication, can offer valuable lessons for optimizing your own Airbnb operations in Port Welshpool.
Dive Deeper: Advanced Port Welshpool STR Market Data (2026)
Ready to unlock more insights? AirROI provides access to advanced metrics and comprehensive Airbnb data for Port Welshpool. Explore detailed analytics beyond this report to refine your investment strategy, optimize pricing, and maximize your vacation rental profits.
Explore Advanced MetricsPort Welshpool Short-Term Rental Market Composition (2026): Property & Room Types
Room Type Distribution
Property Type Distribution
Market Composition Insights for Port Welshpool
- The Port Welshpool Airbnb market composition is heavily skewed towards Entire Home/Apt listings, which make up 100% of the 19 active rentals. This indicates strong guest preference for privacy and space.
- Looking at the property type distribution in Port Welshpool, House properties are the most common (78.9%), reflecting the local real estate landscape.
- Houses represent a significant 78.9% portion, catering likely to families or larger groups.
- The presence of 15.8% Hotel/Boutique listings indicates integration with traditional hospitality.
Port Welshpool Airbnb Room Capacity Analysis (2026): Bedroom Distribution
Distribution of Listings by Number of Bedrooms
Room Capacity Insights for Port Welshpool
- The dominant room capacity in Port Welshpool is 3 bedrooms listings, making up 42.1% of the market. This suggests a strong demand for properties suitable for families or small groups.
- Together, 3 bedrooms and 2 bedrooms properties represent 84.2% of the active Airbnb listings in Port Welshpool, indicating a high concentration in these sizes.
- A significant 52.6% of listings offer 3+ bedrooms, catering to larger groups and families seeking more space in Port Welshpool.
Port Welshpool Vacation Rental Guest Capacity Trends (2026)
Distribution of Listings by Guest Capacity
Guest Capacity Insights for Port Welshpool
- The most common guest capacity trend in Port Welshpool vacation rentals is listings accommodating 8+ guests (42.1%). This suggests the primary traveler segment is likely larger groups.
- Properties designed for 8+ guests and 4 guests dominate the Port Welshpool STR market, accounting for 68.4% of listings.
- 57.9% of properties accommodate 6+ guests, serving the market segment for larger families or group travel in Port Welshpool.
- On average, properties in Port Welshpool are equipped to host 6.1 guests.
Port Welshpool Airbnb Booking Patterns (2026): Available vs. Booked Days
Available Days Distribution
Booked Days Distribution
Booking Pattern Insights for Port Welshpool
- The most common availability pattern in Port Welshpool falls within the 271-366 days range, representing 63.2% of listings. This suggests many properties have significant open periods on their calendars.
- Approximately 94.8% of listings show high availability (181+ days open annually), indicating potential for increased bookings or specific owner usage patterns.
- For booked days, the 31-90 days range is most frequent in Port Welshpool (52.6%), reflecting common guest stay durations or potential owner blocking patterns.
- A notable 5.3% of properties secure long booking periods (181+ days booked per year), highlighting successful long-term rental strategies or significant owner usage.
Port Welshpool Airbnb Minimum Stay Requirements Analysis
Distribution of Listings by Minimum Night Requirement
1 Night
1 listings
5.3% of total
2 Nights
11 listings
57.9% of total
3 Nights
1 listings
5.3% of total
30+ Nights
6 listings
31.6% of total
Key Insights
- The most prevalent minimum stay requirement in Port Welshpool is 2 Nights, adopted by 57.9% of listings. This highlights the market's preference for shorter, flexible bookings.
- A strong majority (63.2%) of the Port Welshpool Airbnb data shows acceptance of very short stays (1-2 nights), indicating a dynamic, high-turnover market.
- A significant segment (31.6%) caters to monthly stays (30+ nights) in Port Welshpool, pointing to opportunities in the extended-stay market.
Recommendations
- Align with the market by considering a 2 Nights minimum stay, as 57.9% of Port Welshpool hosts use this setting.
- If feasible, allowing 1-night stays, especially midweek or during low season, could capture last-minute bookings, as only 5.3% currently do.
- A 2-night minimum appears standard (57.9%). Consider this for weekends or peak periods.
- Explore offering discounts for stays of 30+ nights to attract the 31.6% of the market seeking extended stays.
- Adjust minimum nights based on seasonality – potentially shorter during low season and longer during peak demand periods in Port Welshpool.
Port Welshpool Airbnb Cancellation Policy Trends Analysis (2026)
Super Strict 60 Days
2 listings
10.5% of total
Flexible
3 listings
15.8% of total
Moderate
2 listings
10.5% of total
Firm
8 listings
42.1% of total
Strict
4 listings
21.1% of total
Cancellation Policy Insights for Port Welshpool
- The prevailing Airbnb cancellation policy trend in Port Welshpool is Firm, used by 42.1% of listings.
- A majority (63.2%) of hosts in Port Welshpool utilize Firm or Strict policies, indicating a market where hosts prioritize booking security.
Recommendations for Hosts
- Consider adopting a Firm policy to align with the 42.1% market standard in Port Welshpool.
- Regularly review your cancellation policy against competitors and market demand shifts in Port Welshpool.
Port Welshpool STR Booking Lead Time Analysis (2026)
Average Booking Lead Time by Month
Booking Lead Time Insights for Port Welshpool
- The overall average booking lead time for vacation rentals in Port Welshpool is 51 days.
- Guests book furthest in advance for stays during December (average 114 days), likely coinciding with peak travel demand or local events.
- The shortest booking windows occur for stays in May (average 17 days), indicating more last-minute travel plans during this time.
- Seasonally, Winter (68 days avg.) sees the longest lead times, while Summer (33 days avg.) has the shortest, reflecting typical travel planning cycles.
Recommendations for Hosts
- Use the overall average lead time (51 days) as a baseline for your pricing and availability strategy in Port Welshpool.
- For December stays, consider implementing length-of-stay discounts or slightly higher rates for bookings made less than 114 days out to capitalize on advance planning.
- Target marketing efforts for the Winter season well in advance (at least 68 days) to capture early planners.
- Monitor your own booking lead times against these Port Welshpool averages to identify opportunities for dynamic pricing adjustments.
Popular & Essential Airbnb Amenities in Port Welshpool (2026)
Amenity Prevalence
Amenity Insights for Port Welshpool
- Popular amenities like TV, Heating, Kitchen are common but not universal. Offering these can provide a competitive edge.
Recommendations for Hosts
- Consider adding popular differentiators like TV or Heating to increase appeal.
- Highlight unique or less common amenities you offer (e.g., hot tub, dedicated workspace, EV charger) in your listing description and photos.
- Regularly check competitor amenities in Port Welshpool to stay competitive.
Port Welshpool Airbnb Guest Demographics & Profile Analysis (2026)
Guest Profile Summary for Port Welshpool
- The typical guest profile for Airbnb in Port Welshpool consists of primarily domestic travelers (92%), often arriving from nearby Melbourne, typically belonging to the Post-2000s (Gen Z/Alpha) group (50%), primarily speaking English or Chinese.
- Domestic travelers account for 92.3% of guests.
- Key international markets include Australia (92.3%) and United Kingdom (2.6%).
- Top languages spoken are English (66.7%) followed by Chinese (9.1%).
- A significant demographic segment is the Post-2000s (Gen Z/Alpha) group, representing 50% of guests.
Recommendations for Hosts
- Target domestic marketing efforts towards travelers from Melbourne and Victoria.
- Tailor amenities and listing descriptions to appeal to the dominant Post-2000s (Gen Z/Alpha) demographic (e.g., highlight fast WiFi, smart home features, local guides).
- Highlight unique local experiences or amenities relevant to the primary guest profile.
- Consider seasonal promotions aligned with peak travel times for key origin markets.
Nearby Short-Term Rental Market Comparison
How does the Port Welshpool Airbnb market stack up against its neighbors? Compare key performance metrics like average monthly revenue, ADR, and occupancy rates in surrounding areas to understand the broader regional STR landscape.
| Market | Active Properties | Monthly Revenue | Daily Rate | Avg. Occupancy |
|---|---|---|---|---|
| Mount Martha | 15 | $3,621 | $514.62 | 30% |
| Shire of Mansfield | 84 | $2,896 | $372.92 | 32% |
| Yanakie | 17 | $2,882 | $227.69 | 47% |
| Shire of Murrindindi | 76 | $2,833 | $311.08 | 37% |
| Mansfield | 133 | $2,625 | $315.39 | 34% |
| Flinders Council | 16 | $2,619 | $224.46 | 47% |
| Mount Buller | 119 | $2,604 | $558.48 | 30% |
| Kinglake | 13 | $2,544 | $277.97 | 42% |
| Meeniyan | 13 | $2,528 | $245.07 | 38% |
| Bonnie Doon | 24 | $2,506 | $420.61 | 27% |