Whitfield Airbnb Market Analysis 2026: Short Term Rental Data & Vacation Rental Statistics in Victoria, Australia
Is Airbnb profitable in Whitfield in 2026? Explore comprehensive Airbnb analytics for Whitfield, Victoria, Australia to uncover income potential. This 2026 STR market report for Whitfield, based on AirROI data from February 2025 to January 2026, reveals key trends in the niche market of 21 active listings.
Whether you're considering an Airbnb investment in Whitfield, optimizing your existing vacation rental, or exploring rental arbitrage opportunities, understanding the Whitfield Airbnb data is crucial. Leveraging the low regulation environment is key to maximizing your short term rental income potential. Let's dive into the specifics.
Key Whitfield Airbnb Performance Metrics Overview
Monthly Airbnb Revenue Variations & Income Potential in Whitfield (2026)
Understanding the monthly revenue variations for Airbnb listings in Whitfield is key to maximizing your short term rental income potential. Seasonality significantly impacts earnings. Our analysis, based on data from the past 12 months, shows that the peak revenue month for STRs in Whitfield is typically March, while September often presents the lowest earnings, highlighting opportunities for strategic pricing adjustments during shoulder and low seasons. Explore the typical Airbnb income in Whitfield across different performance tiers:
- Best-in-class properties (Top 10%) achieve $5,614+ monthly, often utilizing dynamic pricing and superior guest experiences.
- Strong performing properties (Top 25%) earn $3,295 or more, indicating effective management and desirable locations/amenities.
- Typical properties (Median) generate around $2,221 per month, representing the average market performance.
- Entry-level properties (Bottom 25%) see earnings around $1,436, often with potential for optimization.
Average Monthly Airbnb Earnings Trend in Whitfield
Whitfield Airbnb Occupancy Rate Trends (2026)
Maximize your bookings by understanding the Whitfield STR occupancy trends. Seasonal demand shifts significantly influence how often properties are booked. Typically, Marchsees the highest demand (peak season occupancy), while February experiences the lowest (low season). Effective strategies, like adjusting minimum stays or offering promotions, can boost occupancy during slower periods. Here's how different property tiers perform in Whitfield:
- Best-in-class properties (Top 10%) achieve 76%+ occupancy, indicating high desirability and potentially optimized availability.
- Strong performing properties (Top 25%) maintain 59% or higher occupancy, suggesting good market fit and guest satisfaction.
- Typical properties (Median) have an occupancy rate around 42%.
- Entry-level properties (Bottom 25%) average 24% occupancy, potentially facing higher vacancy.
Average Monthly Occupancy Rate Trend in Whitfield
Average Daily Rate (ADR) Airbnb Trends in Whitfield (2026)
Effective short term rental pricing strategy in Whitfield involves understanding monthly ADR fluctuations. The Average Daily Rate (ADR) for Airbnb in Whitfield typically peaks in April and dips lowest during November. Leveraging Airbnb dynamic pricing tools or strategies based on this seasonality can significantly boost revenue. Here's a look at the typical nightly rates achieved:
- Best-in-class properties (Top 10%) command rates of $519+ per night, often due to premium features or locations.
- Strong performing properties (Top 25%) achieve nightly rates of $286 or more.
- Typical properties (Median) charge around $171 per night.
- Entry-level properties (Bottom 25%) earn around $141 per night.
Average Daily Rate (ADR) Trend by Month in Whitfield
Get Live Whitfield Market Intelligence 👇

Explore Real-time Analytics
Airbnb Seasonality Analysis & Trends in Whitfield (2026)
Peak Season (March, April, May)
- Revenue averages $3,469 per month
- Occupancy rates average 51.5%
- Daily rates average $251
Shoulder Season
- Revenue averages $2,755 per month
- Occupancy maintains around 42.5%
- Daily rates hold near $245
Low Season (January, June, September)
- Revenue drops to average $2,149 per month
- Occupancy decreases to average 38.5%
- Daily rates adjust to average $249
Seasonality Insights for Whitfield
- The Airbnb seasonality in Whitfield shows moderate seasonality with distinct peak and low periods. While the sections above show seasonal averages, it's also insightful to look at the extremes:
- During the high season, the absolute peak month showcases Whitfield's highest earning potential, with monthly revenues capable of climbing to $3,898, occupancy reaching a high of 55.0%, and ADRs peaking at $254.
- Conversely, the slowest single month of the year, typically falling within the low season, marks the market's lowest point. In this month, revenue might dip to $1,954, occupancy could drop to 32.9%, and ADRs may adjust down to $239.
- Understanding both the seasonal averages and these monthly peaks and troughs in revenue, occupancy, and ADR is crucial for maximizing your Airbnb profit potential in Whitfield.
Seasonal Strategies for Maximizing Profit
- Peak Season: Maximize revenue through premium pricing and potentially longer minimum stays. Ensure high availability.
- Low Season: Offer competitive pricing, special promotions (e.g., extended stay discounts), and flexible cancellation policies. Target off-season travelers like remote workers or budget-conscious guests.
- Shoulder Seasons: Implement dynamic pricing that balances peak and low rates. Target weekend travelers or specific events. Offer slightly more flexible terms than peak season.
- Regularly analyze your own performance against these Whitfield seasonality benchmarks and adjust your pricing and availability strategy accordingly.
Best Areas for Airbnb Investment in Whitfield (2026)
Exploring the top neighborhoods for short-term rentals in Whitfield? This section highlights key areas, outlining why they are attractive for hosts and guests, along with notable local attractions. Consider these locations based on your target guest profile and investment strategy.
| Neighborhood / Area | Why Host Here? (Target Guests & Appeal) | Key Attractions & Landmarks |
|---|---|---|
| Whitfield Village | Charming village known for its mountainous landscapes and proximity to beautiful wineries. Ideal for tourists looking for a peaceful retreat with outdoor activities and local wine tasting experiences. | King Valley wineries, Murray to Mountains Rail Trail, Whitfield Brewery, Warby-Ovens National Park, Local restaurants featuring regional cuisine |
| King Valley | Famous for its picturesque vineyards and gourmet food offerings. A fantastic spot for those interested in agritourism and culinary experiences. | Valley Views Vineyard, Brown Brothers Winery, Pizzini Wines, King Valley Olive Estate, Gourmet food festivals |
| Myrtleford | A gateway to the Alpine region, Myrtleford offers seasonal outdoor activities including hiking and skiing, making it a year-round destination. | Myrtleford Butter Factory, Myrtleford Streamside Reserve, Alpine Valley Cheese, Murray to Mountains Rail Trail, Beck's Blueberry Farm |
| Porepunkah | Located at the foot of the Mount Buffalo National Park, ideal for nature lovers and outdoor enthusiasts, especially popular in winter. | Mount Buffalo National Park, Buffalo River, Porepunkah Bridge, Lakeside restaurants, Adventure tours |
| Beechworth | Historic town with well-preserved colonial architecture, known for its rich history and cultural significance. Great for tourists interested in history and food. | Beechworth Gaol, Beechworth Bakery, Ned Kelly Museum, Woolshed Falls, Beechworth Honey |
| Bright | Known for its stunning landscapes and outdoor activities throughout the year. Ideal for families and adventure seekers. | Bright Splash Park, Mountain biking trails, Bright marron farm, Ovens River, Canyoning and rafting experiences |
| Yackandandah | A beautiful, historic town with a strong arts community. Perfect for visitors looking for unique crafts and a quiet experience. | Yackandandah Museum, Yackandandah Brewery, Local art galleries, Bushwalking trails, Craft markets |
| Cheshunt | Quiet rural area known for its scenic views and proximity to wineries. Suitable for guests seeking tranquility and nature-based experiences. | Cheshunt Vineyards, Murray River hiking trails, Local dairy farms, Scenic lookout points, Picnic spots by the river |
Understanding Airbnb License Requirements & STR Laws in Whitfield (2026)
While Whitfield, Victoria, Australia currently shows low STR regulations, specific Airbnb license requirements might still exist or change. Always verify the latest short term rental regulations and Airbnb license requirements directly with local government authorities for Whitfield to ensure full compliance before hosting.
(Source: AirROI data, 2026, finding no licensed listings among those analyzed)
Top Performing Airbnb Properties in Whitfield (2026)
Benchmark your potential! Explore examples of top-performing Airbnb properties in Whitfieldbased on Trailing Twelve Month (TTM) revenue. Analyze their characteristics, revenue, occupancy rate, and ADR to understand what drives success in this market.

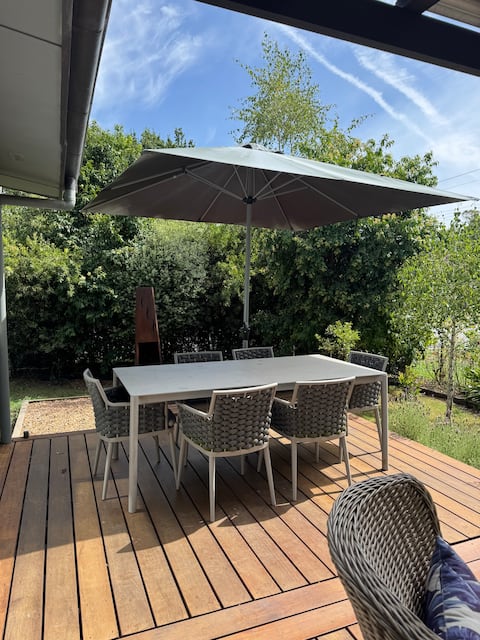
Dal Zotto Homestead - Three Bedrooms
Entire Place • 3 bedrooms

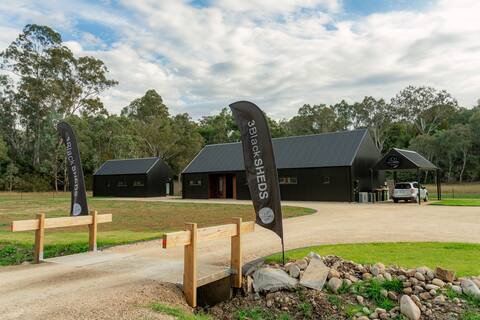
BIG Shed @ 3BlackSHEDS - Getaway for the FAMILY
Entire Place • 3 bedrooms
Acorn Cottage - King Valley Food & Wine Region
Entire Place • 3 bedrooms
ALL Sheds - Comfort & Style for Families or Groups
Entire Place • 5 bedrooms

Dal Zotto Homestead - Two Bedrooms
Entire Place • 2 bedrooms

Lusso - Boutique accomodation in the King Valley
Entire Place • 3 bedrooms
Note: Performance varies based on location, size, amenities, seasonality, and management quality. Data reflects the past 12 months.
Top Performing Airbnb Hosts in Whitfield (2026)
Learn from the best! This table showcases top-performing Airbnb hosts in Whitfield based on the number of properties managed and estimated total revenue over the past year. Analyze their scale and performance metrics.
| Host Name | Properties | Grossing Revenue | Stay Reviews | Avg Rating |
|---|---|---|---|---|
| Michael | 6 | $164,601 | 17 | 4.61/5.0 |
| Alan & Rowena | 4 | $163,140 | 213 | 4.99/5.0 |
| Paul | 1 | $43,569 | 63 | 4.97/5.0 |
| Gemma | 1 | $35,609 | 26 | 4.92/5.0 |
| Alison | 1 | $34,007 | 150 | 4.97/5.0 |
| Melanie | 1 | $30,650 | 209 | 4.96/5.0 |
| Carla | 1 | $29,402 | 126 | 4.88/5.0 |
| Michelle | 1 | $26,562 | 121 | 4.96/5.0 |
| Nicole | 1 | $21,913 | 214 | 4.92/5.0 |
| Melissa | 1 | $21,141 | 33 | 4.82/5.0 |
Analyzing the strategies of top hosts, such as their property selection, pricing, and guest communication, can offer valuable lessons for optimizing your own Airbnb operations in Whitfield.
Dive Deeper: Advanced Whitfield STR Market Data (2026)
Ready to unlock more insights? AirROI provides access to advanced metrics and comprehensive Airbnb data for Whitfield. Explore detailed analytics beyond this report to refine your investment strategy, optimize pricing, and maximize your vacation rental profits.
Explore Advanced MetricsWhitfield Short-Term Rental Market Composition (2026): Property & Room Types
Room Type Distribution
Property Type Distribution
Market Composition Insights for Whitfield
- The Whitfield Airbnb market composition is heavily skewed towards Entire Home/Apt listings, which make up 100% of the 21 active rentals. This indicates strong guest preference for privacy and space.
- Looking at the property type distribution in Whitfield, House properties are the most common (76.2%), reflecting the local real estate landscape.
- Houses represent a significant 76.2% portion, catering likely to families or larger groups.
- The presence of 19% Hotel/Boutique listings indicates integration with traditional hospitality.
- Smaller segments like others (combined 4.8%) offer potential for unique stay experiences.
Whitfield Airbnb Room Capacity Analysis (2026): Bedroom Distribution
Distribution of Listings by Number of Bedrooms
Room Capacity Insights for Whitfield
- The dominant room capacity in Whitfield is 3 bedrooms listings, making up 47.6% of the market. This suggests a strong demand for properties suitable for families or small groups.
- Together, 3 bedrooms and 1 bedroom properties represent 85.7% of the active Airbnb listings in Whitfield, indicating a high concentration in these sizes.
- A significant 52.4% of listings offer 3+ bedrooms, catering to larger groups and families seeking more space in Whitfield.
Whitfield Vacation Rental Guest Capacity Trends (2026)
Distribution of Listings by Guest Capacity
Guest Capacity Insights for Whitfield
- The most common guest capacity trend in Whitfield vacation rentals is listings accommodating 2 guests (38.1%). This suggests the primary traveler segment is likely couples or solo travelers.
- Properties designed for 2 guests and 6 guests dominate the Whitfield STR market, accounting for 66.7% of listings.
- 47.7% of properties accommodate 6+ guests, serving the market segment for larger families or group travel in Whitfield.
- On average, properties in Whitfield are equipped to host 4.5 guests.
Whitfield Airbnb Booking Patterns (2026): Available vs. Booked Days
Available Days Distribution
Booked Days Distribution
Booking Pattern Insights for Whitfield
- The most common availability pattern in Whitfield falls within the 271-366 days range, representing 38.1% of listings. This suggests many properties have significant open periods on their calendars.
- Approximately 61.9% of listings show high availability (181+ days open annually), indicating potential for increased bookings or specific owner usage patterns.
- For booked days, the 181-270 days range is most frequent in Whitfield (38.1%), reflecting common guest stay durations or potential owner blocking patterns.
- A notable 38.1% of properties secure long booking periods (181+ days booked per year), highlighting successful long-term rental strategies or significant owner usage.
Whitfield Airbnb Minimum Stay Requirements Analysis
Distribution of Listings by Minimum Night Requirement
1 Night
11 listings
52.4% of total
2 Nights
4 listings
19% of total
30+ Nights
6 listings
28.6% of total
Key Insights
- The most prevalent minimum stay requirement in Whitfield is 1 Night, adopted by 52.4% of listings. This highlights the market's preference for shorter, flexible bookings.
- A strong majority (71.4%) of the Whitfield Airbnb data shows acceptance of very short stays (1-2 nights), indicating a dynamic, high-turnover market.
- A significant segment (28.6%) caters to monthly stays (30+ nights) in Whitfield, pointing to opportunities in the extended-stay market.
Recommendations
- Align with the market by considering a 1 Night minimum stay, as 52.4% of Whitfield hosts use this setting.
- Explore offering discounts for stays of 30+ nights to attract the 28.6% of the market seeking extended stays.
- Adjust minimum nights based on seasonality – potentially shorter during low season and longer during peak demand periods in Whitfield.
Whitfield Airbnb Cancellation Policy Trends Analysis (2026)
Flexible
2 listings
9.5% of total
Moderate
2 listings
9.5% of total
Firm
15 listings
71.4% of total
Strict
2 listings
9.5% of total
Cancellation Policy Insights for Whitfield
- The prevailing Airbnb cancellation policy trend in Whitfield is Firm, used by 71.4% of listings.
- A majority (80.9%) of hosts in Whitfield utilize Firm or Strict policies, indicating a market where hosts prioritize booking security.
- Strict cancellation policies are quite rare (9.5%), potentially making listings with this policy less competitive unless justified by high demand or property type.
Recommendations for Hosts
- Consider adopting a Firm policy to align with the 71.4% market standard in Whitfield.
- Using a Strict policy might deter some guests, as only 9.5% of listings use it. Evaluate if potential revenue protection outweighs possible lower booking rates.
- Regularly review your cancellation policy against competitors and market demand shifts in Whitfield.
Whitfield STR Booking Lead Time Analysis (2026)
Average Booking Lead Time by Month
Booking Lead Time Insights for Whitfield
- The overall average booking lead time for vacation rentals in Whitfield is 90 days.
- Guests book furthest in advance for stays during December (average 128 days), likely coinciding with peak travel demand or local events.
- The shortest booking windows occur for stays in August (average 51 days), indicating more last-minute travel plans during this time.
- Seasonally, Winter (100 days avg.) sees the longest lead times, while Summer (76 days avg.) has the shortest, reflecting typical travel planning cycles.
Recommendations for Hosts
- Use the overall average lead time (90 days) as a baseline for your pricing and availability strategy in Whitfield.
- For December stays, consider implementing length-of-stay discounts or slightly higher rates for bookings made less than 128 days out to capitalize on advance planning.
- Target marketing efforts for the Winter season well in advance (at least 100 days) to capture early planners.
- Monitor your own booking lead times against these Whitfield averages to identify opportunities for dynamic pricing adjustments.
Popular & Essential Airbnb Amenities in Whitfield (2026)
Amenity Prevalence
Amenity Insights for Whitfield
- Essential amenities in Whitfield that guests expect include: Smoke alarm, Air conditioning, Heating, Iron, Hair dryer. Lacking these (any) could significantly impact bookings.
- Popular amenities like Fire extinguisher, Free parking on premises, BBQ grill are common but not universal. Offering these can provide a competitive edge.
- Warning: Wifi is not universally provided but is considered essential globally. Ensure reliable Wifi is offered.
Recommendations for Hosts
- Ensure your listing includes all essential amenities for Whitfield: Smoke alarm, Air conditioning, Heating, Iron, Hair dryer.
- Prioritize adding missing essentials: Iron, Hair dryer.
- Consider adding popular differentiators like Fire extinguisher or Free parking on premises to increase appeal.
- Highlight unique or less common amenities you offer (e.g., hot tub, dedicated workspace, EV charger) in your listing description and photos.
- Regularly check competitor amenities in Whitfield to stay competitive.
Whitfield Airbnb Guest Demographics & Profile Analysis (2026)
Guest Profile Summary for Whitfield
- The typical guest profile for Airbnb in Whitfield consists of primarily domestic travelers (96%), often arriving from nearby Melbourne, typically belonging to the Post-2000s (Gen Z/Alpha) group (50%), primarily speaking English or Chinese.
- Domestic travelers account for 96.2% of guests.
- Key international markets include Australia (96.2%) and United States (1.5%).
- Top languages spoken are English (75.6%) followed by Chinese (4.9%).
- A significant demographic segment is the Post-2000s (Gen Z/Alpha) group, representing 50% of guests.
Recommendations for Hosts
- Target domestic marketing efforts towards travelers from Melbourne and Victoria.
- Tailor amenities and listing descriptions to appeal to the dominant Post-2000s (Gen Z/Alpha) demographic (e.g., highlight fast WiFi, smart home features, local guides).
- Highlight unique local experiences or amenities relevant to the primary guest profile.
- Consider seasonal promotions aligned with peak travel times for key origin markets.
Nearby Short-Term Rental Market Comparison
How does the Whitfield Airbnb market stack up against its neighbors? Compare key performance metrics like average monthly revenue, ADR, and occupancy rates in surrounding areas to understand the broader regional STR landscape.
| Market | Active Properties | Monthly Revenue | Daily Rate | Avg. Occupancy |
|---|---|---|---|---|
| Bright | 492 | $2,935 | $281.84 | 38% |
| Shire of Mansfield | 84 | $2,896 | $372.92 | 32% |
| Shire of Strathbogie | 38 | $2,866 | $343.39 | 36% |
| Shire of Murrindindi | 76 | $2,833 | $311.08 | 37% |
| City of Greater Shepparton | 11 | $2,746 | $231.26 | 40% |
| Yarrawonga | 109 | $2,674 | $380.30 | 30% |
| Mansfield | 133 | $2,625 | $315.39 | 34% |
| Mount Buller | 119 | $2,604 | $558.48 | 30% |
| Falls Creek | 48 | $2,589 | $433.92 | 31% |
| Beechworth | 123 | $2,577 | $249.85 | 39% |