Navis Airbnb Market Analysis 2025: Short Term Rental Data & Vacation Rental Statistics in Bezirk Innsbruck-Land, Austria
Is Airbnb profitable in Navis in 2025? Explore comprehensive Airbnb analytics for Navis, Bezirk Innsbruck-Land, Austria to uncover income potential. This 2025 STR market report for Navis, based on AirROI data from October 2024 to September 2025, reveals key trends in the niche market of 17 active listings.
Whether you're considering an Airbnb investment in Navis, optimizing your existing vacation rental, or exploring rental arbitrage opportunities, understanding the Navis Airbnb data is crucial. Leveraging the low regulation environment is key to maximizing your short term rental income potential. Let's dive into the specifics.
Key Navis Airbnb Performance Metrics Overview
Monthly Airbnb Revenue Variations & Income Potential in Navis (2025)
Understanding the monthly revenue variations for Airbnb listings in Navis is key to maximizing your short term rental income potential. Seasonality significantly impacts earnings. Our analysis, based on data from the past 12 months, shows that the peak revenue month for STRs in Navis is typically August, while March often presents the lowest earnings, highlighting opportunities for strategic pricing adjustments during shoulder and low seasons. Explore the typical Airbnb income in Navis across different performance tiers:
- Best-in-class properties (Top 10%) achieve $6,383+ monthly, often utilizing dynamic pricing and superior guest experiences.
- Strong performing properties (Top 25%) earn $2,359 or more, indicating effective management and desirable locations/amenities.
- Typical properties (Median) generate around $1,333 per month, representing the average market performance.
- Entry-level properties (Bottom 25%) see earnings around $650, often with potential for optimization.
Average Monthly Airbnb Earnings Trend in Navis
Navis Airbnb Occupancy Rate Trends (2025)
Maximize your bookings by understanding the Navis STR occupancy trends. Seasonal demand shifts significantly influence how often properties are booked. Typically, Augustsees the highest demand (peak season occupancy), while November experiences the lowest (low season). Effective strategies, like adjusting minimum stays or offering promotions, can boost occupancy during slower periods. Here's how different property tiers perform in Navis:
- Best-in-class properties (Top 10%) achieve 79%+ occupancy, indicating high desirability and potentially optimized availability.
- Strong performing properties (Top 25%) maintain 44% or higher occupancy, suggesting good market fit and guest satisfaction.
- Typical properties (Median) have an occupancy rate around 27%.
- Entry-level properties (Bottom 25%) average 15% occupancy, potentially facing higher vacancy.
Average Monthly Occupancy Rate Trend in Navis
Average Daily Rate (ADR) Airbnb Trends in Navis (2025)
Effective short term rental pricing strategy in Navis involves understanding monthly ADR fluctuations. The Average Daily Rate (ADR) for Airbnb in Navis typically peaks in August and dips lowest during December. Leveraging Airbnb dynamic pricing tools or strategies based on this seasonality can significantly boost revenue. Here's a look at the typical nightly rates achieved:
- Best-in-class properties (Top 10%) command rates of $457+ per night, often due to premium features or locations.
- Strong performing properties (Top 25%) achieve nightly rates of $259 or more.
- Typical properties (Median) charge around $172 per night.
- Entry-level properties (Bottom 25%) earn around $108 per night.
Average Daily Rate (ADR) Trend by Month in Navis
Get Live Navis Market Intelligence 👇

Explore Real-time Analytics
Airbnb Seasonality Analysis & Trends in Navis (2025)
Peak Season (August, December, June)
- Revenue averages $3,193 per month
- Occupancy rates average 42.6%
- Daily rates average $202
Shoulder Season
- Revenue averages $2,348 per month
- Occupancy maintains around 35.1%
- Daily rates hold near $202
Low Season (March, April, November)
- Revenue drops to average $2,013 per month
- Occupancy decreases to average 28.3%
- Daily rates adjust to average $194
Seasonality Insights for Navis
- The Airbnb seasonality in Navis shows highly seasonal trends requiring careful strategy. While the sections above show seasonal averages, it's also insightful to look at the extremes:
- During the high season, the absolute peak month showcases Navis's highest earning potential, with monthly revenues capable of climbing to $3,938, occupancy reaching a high of 49.4%, and ADRs peaking at $211.
- Conversely, the slowest single month of the year, typically falling within the low season, marks the market's lowest point. In this month, revenue might dip to $1,895, occupancy could drop to 25.7%, and ADRs may adjust down to $187.
- Understanding both the seasonal averages and these monthly peaks and troughs in revenue, occupancy, and ADR is crucial for maximizing your Airbnb profit potential in Navis.
Seasonal Strategies for Maximizing Profit
- Peak Season: Maximize revenue through premium pricing and potentially longer minimum stays. Ensure high availability.
- Low Season: Offer competitive pricing, special promotions (e.g., extended stay discounts), and flexible cancellation policies. Target off-season travelers like remote workers or budget-conscious guests.
- Shoulder Seasons: Implement dynamic pricing that balances peak and low rates. Target weekend travelers or specific events. Offer slightly more flexible terms than peak season.
- Regularly analyze your own performance against these Navis seasonality benchmarks and adjust your pricing and availability strategy accordingly.
Best Areas for Airbnb Investment in Navis (2025)
Exploring the top neighborhoods for short-term rentals in Navis? This section highlights key areas, outlining why they are attractive for hosts and guests, along with notable local attractions. Consider these locations based on your target guest profile and investment strategy.
| Neighborhood / Area | Why Host Here? (Target Guests & Appeal) | Key Attractions & Landmarks |
|---|---|---|
| Innsvorstadt | A historic area with charming streets and a strong local culture, located conveniently close to amenities and public transport. Ideal for tourists who want to explore local attractions and enjoy a genuine Austrian experience. | The Golden Roof (Goldenes Dachl), Innsbruck Cathedral, Imperial Palace (Hofburg), Tyrolean State Museum, Nordkette Mountain Range, Maria-Theresien-Strasse |
| Igls | A picturesque village in the hills overlooking Innsbruck, known for winter sports and summer hiking trails. A perfect retreat for nature lovers and winter sports enthusiasts. | Patscherkofel Mountain, Olympic Ski Jump, Igls Wood Trails, Village of Igls, Ski resorts nearby, Nordkette |
| Mühlau | A quiet residential area that offers stunning views of the mountains and easy access to nature trails, ideal for families and those seeking relaxation. | Mühlauer Brücke, Natterer See, Austrian TV Tower, Mountain hiking trails, Local parks, Scenic viewpoints |
| Wilten | Known for its cultural heritage and proximity to the Old Town, Wilten has a mix of traditional and modern attractions. Great for visitors who appreciate art and history. | Wilten Basilica, Tiroler Landestheater, Innsbruck Botanical Garden, Tyrolean Radio and Television, Local cafes and bars, Nearby shopping areas |
| Rum | A charming village on the outskirts of Innsbruck, offering a blend of rural charm and urban convenience. Attracts visitors who want to explore both the city and beautiful nature. | Local hiking paths, Observation towers, St. John's Church, Cultural festivals, Scenic bike trails, Relaxed village atmosphere |
| Amras | A district that combines modern living with historical sites, Amras offers a peaceful environment with easy access to historical landmarks and nature trails. | Amras Castle, Parks and green spaces, Local shopping areas, Cycling paths, Historical exhibitions, Cultural events |
| Neu-Tirol | A vibrant modern neighborhood with lots of new developments, shops, and eateries, attracting younger travelers looking for convenience and style. | Shopping centers, Cafes and restaurants, Local nightlife, Cultural sites, Public transportation access, Modern amenities |
| Hauptbahnhof | The central railway station area, offering excellent connectivity and a hub for visitors arriving from other cities. Best for guests seeking easy transit options. | Innsbruck Main Station, Nearby shopping districts, Public transport connections, Cafes and bakeries, Local attractions, Quick access to tourist sites |
Understanding Airbnb License Requirements & STR Laws in Navis (2025)
While Navis, Bezirk Innsbruck-Land, Austria currently shows low STR regulations, specific Airbnb license requirements might still exist or change. Always verify the latest short term rental regulations and Airbnb license requirements directly with local government authorities for Navis to ensure full compliance before hosting.
(Source: AirROI data, 2025, finding no licensed listings among those analyzed)
Top Performing Airbnb Properties in Navis (2025)
Benchmark your potential! Explore examples of top-performing Airbnb properties in Navisbased on Trailing Twelve Month (TTM) revenue. Analyze their characteristics, revenue, occupancy rate, and ADR to understand what drives success in this market.

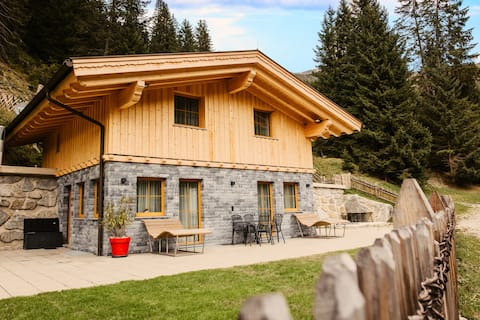
Cabin in the middle of nature with sauna & hot tub
Entire Place • 5 bedrooms

Bergresidenz Tirol
Entire Place • 1 bedroom

Bauernhaustirol "Peerhof"
Entire Place • 5 bedrooms
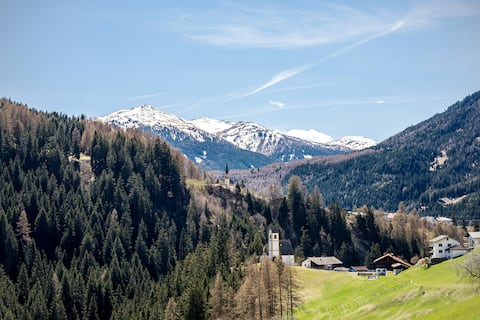
Bergler Hoamat - Mountain Hideaway Navis
Entire Place • 3 bedrooms
Stay on a farm in the beautiful Navistal
Entire Place • 3 bedrooms

Masterwort
Entire Place • 2 bedrooms
Note: Performance varies based on location, size, amenities, seasonality, and management quality. Data reflects the past 12 months.
Top Performing Airbnb Hosts in Navis (2025)
Learn from the best! This table showcases top-performing Airbnb hosts in Navis based on the number of properties managed and estimated total revenue over the past year. Analyze their scale and performance metrics.
| Host Name | Properties | Grossing Revenue | Stay Reviews | Avg Rating |
|---|---|---|---|---|
| Christiane | 1 | $129,431 | 38 | 4.92/5.0 |
| Christian Peter | 7 | $73,303 | 27 | 4.96/5.0 |
| Martin | 1 | $69,999 | 12 | 5.00/5.0 |
| Common Visual | 4 | $69,823 | 16 | 4.89/5.0 |
| Karl | 1 | $53,101 | 78 | 4.95/5.0 |
| Joe | 1 | $27,326 | 67 | 4.93/5.0 |
| Michael | 1 | $17,542 | 77 | 4.94/5.0 |
| Christoph - Interhome | 1 | $16,162 | 18 | 4.94/5.0 |
Analyzing the strategies of top hosts, such as their property selection, pricing, and guest communication, can offer valuable lessons for optimizing your own Airbnb operations in Navis.
Dive Deeper: Advanced Navis STR Market Data (2025)
Ready to unlock more insights? AirROI provides access to advanced metrics and comprehensive Airbnb data for Navis. Explore detailed analytics beyond this report to refine your investment strategy, optimize pricing, and maximize your vacation rental profits.
Explore Advanced MetricsNavis Short-Term Rental Market Composition (2025): Property & Room Types
Room Type Distribution
Property Type Distribution
Market Composition Insights for Navis
- The Navis Airbnb market composition is heavily skewed towards Entire Home/Apt listings, which make up 70.6% of the 17 active rentals. This indicates strong guest preference for privacy and space.
- Looking at the property type distribution in Navis, Apartment/Condo properties are the most common (64.7%), reflecting the local real estate landscape.
- Houses represent a significant 23.5% portion, catering likely to families or larger groups.
- The presence of 5.9% Hotel/Boutique listings indicates integration with traditional hospitality.
Navis Airbnb Room Capacity Analysis (2025): Bedroom Distribution
Distribution of Listings by Number of Bedrooms
Room Capacity Insights for Navis
- The dominant room capacity in Navis is 1 bedroom listings, making up 47.1% of the market. This suggests a strong demand for properties suitable for couples or solo travelers.
- Together, 1 bedroom and 3 bedrooms properties represent 64.7% of the active Airbnb listings in Navis, indicating a high concentration in these sizes.
- A significant 29.4% of listings offer 3+ bedrooms, catering to larger groups and families seeking more space in Navis.
Navis Vacation Rental Guest Capacity Trends (2025)
Distribution of Listings by Guest Capacity
Guest Capacity Insights for Navis
- The most common guest capacity trend in Navis vacation rentals is listings accommodating 4 guests (35.3%). This suggests the primary traveler segment is likely small families or groups.
- Properties designed for 4 guests and 8+ guests dominate the Navis STR market, accounting for 64.7% of listings.
- 35.3% of properties accommodate 6+ guests, serving the market segment for larger families or group travel in Navis.
- On average, properties in Navis are equipped to host 4.4 guests.
Navis Airbnb Booking Patterns (2025): Available vs. Booked Days
Available Days Distribution
Booked Days Distribution
Booking Pattern Insights for Navis
- The most common availability pattern in Navis falls within the 271-366 days range, representing 58.8% of listings. This suggests many properties have significant open periods on their calendars.
- Approximately 76.4% of listings show high availability (181+ days open annually), indicating potential for increased bookings or specific owner usage patterns.
- For booked days, the 31-90 days range is most frequent in Navis (52.9%), reflecting common guest stay durations or potential owner blocking patterns.
- A notable 23.5% of properties secure long booking periods (181+ days booked per year), highlighting successful long-term rental strategies or significant owner usage.
Navis Airbnb Minimum Stay Requirements Analysis
Distribution of Listings by Minimum Night Requirement
1 Night
3 listings
17.6% of total
2 Nights
2 listings
11.8% of total
3 Nights
1 listings
5.9% of total
4-6 Nights
1 listings
5.9% of total
30+ Nights
10 listings
58.8% of total
Key Insights
- The most prevalent minimum stay requirement in Navis is 30+ Nights, adopted by 58.8% of listings. This highlights the market's preference for longer commitments.
- A significant segment (58.8%) caters to monthly stays (30+ nights) in Navis, pointing to opportunities in the extended-stay market.
Recommendations
- Align with the market by considering a 30+ Nights minimum stay, as 58.8% of Navis hosts use this setting.
- If feasible, allowing 1-night stays, especially midweek or during low season, could capture last-minute bookings, as only 17.6% currently do.
- Explore offering discounts for stays of 30+ nights to attract the 58.8% of the market seeking extended stays.
- Adjust minimum nights based on seasonality – potentially shorter during low season and longer during peak demand periods in Navis.
Navis Airbnb Cancellation Policy Trends Analysis (2025)
Moderate
1 listings
5.9% of total
Firm
8 listings
47.1% of total
Strict
8 listings
47.1% of total
Cancellation Policy Insights for Navis
- The prevailing Airbnb cancellation policy trend in Navis is Firm, used by 47.1% of listings.
- A majority (94.2%) of hosts in Navis utilize Firm or Strict policies, indicating a market where hosts prioritize booking security.
Recommendations for Hosts
- Consider adopting a Firm policy to align with the 47.1% market standard in Navis.
- With 47.1% using Strict terms, this is a viable option in Navis, particularly for high-value properties or during peak demand periods.
- Regularly review your cancellation policy against competitors and market demand shifts in Navis.
Navis STR Booking Lead Time Analysis (2025)
Average Booking Lead Time by Month
Booking Lead Time Insights for Navis
- The overall average booking lead time for vacation rentals in Navis is 68 days.
- Guests book furthest in advance for stays during August (average 118 days), likely coinciding with peak travel demand or local events.
- The shortest booking windows occur for stays in November (average 42 days), indicating more last-minute travel plans during this time.
- Seasonally, Summer (97 days avg.) sees the longest lead times, while Spring (55 days avg.) has the shortest, reflecting typical travel planning cycles.
Recommendations for Hosts
- Use the overall average lead time (68 days) as a baseline for your pricing and availability strategy in Navis.
- For August stays, consider implementing length-of-stay discounts or slightly higher rates for bookings made less than 118 days out to capitalize on advance planning.
- Target marketing efforts for the Summer season well in advance (at least 97 days) to capture early planners.
- Monitor your own booking lead times against these Navis averages to identify opportunities for dynamic pricing adjustments.
Popular & Essential Airbnb Amenities in Navis (2025)
Amenity Prevalence
Amenity Insights for Navis
- Essential amenities in Navis that guests expect include: Hot water. Lacking these (this) could significantly impact bookings.
- Popular amenities like Wifi, Heating, Kitchen are common but not universal. Offering these can provide a competitive edge.
- Warning: Wifi is not universally provided but is considered essential globally. Ensure reliable Wifi is offered.
Recommendations for Hosts
- Ensure your listing includes all essential amenities for Navis: Hot water.
- Consider adding popular differentiators like Wifi or Heating to increase appeal.
- Highlight unique or less common amenities you offer (e.g., hot tub, dedicated workspace, EV charger) in your listing description and photos.
- Regularly check competitor amenities in Navis to stay competitive.
Navis Airbnb Guest Demographics & Profile Analysis (2025)
Guest Profile Summary for Navis
- The typical guest profile for Airbnb in Navis consists of predominantly international visitors (100%), with top international origins including Netherlands, typically belonging to the Post-2000s (Gen Z/Alpha) group (50%), primarily speaking English or German.
- Domestic travelers account for 0.0% of guests.
- Key international markets include Germany (70%) and Netherlands (6%).
- Top languages spoken are English (38.4%) followed by German (28.8%).
- A significant demographic segment is the Post-2000s (Gen Z/Alpha) group, representing 50% of guests.
Recommendations for Hosts
- Focus marketing internationally, particularly towards travelers from Netherlands.
- Tailor amenities and listing descriptions to appeal to the dominant Post-2000s (Gen Z/Alpha) demographic (e.g., highlight fast WiFi, smart home features, local guides).
- Highlight unique local experiences or amenities relevant to the primary guest profile.
- Consider seasonal promotions aligned with peak travel times for key origin markets.
Nearby Short-Term Rental Market Comparison
How does the Navis Airbnb market stack up against its neighbors? Compare key performance metrics like average monthly revenue, ADR, and occupancy rates in surrounding areas to understand the broader regional STR landscape.
| Market | Active Properties | Monthly Revenue | Daily Rate | Avg. Occupancy |
|---|---|---|---|---|
| Scheffau am Wilden Kaiser | 12 | $6,459 | $869.43 | 30% |
| Balderschwang | 10 | $5,025 | $294.90 | 60% |
| Urtijëi - St. Ulrich in Gröden - Ortisei | 174 | $4,679 | $699.91 | 38% |
| Sankt Pankraz - San Pancrazio | 15 | $4,569 | $695.58 | 24% |
| Moos in Passeier - Moso in Passiria | 18 | $4,304 | $582.93 | 24% |
| Bayrischzell | 40 | $4,245 | $397.58 | 35% |
| Krimml | 52 | $3,834 | $357.13 | 43% |
| Going am Wilden Kaiser | 26 | $3,819 | $423.43 | 37% |
| Cortina d'Ampezzo | 288 | $3,740 | $416.88 | 41% |
| Reith bei Kitzbühel | 46 | $3,698 | $365.04 | 40% |