Going am Wilden Kaiser Airbnb Market Analysis 2026: Short Term Rental Data & Vacation Rental Statistics in Bezirk Kitzbühel, Austria
Is Airbnb profitable in Going am Wilden Kaiser in 2026? Explore comprehensive Airbnb analytics for Going am Wilden Kaiser, Bezirk Kitzbühel, Austria to uncover income potential. This 2026 STR market report for Going am Wilden Kaiser, based on AirROI data from February 2025 to January 2026, reveals key trends in the niche market of 27 active listings.
Whether you're considering an Airbnb investment in Going am Wilden Kaiser, optimizing your existing vacation rental, or exploring rental arbitrage opportunities, understanding the Going am Wilden Kaiser Airbnb data is crucial. Leveraging the low regulation environment is key to maximizing your short term rental income potential. Let's dive into the specifics.
Key Going am Wilden Kaiser Airbnb Performance Metrics Overview
Monthly Airbnb Revenue Variations & Income Potential in Going am Wilden Kaiser (2026)
Understanding the monthly revenue variations for Airbnb listings in Going am Wilden Kaiser is key to maximizing your short term rental income potential. Seasonality significantly impacts earnings. Our analysis, based on data from the past 12 months, shows that the peak revenue month for STRs in Going am Wilden Kaiser is typically February, while June often presents the lowest earnings, highlighting opportunities for strategic pricing adjustments during shoulder and low seasons. Explore the typical Airbnb income in Going am Wilden Kaiser across different performance tiers:
- Best-in-class properties (Top 10%) achieve $10,568+ monthly, often utilizing dynamic pricing and superior guest experiences.
- Strong performing properties (Top 25%) earn $7,838 or more, indicating effective management and desirable locations/amenities.
- Typical properties (Median) generate around $4,039 per month, representing the average market performance.
- Entry-level properties (Bottom 25%) see earnings around $1,961, often with potential for optimization.
Average Monthly Airbnb Earnings Trend in Going am Wilden Kaiser
Going am Wilden Kaiser Airbnb Occupancy Rate Trends (2026)
Maximize your bookings by understanding the Going am Wilden Kaiser STR occupancy trends. Seasonal demand shifts significantly influence how often properties are booked. Typically, Februarysees the highest demand (peak season occupancy), while March experiences the lowest (low season). Effective strategies, like adjusting minimum stays or offering promotions, can boost occupancy during slower periods. Here's how different property tiers perform in Going am Wilden Kaiser:
- Best-in-class properties (Top 10%) achieve 73%+ occupancy, indicating high desirability and potentially optimized availability.
- Strong performing properties (Top 25%) maintain 53% or higher occupancy, suggesting good market fit and guest satisfaction.
- Typical properties (Median) have an occupancy rate around 33%.
- Entry-level properties (Bottom 25%) average 16% occupancy, potentially facing higher vacancy.
Average Monthly Occupancy Rate Trend in Going am Wilden Kaiser
Average Daily Rate (ADR) Airbnb Trends in Going am Wilden Kaiser (2026)
Effective short term rental pricing strategy in Going am Wilden Kaiser involves understanding monthly ADR fluctuations. The Average Daily Rate (ADR) for Airbnb in Going am Wilden Kaiser typically peaks in January and dips lowest during May. Leveraging Airbnb dynamic pricing tools or strategies based on this seasonality can significantly boost revenue. Here's a look at the typical nightly rates achieved:
- Best-in-class properties (Top 10%) command rates of $666+ per night, often due to premium features or locations.
- Strong performing properties (Top 25%) achieve nightly rates of $526 or more.
- Typical properties (Median) charge around $396 per night.
- Entry-level properties (Bottom 25%) earn around $209 per night.
Average Daily Rate (ADR) Trend by Month in Going am Wilden Kaiser
Get Live Going am Wilden Kaiser Market Intelligence 👇

Explore Real-time Analytics
Airbnb Seasonality Analysis & Trends in Going am Wilden Kaiser (2026)
Peak Season (February, August, July)
- Revenue averages $7,526 per month
- Occupancy rates average 53.3%
- Daily rates average $404
Shoulder Season
- Revenue averages $4,702 per month
- Occupancy maintains around 32.8%
- Daily rates hold near $398
Low Season (May, June, September)
- Revenue drops to average $3,771 per month
- Occupancy decreases to average 34.7%
- Daily rates adjust to average $363
Seasonality Insights for Going am Wilden Kaiser
- The Airbnb seasonality in Going am Wilden Kaiser shows highly seasonal trends requiring careful strategy. While the sections above show seasonal averages, it's also insightful to look at the extremes:
- During the high season, the absolute peak month showcases Going am Wilden Kaiser's highest earning potential, with monthly revenues capable of climbing to $9,849, occupancy reaching a high of 64.5%, and ADRs peaking at $462.
- Conversely, the slowest single month of the year, typically falling within the low season, marks the market's lowest point. In this month, revenue might dip to $3,761, occupancy could drop to 26.9%, and ADRs may adjust down to $347.
- Understanding both the seasonal averages and these monthly peaks and troughs in revenue, occupancy, and ADR is crucial for maximizing your Airbnb profit potential in Going am Wilden Kaiser.
Seasonal Strategies for Maximizing Profit
- Peak Season: Maximize revenue through premium pricing and potentially longer minimum stays. Ensure high availability.
- Low Season: Offer competitive pricing, special promotions (e.g., extended stay discounts), and flexible cancellation policies. Target off-season travelers like remote workers or budget-conscious guests.
- Shoulder Seasons: Implement dynamic pricing that balances peak and low rates. Target weekend travelers or specific events. Offer slightly more flexible terms than peak season.
- Regularly analyze your own performance against these Going am Wilden Kaiser seasonality benchmarks and adjust your pricing and availability strategy accordingly.
Best Areas for Airbnb Investment in Going am Wilden Kaiser (2026)
Exploring the top neighborhoods for short-term rentals in Going am Wilden Kaiser? This section highlights key areas, outlining why they are attractive for hosts and guests, along with notable local attractions. Consider these locations based on your target guest profile and investment strategy.
| Neighborhood / Area | Why Host Here? (Target Guests & Appeal) | Key Attractions & Landmarks |
|---|---|---|
| Ellmau | A charming village nestled in the Wilder Kaiser mountains, Ellmau offers stunning alpine scenery, making it a desirable location for ski holidays and summer hiking. It's well-connected to the ski lifts and has a variety of local amenities. | Ski resort (Ellmau - Skiwelt Wilder Kaiser-Brixental), Hiking trails, Golf course, Local restaurants and shops, Wellness centers |
| Going am Wilden Kaiser | Known for its picturesque landscapes and traditional Tyrolean architecture, Going am Wilden Kaiser is perfect for travelers looking for tranquility and nature. It features beautiful walking trails and is close to ski areas. | Wilder Kaiser mountain range, Hiking paths, Local Tyrolean dining, Kaiserliches Schloss (Imperial Castle), Natural swimming ponds |
| Söll | A lively village famous for its vibrant après-ski scene, Söll draws tourists year-round with hiking in the summer and skiing in the winter, providing numerous accommodations and entertainment options. | Ski resort (Söll - Skiwelt Wilder Kaiser-Brixental), Söll gondola lift, Hiking trails, Nightlife and bars, Family-friendly attractions |
| Scheffau am Wilden Kaiser | This quaint village is a hidden gem for those wanting a quiet escape in nature, yet still provides access to the larger Skiwelt area. Perfect for family-friendly stays and nature lovers. | Ski resort (Scheffau - Skiwelt Wilder Kaiser-Brixental), Hiking and biking trails, Small local shops, Natural parks |
| Fieberbrunn | Part of the Ski Circus, Fieberbrunn offers an exciting skiing experience and is renowned for its off-piste opportunities. Great for adventurous travelers and those wanting a mix of relaxation and sport. | Ski resort (Fieberbrunn - Ski Circus), Hiking opportunities, Riding opportunities, Family activities, Spa resorts |
| Kitzbühel | A world-famous ski resort town known for its rich history and luxury accommodations. Kitzbühel attracts high-end tourists, making it ideal for premium Airbnb hosts. | Hahnenkamm ski race, Kitzbühel Old Town, High-end shops and restaurants, Golf courses, Year-round events |
| Jochberg | Offering a peaceful retreat, Jochberg features a range of outdoor activities including skiing and hiking, ideal for families and those looking to escape the tourist crowds of more popular areas. | Ski resort (Jochberg - Skiwelt), Secluded hiking trails, Local farmers' markets, Wellness hotels |
| Westendorf | A picturesque village that serves as a gateway to the Kitzbühel Alps, Westendorf is attractive for both summer and winter tourism, with a friendly atmosphere and lots of ski amenities. | Ski resort (Westendorf - Skiwelt), Biking paths, Family-oriented events, Local festivals, Cozy mountain huts |
Understanding Airbnb License Requirements & STR Laws in Going am Wilden Kaiser (2026)
While Going am Wilden Kaiser, Bezirk Kitzbühel, Austria currently shows low STR regulations, specific Airbnb license requirements might still exist or change. Always verify the latest short term rental regulations and Airbnb license requirements directly with local government authorities for Going am Wilden Kaiser to ensure full compliance before hosting.
(Source: AirROI data, 2026, finding no licensed listings among those analyzed)
Top Performing Airbnb Properties in Going am Wilden Kaiser (2026)
Benchmark your potential! Explore examples of top-performing Airbnb properties in Going am Wilden Kaiserbased on Trailing Twelve Month (TTM) revenue. Analyze their characteristics, revenue, occupancy rate, and ADR to understand what drives success in this market.

GOING TRIPLE A apartment - WEST04
Entire Place • 3 bedrooms
GOING TRIPLE A apartments - EAST06
Entire Place • 2 bedrooms
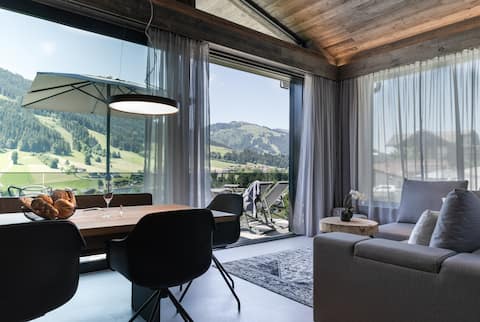
*Unique dream chalet for 9* by Belle Stay
Entire Place • 5 bedrooms
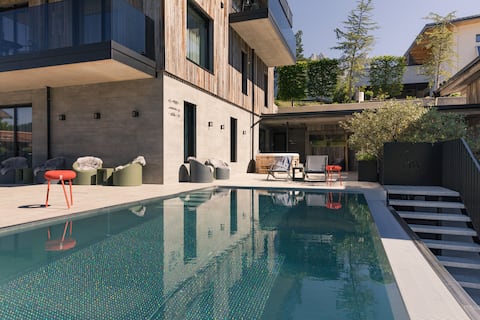
Chalet Belle Kaiser *New design chalet for 9 *
Entire Place • 4 bedrooms
GOING TRIPLE A apartments - WEST03
Entire Place • 2 bedrooms

Luxury Chalet: Sauna, Walk to Lift, Mountain Views
Entire Place • 3 bedrooms
Note: Performance varies based on location, size, amenities, seasonality, and management quality. Data reflects the past 12 months.
Top Performing Airbnb Hosts in Going am Wilden Kaiser (2026)
Learn from the best! This table showcases top-performing Airbnb hosts in Going am Wilden Kaiser based on the number of properties managed and estimated total revenue over the past year. Analyze their scale and performance metrics.
| Host Name | Properties | Grossing Revenue | Stay Reviews | Avg Rating |
|---|---|---|---|---|
| Jessica | 6 | $409,528 | 47 | 5.00/5.0 |
| Sven | 2 | $165,435 | 119 | 4.90/5.0 |
| Verena | 3 | $144,388 | 14 | 4.83/5.0 |
| Premium Estates Europe | 1 | $76,374 | 12 | 5.00/5.0 |
| Nicola | 1 | $68,284 | 25 | 4.88/5.0 |
| Lina | 1 | $56,508 | 171 | 4.89/5.0 |
| Elfi | 3 | $54,210 | 7 | 4.80/5.0 |
| Ingrid | 1 | $41,023 | 24 | 5.00/5.0 |
| Florian | 1 | $36,037 | 122 | 4.93/5.0 |
| Gerhard | 1 | $30,399 | 5 | 4.80/5.0 |
Analyzing the strategies of top hosts, such as their property selection, pricing, and guest communication, can offer valuable lessons for optimizing your own Airbnb operations in Going am Wilden Kaiser.
Dive Deeper: Advanced Going am Wilden Kaiser STR Market Data (2026)
Ready to unlock more insights? AirROI provides access to advanced metrics and comprehensive Airbnb data for Going am Wilden Kaiser. Explore detailed analytics beyond this report to refine your investment strategy, optimize pricing, and maximize your vacation rental profits.
Explore Advanced MetricsGoing am Wilden Kaiser Short-Term Rental Market Composition (2026): Property & Room Types
Room Type Distribution
Property Type Distribution
Market Composition Insights for Going am Wilden Kaiser
- The Going am Wilden Kaiser Airbnb market composition is heavily skewed towards Entire Home/Apt listings, which make up 92.6% of the 27 active rentals. This indicates strong guest preference for privacy and space.
- Looking at the property type distribution in Going am Wilden Kaiser, Apartment/Condo properties are the most common (63%), reflecting the local real estate landscape.
- Houses represent a significant 37% portion, catering likely to families or larger groups.
Going am Wilden Kaiser Airbnb Room Capacity Analysis (2026): Bedroom Distribution
Distribution of Listings by Number of Bedrooms
Room Capacity Insights for Going am Wilden Kaiser
- The dominant room capacity in Going am Wilden Kaiser is 2 bedrooms listings, making up 40.7% of the market. This suggests a strong demand for properties suitable for couples or solo travelers.
- Together, 2 bedrooms and 3 bedrooms properties represent 66.6% of the active Airbnb listings in Going am Wilden Kaiser, indicating a high concentration in these sizes.
- A significant 40.7% of listings offer 3+ bedrooms, catering to larger groups and families seeking more space in Going am Wilden Kaiser.
Going am Wilden Kaiser Vacation Rental Guest Capacity Trends (2026)
Distribution of Listings by Guest Capacity
Guest Capacity Insights for Going am Wilden Kaiser
- The most common guest capacity trend in Going am Wilden Kaiser vacation rentals is listings accommodating 4 guests (25.9%). This suggests the primary traveler segment is likely small families or groups.
- Properties designed for 4 guests and 6 guests dominate the Going am Wilden Kaiser STR market, accounting for 48.1% of listings.
- 40.7% of properties accommodate 6+ guests, serving the market segment for larger families or group travel in Going am Wilden Kaiser.
- On average, properties in Going am Wilden Kaiser are equipped to host 4.7 guests.
Going am Wilden Kaiser Airbnb Booking Patterns (2026): Available vs. Booked Days
Available Days Distribution
Booked Days Distribution
Booking Pattern Insights for Going am Wilden Kaiser
- The most common availability pattern in Going am Wilden Kaiser falls within the 271-366 days range, representing 59.3% of listings. This suggests many properties have significant open periods on their calendars.
- Approximately 88.9% of listings show high availability (181+ days open annually), indicating potential for increased bookings or specific owner usage patterns.
- For booked days, the 31-90 days range is most frequent in Going am Wilden Kaiser (44.4%), reflecting common guest stay durations or potential owner blocking patterns.
- A notable 11.1% of properties secure long booking periods (181+ days booked per year), highlighting successful long-term rental strategies or significant owner usage.
Going am Wilden Kaiser Airbnb Minimum Stay Requirements Analysis
Distribution of Listings by Minimum Night Requirement
1 Night
1 listings
3.7% of total
2 Nights
2 listings
7.4% of total
3 Nights
3 listings
11.1% of total
4-6 Nights
10 listings
37% of total
7-29 Nights
1 listings
3.7% of total
30+ Nights
10 listings
37% of total
Key Insights
- The most prevalent minimum stay requirement in Going am Wilden Kaiser is 4-6 Nights, adopted by 37% of listings. This highlights the market's preference for longer commitments.
- Very short stays (1-2 nights) are less common (11.1%), suggesting hosts prefer slightly longer bookings to optimize turnover.
- A significant segment (37%) caters to monthly stays (30+ nights) in Going am Wilden Kaiser, pointing to opportunities in the extended-stay market.
Recommendations
- Align with the market by considering a 4-6 Nights minimum stay, as 37% of Going am Wilden Kaiser hosts use this setting.
- If feasible, allowing 1-night stays, especially midweek or during low season, could capture last-minute bookings, as only 3.7% currently do.
- Explore offering discounts for stays of 30+ nights to attract the 37% of the market seeking extended stays.
- Adjust minimum nights based on seasonality – potentially shorter during low season and longer during peak demand periods in Going am Wilden Kaiser.
Going am Wilden Kaiser Airbnb Cancellation Policy Trends Analysis (2026)
Super Strict 30 Days
6 listings
22.2% of total
Moderate
10 listings
37% of total
Firm
9 listings
33.3% of total
Strict
2 listings
7.4% of total
Cancellation Policy Insights for Going am Wilden Kaiser
- The prevailing Airbnb cancellation policy trend in Going am Wilden Kaiser is Moderate, used by 37% of listings.
- There's a relatively balanced mix between guest-friendly (37.0%) and stricter (40.7%) policies, offering choices for different guest needs.
- Strict cancellation policies are quite rare (7.4%), potentially making listings with this policy less competitive unless justified by high demand or property type.
Recommendations for Hosts
- Consider adopting a Moderate policy to align with the 37% market standard in Going am Wilden Kaiser.
- Using a Strict policy might deter some guests, as only 7.4% of listings use it. Evaluate if potential revenue protection outweighs possible lower booking rates.
- Regularly review your cancellation policy against competitors and market demand shifts in Going am Wilden Kaiser.
Going am Wilden Kaiser STR Booking Lead Time Analysis (2026)
Average Booking Lead Time by Month
Booking Lead Time Insights for Going am Wilden Kaiser
- The overall average booking lead time for vacation rentals in Going am Wilden Kaiser is 123 days.
- Guests book furthest in advance for stays during December (average 164 days), likely coinciding with peak travel demand or local events.
- The shortest booking windows occur for stays in October (average 65 days), indicating more last-minute travel plans during this time.
- Seasonally, Winter (142 days avg.) sees the longest lead times, while Fall (89 days avg.) has the shortest, reflecting typical travel planning cycles.
Recommendations for Hosts
- Use the overall average lead time (123 days) as a baseline for your pricing and availability strategy in Going am Wilden Kaiser.
- For December stays, consider implementing length-of-stay discounts or slightly higher rates for bookings made less than 164 days out to capitalize on advance planning.
- Target marketing efforts for the Winter season well in advance (at least 142 days) to capture early planners.
- Monitor your own booking lead times against these Going am Wilden Kaiser averages to identify opportunities for dynamic pricing adjustments.
Popular & Essential Airbnb Amenities in Going am Wilden Kaiser (2026)
Amenity Prevalence
Amenity Insights for Going am Wilden Kaiser
- Essential amenities in Going am Wilden Kaiser that guests expect include: Kitchen, Wifi, Free parking on premises, TV. Lacking these (any) could significantly impact bookings.
- Popular amenities like Patio or balcony, Refrigerator, Heating are common but not universal. Offering these can provide a competitive edge.
Recommendations for Hosts
- Ensure your listing includes all essential amenities for Going am Wilden Kaiser: Kitchen, Wifi, Free parking on premises, TV.
- Prioritize adding missing essentials: Wifi, Free parking on premises, TV.
- Consider adding popular differentiators like Patio or balcony or Refrigerator to increase appeal.
- Highlight unique or less common amenities you offer (e.g., hot tub, dedicated workspace, EV charger) in your listing description and photos.
- Regularly check competitor amenities in Going am Wilden Kaiser to stay competitive.
Going am Wilden Kaiser Airbnb Guest Demographics & Profile Analysis (2026)
Guest Profile Summary for Going am Wilden Kaiser
- The typical guest profile for Airbnb in Going am Wilden Kaiser consists of predominantly international visitors (97%), with top international origins including Netherlands, typically belonging to the Post-2000s (Gen Z/Alpha) group (50%), primarily speaking English or German.
- Domestic travelers account for 2.6% of guests.
- Key international markets include Germany (56.4%) and Netherlands (12.8%).
- Top languages spoken are English (40%) followed by German (33.3%).
- A significant demographic segment is the Post-2000s (Gen Z/Alpha) group, representing 50% of guests.
Recommendations for Hosts
- Focus marketing internationally, particularly towards travelers from Netherlands.
- Tailor amenities and listing descriptions to appeal to the dominant Post-2000s (Gen Z/Alpha) demographic (e.g., highlight fast WiFi, smart home features, local guides).
- Highlight unique local experiences or amenities relevant to the primary guest profile.
- Consider seasonal promotions aligned with peak travel times for key origin markets.
Nearby Short-Term Rental Market Comparison
How does the Going am Wilden Kaiser Airbnb market stack up against its neighbors? Compare key performance metrics like average monthly revenue, ADR, and occupancy rates in surrounding areas to understand the broader regional STR landscape.
| Market | Active Properties | Monthly Revenue | Daily Rate | Avg. Occupancy |
|---|---|---|---|---|
| Scheffau am Wilden Kaiser | 12 | $6,669 | $906.83 | 30% |
| Sankt Pankraz - San Pancrazio | 12 | $6,528 | $633.65 | 29% |
| Urtijëi - St. Ulrich in Gröden - Ortisei | 172 | $5,054 | $718.33 | 41% |
| Hallstatt | 31 | $4,918 | $293.92 | 62% |
| Kiens - Chienes | 17 | $3,715 | $377.77 | 48% |
| Cortina d'Ampezzo | 309 | $3,646 | $474.12 | 40% |
| Kramsach | 12 | $3,573 | $272.32 | 48% |
| Bayrischzell | 41 | $3,550 | $389.91 | 33% |
| Krimml | 53 | $3,544 | $359.14 | 41% |
| Moos in Passeier - Moso in Passiria | 20 | $3,504 | $547.30 | 23% |