Weyregg am Attersee Airbnb Market Analysis 2026: Short Term Rental Data & Vacation Rental Statistics in Bezirk Vöcklabruck, Austria
Is Airbnb profitable in Weyregg am Attersee in 2026? Explore comprehensive Airbnb analytics for Weyregg am Attersee, Bezirk Vöcklabruck, Austria to uncover income potential. This 2026 STR market report for Weyregg am Attersee, based on AirROI data from December 2024 to November 2025, reveals key trends in the niche market of 18 active listings.
Whether you're considering an Airbnb investment in Weyregg am Attersee, optimizing your existing vacation rental, or exploring rental arbitrage opportunities, understanding the Weyregg am Attersee Airbnb data is crucial. Leveraging the low regulation environment is key to maximizing your short term rental income potential. Let's dive into the specifics.
Key Weyregg am Attersee Airbnb Performance Metrics Overview
Monthly Airbnb Revenue Variations & Income Potential in Weyregg am Attersee (2026)
Understanding the monthly revenue variations for Airbnb listings in Weyregg am Attersee is key to maximizing your short term rental income potential. Seasonality significantly impacts earnings. Our analysis, based on data from the past 12 months, shows that the peak revenue month for STRs in Weyregg am Attersee is typically August, while January often presents the lowest earnings, highlighting opportunities for strategic pricing adjustments during shoulder and low seasons. Explore the typical Airbnb income in Weyregg am Attersee across different performance tiers:
- Best-in-class properties (Top 10%) achieve $4,669+ monthly, often utilizing dynamic pricing and superior guest experiences.
- Strong performing properties (Top 25%) earn $2,998 or more, indicating effective management and desirable locations/amenities.
- Typical properties (Median) generate around $1,683 per month, representing the average market performance.
- Entry-level properties (Bottom 25%) see earnings around $922, often with potential for optimization.
Average Monthly Airbnb Earnings Trend in Weyregg am Attersee
Weyregg am Attersee Airbnb Occupancy Rate Trends (2026)
Maximize your bookings by understanding the Weyregg am Attersee STR occupancy trends. Seasonal demand shifts significantly influence how often properties are booked. Typically, Julysees the highest demand (peak season occupancy), while January experiences the lowest (low season). Effective strategies, like adjusting minimum stays or offering promotions, can boost occupancy during slower periods. Here's how different property tiers perform in Weyregg am Attersee:
- Best-in-class properties (Top 10%) achieve 68%+ occupancy, indicating high desirability and potentially optimized availability.
- Strong performing properties (Top 25%) maintain 56% or higher occupancy, suggesting good market fit and guest satisfaction.
- Typical properties (Median) have an occupancy rate around 39%.
- Entry-level properties (Bottom 25%) average 21% occupancy, potentially facing higher vacancy.
Average Monthly Occupancy Rate Trend in Weyregg am Attersee
Average Daily Rate (ADR) Airbnb Trends in Weyregg am Attersee (2026)
Effective short term rental pricing strategy in Weyregg am Attersee involves understanding monthly ADR fluctuations. The Average Daily Rate (ADR) for Airbnb in Weyregg am Attersee typically peaks in June and dips lowest during April. Leveraging Airbnb dynamic pricing tools or strategies based on this seasonality can significantly boost revenue. Here's a look at the typical nightly rates achieved:
- Best-in-class properties (Top 10%) command rates of $414+ per night, often due to premium features or locations.
- Strong performing properties (Top 25%) achieve nightly rates of $177 or more.
- Typical properties (Median) charge around $106 per night.
- Entry-level properties (Bottom 25%) earn around $90 per night.
Average Daily Rate (ADR) Trend by Month in Weyregg am Attersee
Get Live Weyregg am Attersee Market Intelligence 👇
Explore Real-time Analytics
Airbnb Seasonality Analysis & Trends in Weyregg am Attersee (2025)
Peak Season (August, July, June)
- Revenue averages $4,145 per month
- Occupancy rates average 68.5%
- Daily rates average $185
Shoulder Season
- Revenue averages $2,086 per month
- Occupancy maintains around 37.5%
- Daily rates hold near $167
Low Season (January, March, November)
- Revenue drops to average $1,106 per month
- Occupancy decreases to average 18.5%
- Daily rates adjust to average $162
Seasonality Insights for Weyregg am Attersee
- The Airbnb seasonality in Weyregg am Attersee shows highly seasonal trends requiring careful strategy. While the sections above show seasonal averages, it's also insightful to look at the extremes:
- During the high season, the absolute peak month showcases Weyregg am Attersee's highest earning potential, with monthly revenues capable of climbing to $4,759, occupancy reaching a high of 77.0%, and ADRs peaking at $186.
- Conversely, the slowest single month of the year, typically falling within the low season, marks the market's lowest point. In this month, revenue might dip to $695, occupancy could drop to 11.2%, and ADRs may adjust down to $157.
- Understanding both the seasonal averages and these monthly peaks and troughs in revenue, occupancy, and ADR is crucial for maximizing your Airbnb profit potential in Weyregg am Attersee.
Seasonal Strategies for Maximizing Profit
- Peak Season: Maximize revenue through premium pricing and potentially longer minimum stays. Ensure high availability.
- Low Season: Offer competitive pricing, special promotions (e.g., extended stay discounts), and flexible cancellation policies. Target off-season travelers like remote workers or budget-conscious guests.
- Shoulder Seasons: Implement dynamic pricing that balances peak and low rates. Target weekend travelers or specific events. Offer slightly more flexible terms than peak season.
- Regularly analyze your own performance against these Weyregg am Attersee seasonality benchmarks and adjust your pricing and availability strategy accordingly.
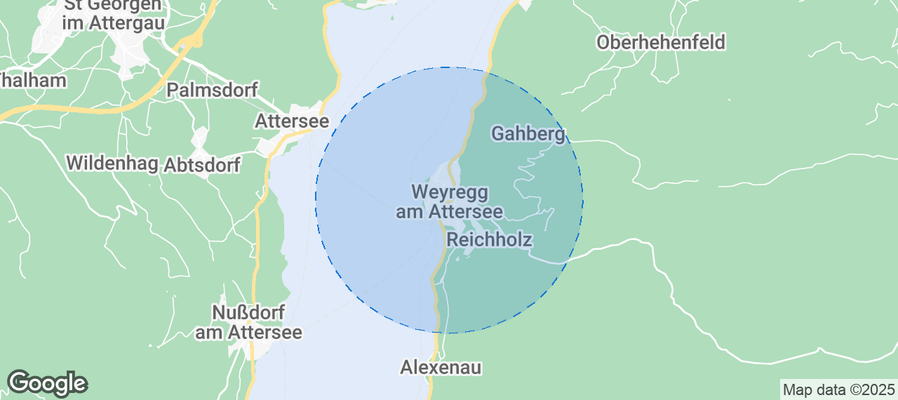
Best Areas for Airbnb Investment in Weyregg am Attersee (2026)
Exploring the top neighborhoods for short-term rentals in Weyregg am Attersee? This section highlights key areas, outlining why they are attractive for hosts and guests, along with notable local attractions. Consider these locations based on your target guest profile and investment strategy.
| Neighborhood / Area | Why Host Here? (Target Guests & Appeal) | Key Attractions & Landmarks |
|---|---|---|
| Attersee Lake | A stunning lake in the Salzkammergut region, known for its crystal-clear waters. Popular for water sports, hiking, and relaxation, attracting families and outdoor enthusiasts. | Attersee Lake, Hiking Trails, Water Sports, Local Restaurants, Boating, Fishing |
| Weyregg Village Center | The charming center of Weyregg offers quaint shops, local eateries, and a friendly atmosphere. Ideal for guests who want to experience local life and culture. | Church of Weyregg, Local Cafes, Village Events, Market Square, Scenic Walks |
| Seewalchen am Attersee | Close to Weyregg, this area provides more beach access and waterfront activities. A perfect spot for those looking to unwind by the water, enjoy beaches, and participate in various outdoor activities. | Beaches, Waterfront Restaurants, Hiking Trails, Scenic Views, Cycling |
| Altmünster | A picturesque town near Weyregg with beautiful lakeside views and a variety of recreational activities. It's appealing for visitors looking for nature and tranquility. | Altmünster Lake, Mount Grünberg, Hiking and Biking Trails, Local Events, Scenic Villages |
| Gmunden | A well-known town located at the northern end of Lake Traunsee, offering rich history, culture and stunning views. It's a cultural hub that attracts many tourists. | Gmunden Castle, Traunsee Lake, Historic Town Center, Ceramics Museum, Local Markets |
| Traunkirchen | A quiet lakeside community known for its peace and natural beauty. Suitable for those wanting to escape the hustle and bustle and enjoy nature. | Traunsee Lake, Hiking Trails, Tranquil Environment, Water Activities, Scenic Views |
| Bad Ischl | Historic spa town known for its imperial history and thermal baths. It complements a wellness-oriented experience for guests looking for relaxation and beauty. | Thermal Baths, Imperial Villa, Local Spa Facilities, Historic Sites, Cultural Events |
| St. Wolfgang | Renowned for its scenic beauty and glamorous lakeside attractions, attracting higher-end tourists looking for a picturesque escape. | Wolfgangsee Lake, Schafberg Railway, Historic Town Center, Beach Access, Hiking Opportunities |
Understanding Airbnb License Requirements & STR Laws in Weyregg am Attersee (2026)
While Weyregg am Attersee, Bezirk Vöcklabruck, Austria currently shows low STR regulations, specific Airbnb license requirements might still exist or change. Always verify the latest short term rental regulations and Airbnb license requirements directly with local government authorities for Weyregg am Attersee to ensure full compliance before hosting.
(Source: AirROI data, 2026, finding no licensed listings among those analyzed)
Top Performing Airbnb Properties in Weyregg am Attersee (2026)
Benchmark your potential! Explore examples of top-performing Airbnb properties in Weyregg am Atterseebased on Trailing Twelve Month (TTM) revenue. Analyze their characteristics, revenue, occupancy rate, and ADR to understand what drives success in this market.
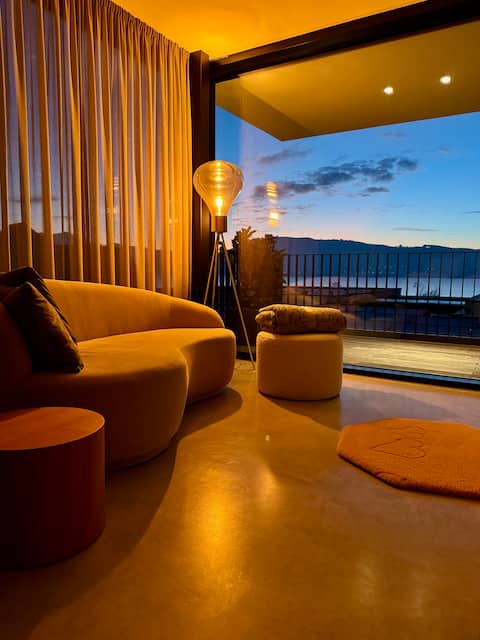
Adults Only: Deluxe Apt.2, Dachterrasse, Whirlpool
Entire Place • 1 bedroom
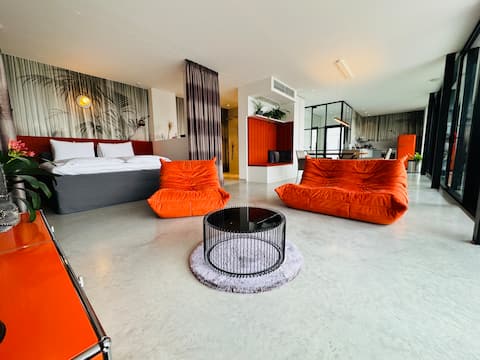
Adults Only: Deluxe Apt. 1, Terrasse, Whirlpool
Entire Place • 1 bedroom
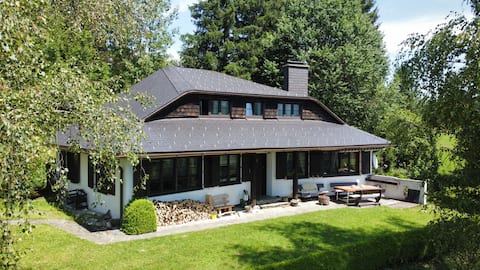
Cottage "far away and right in the middle"
Entire Place • 2 bedrooms
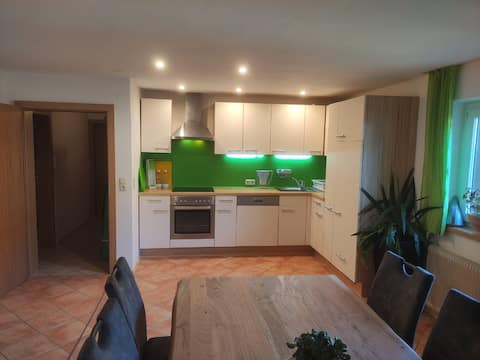
Apartment in Weyregg am Attersee
Entire Place • 2 bedrooms
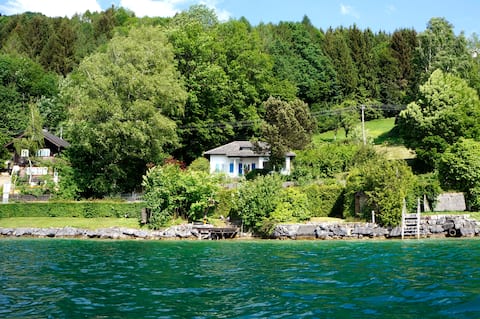
Charming vacation home & swimming area at Lake Attersee
Entire Place • 2 bedrooms
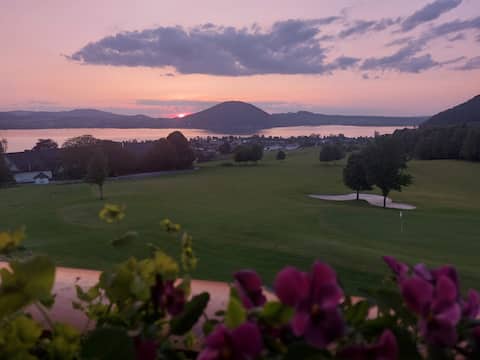
Beautiful stay in Weyregg am Attersee
Entire Place • 1 bedroom
Note: Performance varies based on location, size, amenities, seasonality, and management quality. Data reflects the past 12 months.
Top Performing Airbnb Hosts in Weyregg am Attersee (2026)
Learn from the best! This table showcases top-performing Airbnb hosts in Weyregg am Attersee based on the number of properties managed and estimated total revenue over the past year. Analyze their scale and performance metrics.
| Host Name | Properties | Grossing Revenue | Stay Reviews | Avg Rating |
|---|---|---|---|---|
| Eva | 2 | $113,293 | 48 | 4.94/5.0 |
| Jens & Iris | 1 | $35,107 | 72 | 4.99/5.0 |
| Christian | 1 | $32,605 | 14 | 5.00/5.0 |
| Petra | 1 | $29,676 | 83 | 4.67/5.0 |
| Familie Kronsteiner | 4 | $25,850 | 335 | 4.77/5.0 |
| Jana | 1 | $24,115 | 35 | 4.97/5.0 |
| Leila | 2 | $22,644 | 74 | 4.58/5.0 |
| Gregor Und Nadine | 1 | $16,048 | 26 | 4.85/5.0 |
| Karin | 1 | $14,963 | 147 | 4.97/5.0 |
| Christine | 3 | $9,673 | 68 | 4.91/5.0 |
Analyzing the strategies of top hosts, such as their property selection, pricing, and guest communication, can offer valuable lessons for optimizing your own Airbnb operations in Weyregg am Attersee.
Dive Deeper: Advanced Weyregg am Attersee STR Market Data (2026)
Ready to unlock more insights? AirROI provides access to advanced metrics and comprehensive Airbnb data for Weyregg am Attersee. Explore detailed analytics beyond this report to refine your investment strategy, optimize pricing, and maximize your vacation rental profits.
Explore Advanced MetricsWeyregg am Attersee Short-Term Rental Market Composition (2026): Property & Room Types
Room Type Distribution
Property Type Distribution
Market Composition Insights for Weyregg am Attersee
- The Weyregg am Attersee Airbnb market composition is heavily skewed towards Entire Home/Apt listings, which make up 100% of the 18 active rentals. This indicates strong guest preference for privacy and space.
- Looking at the property type distribution in Weyregg am Attersee, Apartment/Condo properties are the most common (77.8%), reflecting the local real estate landscape.
- Houses represent a significant 22.2% portion, catering likely to families or larger groups.
Weyregg am Attersee Airbnb Room Capacity Analysis (2026): Bedroom Distribution
Distribution of Listings by Number of Bedrooms
Room Capacity Insights for Weyregg am Attersee
- The dominant room capacity in Weyregg am Attersee is 2 bedrooms listings, making up 55.6% of the market. This suggests a strong demand for properties suitable for couples or solo travelers.
- Together, 2 bedrooms and 1 bedroom properties represent 100.0% of the active Airbnb listings in Weyregg am Attersee, indicating a high concentration in these sizes.
Weyregg am Attersee Vacation Rental Guest Capacity Trends (2026)
Distribution of Listings by Guest Capacity
Guest Capacity Insights for Weyregg am Attersee
- The most common guest capacity trend in Weyregg am Attersee vacation rentals is listings accommodating 4 guests (61.1%). This suggests the primary traveler segment is likely small families or groups.
- Properties designed for 4 guests and 2 guests dominate the Weyregg am Attersee STR market, accounting for 77.8% of listings.
- On average, properties in Weyregg am Attersee are equipped to host 3.8 guests.
Weyregg am Attersee Airbnb Booking Patterns (2026): Available vs. Booked Days
Available Days Distribution
Booked Days Distribution
Booking Pattern Insights for Weyregg am Attersee
- The most common availability pattern in Weyregg am Attersee falls within the 181-270 days range, representing 55.6% of listings. This suggests many properties have significant open periods on their calendars.
- Approximately 88.9% of listings show high availability (181+ days open annually), indicating potential for increased bookings or specific owner usage patterns.
- For booked days, the 91-180 days range is most frequent in Weyregg am Attersee (55.6%), reflecting common guest stay durations or potential owner blocking patterns.
- A notable 11.1% of properties secure long booking periods (181+ days booked per year), highlighting successful long-term rental strategies or significant owner usage.
Weyregg am Attersee Airbnb Minimum Stay Requirements Analysis
Distribution of Listings by Minimum Night Requirement
2 Nights
1 listings
5.6% of total
3 Nights
2 listings
11.1% of total
4-6 Nights
5 listings
27.8% of total
7-29 Nights
5 listings
27.8% of total
30+ Nights
5 listings
27.8% of total
Key Insights
- The most prevalent minimum stay requirement in Weyregg am Attersee is 4-6 Nights, adopted by 27.8% of listings. This highlights the market's preference for longer commitments.
- Very short stays (1-2 nights) are less common (5.6%), suggesting hosts prefer slightly longer bookings to optimize turnover.
- A significant segment (27.8%) caters to monthly stays (30+ nights) in Weyregg am Attersee, pointing to opportunities in the extended-stay market.
Recommendations
- Align with the market by considering a 4-6 Nights minimum stay, as 27.8% of Weyregg am Attersee hosts use this setting.
- Explore offering discounts for stays of 30+ nights to attract the 27.8% of the market seeking extended stays.
- Adjust minimum nights based on seasonality – potentially shorter during low season and longer during peak demand periods in Weyregg am Attersee.
Weyregg am Attersee Airbnb Cancellation Policy Trends Analysis (2026)
Flexible
1 listings
5.6% of total
Moderate
6 listings
33.3% of total
Firm
4 listings
22.2% of total
Strict
7 listings
38.9% of total
Cancellation Policy Insights for Weyregg am Attersee
- The prevailing Airbnb cancellation policy trend in Weyregg am Attersee is Strict, used by 38.9% of listings.
- A majority (61.1%) of hosts in Weyregg am Attersee utilize Firm or Strict policies, indicating a market where hosts prioritize booking security.
Recommendations for Hosts
- Consider adopting a Strict policy to align with the 38.9% market standard in Weyregg am Attersee.
- With 38.9% using Strict terms, this is a viable option in Weyregg am Attersee, particularly for high-value properties or during peak demand periods.
- Regularly review your cancellation policy against competitors and market demand shifts in Weyregg am Attersee.
Weyregg am Attersee STR Booking Lead Time Analysis (2026)
Average Booking Lead Time by Month
Booking Lead Time Insights for Weyregg am Attersee
- The overall average booking lead time for vacation rentals in Weyregg am Attersee is 88 days.
- Guests book furthest in advance for stays during July (average 165 days), likely coinciding with peak travel demand or local events.
- The shortest booking windows occur for stays in November (average 14 days), indicating more last-minute travel plans during this time.
- Seasonally, Summer (143 days avg.) sees the longest lead times, while Winter (43 days avg.) has the shortest, reflecting typical travel planning cycles.
Recommendations for Hosts
- Use the overall average lead time (88 days) as a baseline for your pricing and availability strategy in Weyregg am Attersee.
- For July stays, consider implementing length-of-stay discounts or slightly higher rates for bookings made less than 165 days out to capitalize on advance planning.
- During November, focus on last-minute booking availability and promotions, as guests book with very short notice (14 days avg.).
- Target marketing efforts for the Summer season well in advance (at least 143 days) to capture early planners.
- Monitor your own booking lead times against these Weyregg am Attersee averages to identify opportunities for dynamic pricing adjustments.
Popular & Essential Airbnb Amenities in Weyregg am Attersee (2026)
Amenity Prevalence
Amenity Insights for Weyregg am Attersee
- Essential amenities in Weyregg am Attersee that guests expect include: Kitchen, Free parking on premises. Lacking these (any) could significantly impact bookings.
- Popular amenities like Hot water, Wifi, Hair dryer are common but not universal. Offering these can provide a competitive edge.
- Warning: Wifi is not universally provided but is considered essential globally. Ensure reliable Wifi is offered.
Recommendations for Hosts
- Ensure your listing includes all essential amenities for Weyregg am Attersee: Kitchen, Free parking on premises.
- Consider adding popular differentiators like Hot water or Wifi to increase appeal.
- Highlight unique or less common amenities you offer (e.g., hot tub, dedicated workspace, EV charger) in your listing description and photos.
- Regularly check competitor amenities in Weyregg am Attersee to stay competitive.
Weyregg am Attersee Airbnb Guest Demographics & Profile Analysis (2026)
Guest Profile Summary for Weyregg am Attersee
- The typical guest profile for Airbnb in Weyregg am Attersee consists of predominantly international visitors (92%), with top international origins including Austria, typically belonging to the Post-2000s (Gen Z/Alpha) group (50%), primarily speaking English or German.
- Domestic travelers account for 8.5% of guests.
- Key international markets include Germany (63.8%) and Austria (8.5%).
- Top languages spoken are English (41.4%) followed by German (36.2%).
- A significant demographic segment is the Post-2000s (Gen Z/Alpha) group, representing 50% of guests.
Recommendations for Hosts
- Focus marketing internationally, particularly towards travelers from Austria.
- Tailor amenities and listing descriptions to appeal to the dominant Post-2000s (Gen Z/Alpha) demographic (e.g., highlight fast WiFi, smart home features, local guides).
- Highlight unique local experiences or amenities relevant to the primary guest profile.
- Consider seasonal promotions aligned with peak travel times for key origin markets.
Nearby Short-Term Rental Market Comparison
How does the Weyregg am Attersee Airbnb market stack up against its neighbors? Compare key performance metrics like average monthly revenue, ADR, and occupancy rates in surrounding areas to understand the broader regional STR landscape.
| Market | Active Properties | Monthly Revenue | Daily Rate | Avg. Occupancy |
|---|---|---|---|---|
| Scheffau am Wilden Kaiser | 12 | $6,915 | $915.91 | 30% |
| Hallstatt | 30 | $5,280 | $301.57 | 64% |
| Going am Wilden Kaiser | 26 | $3,939 | $424.72 | 38% |
| Krimml | 53 | $3,917 | $362.47 | 42% |
| Cortina d'Ampezzo | 300 | $3,834 | $443.64 | 40% |
| Reith bei Kitzbühel | 48 | $3,674 | $369.39 | 38% |
| Hof bei Salzburg | 21 | $3,470 | $308.56 | 50% |
| Kitzbühel | 161 | $3,424 | $433.74 | 35% |
| Colle Santa Lucia | 20 | $3,396 | $235.52 | 47% |
| Molln | 14 | $3,361 | $190.65 | 53% |