Anger Airbnb Market Analysis 2026: Short Term Rental Data & Vacation Rental Statistics in Salzburg, Austria
Is Airbnb profitable in Anger in 2026? Explore comprehensive Airbnb analytics for Anger, Salzburg, Austria to uncover income potential. This 2026 STR market report for Anger, based on AirROI data from February 2025 to January 2026, reveals key trends in the niche market of 48 active listings.
Whether you're considering an Airbnb investment in Anger, optimizing your existing vacation rental, or exploring rental arbitrage opportunities, understanding the Anger Airbnb data is crucial. Navigating the high regulation landscape is key to maximizing your short term rental income potential. Let's dive into the specifics.
Key Anger Airbnb Performance Metrics Overview
Monthly Airbnb Revenue Variations & Income Potential in Anger (2026)
Understanding the monthly revenue variations for Airbnb listings in Anger is key to maximizing your short term rental income potential. Seasonality significantly impacts earnings. Our analysis, based on data from the past 12 months, shows that the peak revenue month for STRs in Anger is typically February, while November often presents the lowest earnings, highlighting opportunities for strategic pricing adjustments during shoulder and low seasons. Explore the typical Airbnb income in Anger across different performance tiers:
- Best-in-class properties (Top 10%) achieve $3,536+ monthly, often utilizing dynamic pricing and superior guest experiences.
- Strong performing properties (Top 25%) earn $2,260 or more, indicating effective management and desirable locations/amenities.
- Typical properties (Median) generate around $1,273 per month, representing the average market performance.
- Entry-level properties (Bottom 25%) see earnings around $618, often with potential for optimization.
Average Monthly Airbnb Earnings Trend in Anger
Anger Airbnb Occupancy Rate Trends (2026)
Maximize your bookings by understanding the Anger STR occupancy trends. Seasonal demand shifts significantly influence how often properties are booked. Typically, Februarysees the highest demand (peak season occupancy), while November experiences the lowest (low season). Effective strategies, like adjusting minimum stays or offering promotions, can boost occupancy during slower periods. Here's how different property tiers perform in Anger:
- Best-in-class properties (Top 10%) achieve 62%+ occupancy, indicating high desirability and potentially optimized availability.
- Strong performing properties (Top 25%) maintain 46% or higher occupancy, suggesting good market fit and guest satisfaction.
- Typical properties (Median) have an occupancy rate around 27%.
- Entry-level properties (Bottom 25%) average 14% occupancy, potentially facing higher vacancy.
Average Monthly Occupancy Rate Trend in Anger
Average Daily Rate (ADR) Airbnb Trends in Anger (2026)
Effective short term rental pricing strategy in Anger involves understanding monthly ADR fluctuations. The Average Daily Rate (ADR) for Airbnb in Anger typically peaks in February and dips lowest during October. Leveraging Airbnb dynamic pricing tools or strategies based on this seasonality can significantly boost revenue. Here's a look at the typical nightly rates achieved:
- Best-in-class properties (Top 10%) command rates of $316+ per night, often due to premium features or locations.
- Strong performing properties (Top 25%) achieve nightly rates of $206 or more.
- Typical properties (Median) charge around $166 per night.
- Entry-level properties (Bottom 25%) earn around $126 per night.
Average Daily Rate (ADR) Trend by Month in Anger
Get Live Anger Market Intelligence 👇

Explore Real-time Analytics
Airbnb Seasonality Analysis & Trends in Anger (2026)
Peak Season (February, August, July)
- Revenue averages $2,742 per month
- Occupancy rates average 47.0%
- Daily rates average $192
Shoulder Season
- Revenue averages $1,404 per month
- Occupancy maintains around 27.8%
- Daily rates hold near $183
Low Season (October, November, December)
- Revenue drops to average $1,053 per month
- Occupancy decreases to average 22.4%
- Daily rates adjust to average $177
Seasonality Insights for Anger
- The Airbnb seasonality in Anger shows highly seasonal trends requiring careful strategy. While the sections above show seasonal averages, it's also insightful to look at the extremes:
- During the high season, the absolute peak month showcases Anger's highest earning potential, with monthly revenues capable of climbing to $3,658, occupancy reaching a high of 58.1%, and ADRs peaking at $210.
- Conversely, the slowest single month of the year, typically falling within the low season, marks the market's lowest point. In this month, revenue might dip to $782, occupancy could drop to 18.9%, and ADRs may adjust down to $167.
- Understanding both the seasonal averages and these monthly peaks and troughs in revenue, occupancy, and ADR is crucial for maximizing your Airbnb profit potential in Anger.
Seasonal Strategies for Maximizing Profit
- Peak Season: Maximize revenue through premium pricing and potentially longer minimum stays. Ensure high availability.
- Low Season: Offer competitive pricing, special promotions (e.g., extended stay discounts), and flexible cancellation policies. Target off-season travelers like remote workers or budget-conscious guests.
- Shoulder Seasons: Implement dynamic pricing that balances peak and low rates. Target weekend travelers or specific events. Offer slightly more flexible terms than peak season.
- Regularly analyze your own performance against these Anger seasonality benchmarks and adjust your pricing and availability strategy accordingly.
Best Areas for Airbnb Investment in Anger (2026)
Exploring the top neighborhoods for short-term rentals in Anger? This section highlights key areas, outlining why they are attractive for hosts and guests, along with notable local attractions. Consider these locations based on your target guest profile and investment strategy.
| Neighborhood / Area | Why Host Here? (Target Guests & Appeal) | Key Attractions & Landmarks |
|---|---|---|
| Old Town (Altstadt) | The historical heart of Salzburg, famous for its baroque architecture, charming streets, and cultural events. A prime location for tourists seeking the rich history and beauty of the city. | Mozart's Birthplace, Salzburg Cathedral, Hohensalzburg Fortress, Mirabell Palace and Gardens, Getreidegasse, Hellbrunn Palace |
| Leopoldskron | A picturesque neighborhood known for its beautiful palace and lake, as well as its close proximity to the Old Town. Ideal for those looking for serene views and easy access to the main attractions. | Leopoldskron Palace, Leopoldskroner Weiher, Moosstraße, Walking trails around the lake, The Sound of Music filming locations |
| Aigen | A quiet, residential area that offers a more local experience while being only a short distance from the city center. Attractive for families and longer-stay guests. | Aigen Manor, Salzburg Zoo, The Salzach River, Nearby hiking trails, St. Peter's Abbey |
| Nonntal | A charming district with a blend of historical and modern elements, known for its artistic vibe and close community feel. Popular among those seeking a cultural experience. | Holy Trinity Church, Museum der Moderne Salzburg, platz der Menschenrechte, Nearby hiking paths to Gaisberg, The Nonntal River |
| Maxglan | A family-friendly neighborhood that is close to the city yet retains a residential atmosphere. Great for those looking to experience local life. | Silencer Museum, Kieferstraße Market, Nearby parks, The Gaisberg Mountain trails, Salzburg Airport |
| Schallmoos | An up-and-coming area with a mix of local cafés, shops, and cultural spots. Attracts younger travelers and those in search of a vibrant atmosphere. | St. Sebastian Church, Salzburg Museum, Local art galleries, Food markets, Nightlife venues |
| Itzling | A peaceful area known for its green spaces and proximity to educational institutions. Great for longer stays and families looking for quiet accommodations. | Landschaftspark, Artificial lake at Itzlinger Wiese, Local parks, Public transport access to the city center, Nearby hiking trails |
| Riedenburg | A quaint neighborhood with stunning views of the fortress and city, ideal for those wanting a mix of residential comfort and tourist appeal. | Fortress Hohensalzburg, Nonnberg Abbey, Furtwängler Park, Cultural events in nearby squares, Walking paths with scenic views |
Understanding Airbnb License Requirements & STR Laws in Anger (2026)
Yes, Anger, Salzburg, Austria enforces high STR regulations. Obtaining a license and ensuring compliance is almost certainly required according to current 2026 STR laws. Always verify the latest short term rental regulations and Airbnb license requirements directly with local government authorities for Anger to ensure full compliance before hosting.
(Source: AirROI data, 2026, based on 58% licensed listings)
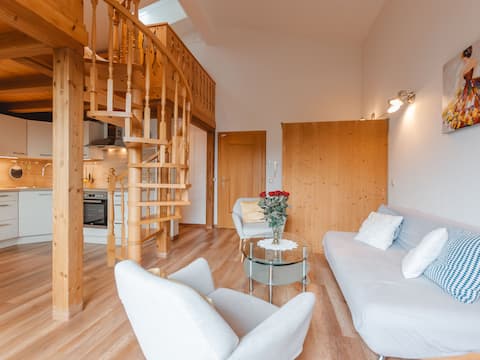
Top Performing Airbnb Properties in Anger (2026)
Benchmark your potential! Explore examples of top-performing Airbnb properties in Angerbased on Trailing Twelve Month (TTM) revenue. Analyze their characteristics, revenue, occupancy rate, and ADR to understand what drives success in this market.
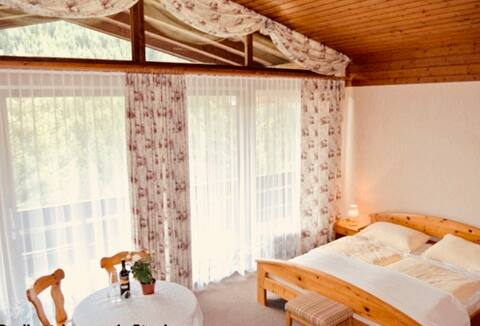
Angeralm self-catering cabin for up to 25 people.
Entire Place • 8 bedrooms
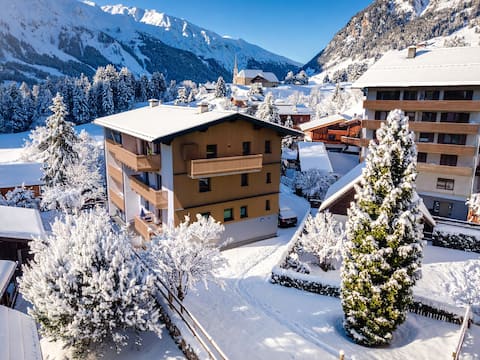
Stylishly furnished near city centre in quiet ne
Entire Place • 2 bedrooms
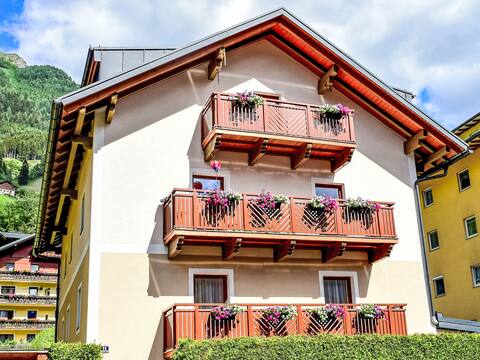
Sattlerweg by Interhome
Entire Place • 1 bedroom
Anna-Katharina by Interhome
Entire Place • N/A

Selma by Interhome
Entire Place • 3 bedrooms

Stylish and high-quality finished flat
Entire Place • 2 bedrooms
Note: Performance varies based on location, size, amenities, seasonality, and management quality. Data reflects the past 12 months.
Top Performing Airbnb Hosts in Anger (2026)
Learn from the best! This table showcases top-performing Airbnb hosts in Anger based on the number of properties managed and estimated total revenue over the past year. Analyze their scale and performance metrics.
| Host Name | Properties | Grossing Revenue | Stay Reviews | Avg Rating |
|---|---|---|---|---|
| Christoph - Interhome | 12 | $126,420 | 75 | 4.20/5.0 |
| Christoph - Interhome | 6 | $114,306 | 68 | 4.57/5.0 |
| Sybrand | 3 | $69,082 | 24 | 4.80/5.0 |
| Katharina | 1 | $60,570 | 19 | 4.21/5.0 |
| Dina | 7 | $47,553 | 39 | 4.86/5.0 |
| Dr. Torsten | 2 | $26,783 | 17 | 4.75/5.0 |
| Dragica | 4 | $26,233 | 77 | 4.83/5.0 |
| Kathrin | 1 | $20,914 | 15 | 4.93/5.0 |
| Dominique | 1 | $17,208 | 17 | 4.71/5.0 |
| Alexandra | 1 | $16,545 | 94 | 4.95/5.0 |
Analyzing the strategies of top hosts, such as their property selection, pricing, and guest communication, can offer valuable lessons for optimizing your own Airbnb operations in Anger.
Dive Deeper: Advanced Anger STR Market Data (2026)
Ready to unlock more insights? AirROI provides access to advanced metrics and comprehensive Airbnb data for Anger. Explore detailed analytics beyond this report to refine your investment strategy, optimize pricing, and maximize your vacation rental profits.
Explore Advanced MetricsAnger Short-Term Rental Market Composition (2026): Property & Room Types
Room Type Distribution
Property Type Distribution
Market Composition Insights for Anger
- The Anger Airbnb market composition is heavily skewed towards Entire Home/Apt listings, which make up 87.5% of the 48 active rentals. This indicates strong guest preference for privacy and space.
- Looking at the property type distribution in Anger, Apartment/Condo properties are the most common (79.2%), reflecting the local real estate landscape.
- The presence of 6.3% Hotel/Boutique listings indicates integration with traditional hospitality.
- Smaller segments like outdoor/unique (combined 2.1%) offer potential for unique stay experiences.
Anger Airbnb Room Capacity Analysis (2026): Bedroom Distribution
Distribution of Listings by Number of Bedrooms
Room Capacity Insights for Anger
- The dominant room capacity in Anger is 1 bedroom listings, making up 37.5% of the market. This suggests a strong demand for properties suitable for couples or solo travelers.
- Together, 1 bedroom and 2 bedrooms properties represent 64.6% of the active Airbnb listings in Anger, indicating a high concentration in these sizes.
Anger Vacation Rental Guest Capacity Trends (2026)
Distribution of Listings by Guest Capacity
Guest Capacity Insights for Anger
- The most common guest capacity trend in Anger vacation rentals is listings accommodating 4 guests (37.5%). This suggests the primary traveler segment is likely small families or groups.
- Properties designed for 4 guests and 6 guests dominate the Anger STR market, accounting for 52.1% of listings.
- 20.9% of properties accommodate 6+ guests, serving the market segment for larger families or group travel in Anger.
- On average, properties in Anger are equipped to host 3.8 guests.
Anger Airbnb Booking Patterns (2026): Available vs. Booked Days
Available Days Distribution
Booked Days Distribution
Booking Pattern Insights for Anger
- The most common availability pattern in Anger falls within the 271-366 days range, representing 70.8% of listings. This suggests many properties have significant open periods on their calendars.
- Approximately 93.7% of listings show high availability (181+ days open annually), indicating potential for increased bookings or specific owner usage patterns.
- For booked days, the 31-90 days range is most frequent in Anger (37.5%), reflecting common guest stay durations or potential owner blocking patterns.
- A notable 6.3% of properties secure long booking periods (181+ days booked per year), highlighting successful long-term rental strategies or significant owner usage.
Anger Airbnb Minimum Stay Requirements Analysis
Distribution of Listings by Minimum Night Requirement
1 Night
1 listings
2.1% of total
2 Nights
5 listings
10.4% of total
3 Nights
2 listings
4.2% of total
4-6 Nights
4 listings
8.3% of total
30+ Nights
36 listings
75% of total
Key Insights
- The most prevalent minimum stay requirement in Anger is 30+ Nights, adopted by 75% of listings. This highlights the market's preference for longer commitments.
- Very short stays (1-2 nights) are less common (12.5%), suggesting hosts prefer slightly longer bookings to optimize turnover.
- A significant segment (75%) caters to monthly stays (30+ nights) in Anger, pointing to opportunities in the extended-stay market.
Recommendations
- Align with the market by considering a 30+ Nights minimum stay, as 75% of Anger hosts use this setting.
- If feasible, allowing 1-night stays, especially midweek or during low season, could capture last-minute bookings, as only 2.1% currently do.
- Explore offering discounts for stays of 30+ nights to attract the 75% of the market seeking extended stays.
- Adjust minimum nights based on seasonality – potentially shorter during low season and longer during peak demand periods in Anger.
Anger Airbnb Cancellation Policy Trends Analysis (2026)
Super Strict 30 Days
3 listings
6.3% of total
Flexible
2 listings
4.2% of total
Moderate
7 listings
14.6% of total
Firm
31 listings
64.6% of total
Strict
5 listings
10.4% of total
Cancellation Policy Insights for Anger
- The prevailing Airbnb cancellation policy trend in Anger is Firm, used by 64.6% of listings.
- A majority (75.0%) of hosts in Anger utilize Firm or Strict policies, indicating a market where hosts prioritize booking security.
Recommendations for Hosts
- Consider adopting a Firm policy to align with the 64.6% market standard in Anger.
- Using a Strict policy might deter some guests, as only 10.4% of listings use it. Evaluate if potential revenue protection outweighs possible lower booking rates.
- Regularly review your cancellation policy against competitors and market demand shifts in Anger.
Anger STR Booking Lead Time Analysis (2026)
Average Booking Lead Time by Month
Booking Lead Time Insights for Anger
- The overall average booking lead time for vacation rentals in Anger is 76 days.
- Guests book furthest in advance for stays during January (average 124 days), likely coinciding with peak travel demand or local events.
- The shortest booking windows occur for stays in June (average 27 days), indicating more last-minute travel plans during this time.
- Seasonally, Winter (101 days avg.) sees the longest lead times, while Spring (48 days avg.) has the shortest, reflecting typical travel planning cycles.
Recommendations for Hosts
- Use the overall average lead time (76 days) as a baseline for your pricing and availability strategy in Anger.
- For January stays, consider implementing length-of-stay discounts or slightly higher rates for bookings made less than 124 days out to capitalize on advance planning.
- Target marketing efforts for the Winter season well in advance (at least 101 days) to capture early planners.
- Monitor your own booking lead times against these Anger averages to identify opportunities for dynamic pricing adjustments.
Popular & Essential Airbnb Amenities in Anger (2026)
Amenity Prevalence
Amenity Insights for Anger
- Essential amenities in Anger that guests expect include: Heating. Lacking these (this) could significantly impact bookings.
- Popular amenities like Kitchen, TV, Hangers are common but not universal. Offering these can provide a competitive edge.
Recommendations for Hosts
- Ensure your listing includes all essential amenities for Anger: Heating.
- Consider adding popular differentiators like Kitchen or TV to increase appeal.
- Highlight unique or less common amenities you offer (e.g., hot tub, dedicated workspace, EV charger) in your listing description and photos.
- Regularly check competitor amenities in Anger to stay competitive.
Anger Airbnb Guest Demographics & Profile Analysis (2026)
Guest Profile Summary for Anger
- The typical guest profile for Airbnb in Anger consists of predominantly international visitors (87%), with top international origins including Austria, typically belonging to the Post-2000s (Gen Z/Alpha) group (50%), primarily speaking English or German.
- Domestic travelers account for 12.9% of guests.
- Key international markets include Germany (29.4%) and Austria (12.9%).
- Top languages spoken are English (37.5%) followed by German (18.2%).
- A significant demographic segment is the Post-2000s (Gen Z/Alpha) group, representing 50% of guests.
Recommendations for Hosts
- Focus marketing internationally, particularly towards travelers from Austria.
- Tailor amenities and listing descriptions to appeal to the dominant Post-2000s (Gen Z/Alpha) demographic (e.g., highlight fast WiFi, smart home features, local guides).
- Highlight unique local experiences or amenities relevant to the primary guest profile.
- Consider seasonal promotions aligned with peak travel times for key origin markets.
Nearby Short-Term Rental Market Comparison
How does the Anger Airbnb market stack up against its neighbors? Compare key performance metrics like average monthly revenue, ADR, and occupancy rates in surrounding areas to understand the broader regional STR landscape.
| Market | Active Properties | Monthly Revenue | Daily Rate | Avg. Occupancy |
|---|---|---|---|---|
| Scheffau am Wilden Kaiser | 12 | $6,669 | $906.83 | 30% |
| Hallstatt | 31 | $4,918 | $293.92 | 62% |
| Cortina d'Ampezzo | 309 | $3,646 | $474.12 | 40% |
| Going am Wilden Kaiser | 27 | $3,596 | $406.50 | 37% |
| Bayrischzell | 41 | $3,550 | $389.91 | 33% |
| Krimml | 53 | $3,544 | $359.14 | 41% |
| Hof bei Salzburg | 21 | $3,403 | $301.21 | 49% |
| Reith bei Kitzbühel | 49 | $3,385 | $356.25 | 34% |
| Colle Santa Lucia | 21 | $3,353 | $248.56 | 46% |
| Unterach am Attersee | 16 | $3,220 | $285.15 | 43% |