Palfen Airbnb Market Analysis 2026: Short Term Rental Data & Vacation Rental Statistics in Salzburg, Austria
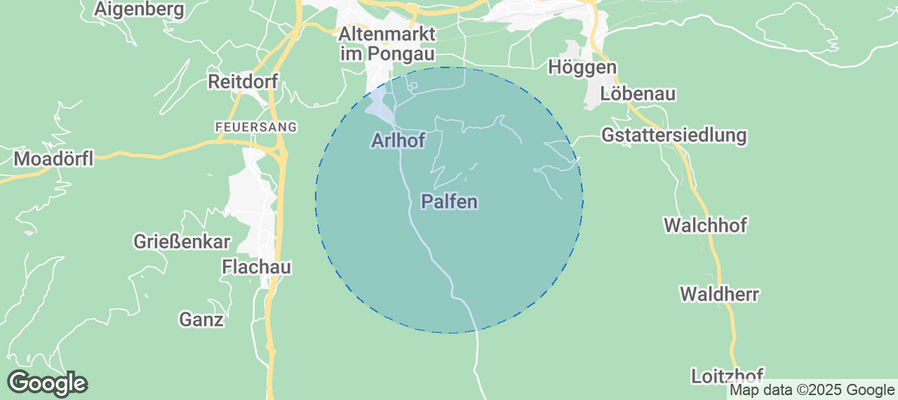
Is Airbnb profitable in Palfen in 2026? Explore comprehensive Airbnb analytics for Palfen, Salzburg, Austria to uncover income potential. This 2026 STR market report for Palfen, based on AirROI data from May 2024 to April 2025, reveals key trends in the niche market of 16 active listings.
Whether you're considering an Airbnb investment in Palfen, optimizing your existing vacation rental, or exploring rental arbitrage opportunities, understanding the Palfen Airbnb data is crucial. Navigating the high regulation landscape is key to maximizing your short term rental income potential. Let's dive into the specifics.
Key Palfen Airbnb Performance Metrics Overview
Monthly Airbnb Revenue Variations & Income Potential in Palfen (2026)
Understanding the monthly revenue variations for Airbnb listings in Palfen is key to maximizing your short term rental income potential. Seasonality significantly impacts earnings. Our analysis, based on data from the past 12 months, shows that the peak revenue month for STRs in Palfen is typically January, while November often presents the lowest earnings, highlighting opportunities for strategic pricing adjustments during shoulder and low seasons. Explore the typical Airbnb income in Palfen across different performance tiers:
- Best-in-class properties (Top 10%) achieve $5,046+ monthly, often utilizing dynamic pricing and superior guest experiences.
- Strong performing properties (Top 25%) earn $2,961 or more, indicating effective management and desirable locations/amenities.
- Typical properties (Median) generate around $1,744 per month, representing the average market performance.
- Entry-level properties (Bottom 25%) see earnings around $988, often with potential for optimization.
Average Monthly Airbnb Earnings Trend in Palfen
Palfen Airbnb Occupancy Rate Trends (2026)
Maximize your bookings by understanding the Palfen STR occupancy trends. Seasonal demand shifts significantly influence how often properties are booked. Typically, Januarysees the highest demand (peak season occupancy), while November experiences the lowest (low season). Effective strategies, like adjusting minimum stays or offering promotions, can boost occupancy during slower periods. Here's how different property tiers perform in Palfen:
- Best-in-class properties (Top 10%) achieve 72%+ occupancy, indicating high desirability and potentially optimized availability.
- Strong performing properties (Top 25%) maintain 50% or higher occupancy, suggesting good market fit and guest satisfaction.
- Typical properties (Median) have an occupancy rate around 31%.
- Entry-level properties (Bottom 25%) average 18% occupancy, potentially facing higher vacancy.
Average Monthly Occupancy Rate Trend in Palfen
Average Daily Rate (ADR) Airbnb Trends in Palfen (2026)
Effective short term rental pricing strategy in Palfen involves understanding monthly ADR fluctuations. The Average Daily Rate (ADR) for Airbnb in Palfen typically peaks in January and dips lowest during June. Leveraging Airbnb dynamic pricing tools or strategies based on this seasonality can significantly boost revenue. Here's a look at the typical nightly rates achieved:
- Best-in-class properties (Top 10%) command rates of $478+ per night, often due to premium features or locations.
- Strong performing properties (Top 25%) achieve nightly rates of $254 or more.
- Typical properties (Median) charge around $157 per night.
- Entry-level properties (Bottom 25%) earn around $119 per night.
Average Daily Rate (ADR) Trend by Month in Palfen
Get Live Palfen Market Intelligence 👇
Explore Real-time Analytics
Airbnb Seasonality Analysis & Trends in Palfen (2025)
Peak Season (January, February, July)
- Revenue averages $4,442 per month
- Occupancy rates average 58.2%
- Daily rates average $237
Shoulder Season
- Revenue averages $2,185 per month
- Occupancy maintains around 34.6%
- Daily rates hold near $223
Low Season (May, October, November)
- Revenue drops to average $1,101 per month
- Occupancy decreases to average 22.5%
- Daily rates adjust to average $215
Seasonality Insights for Palfen
- The Airbnb seasonality in Palfen shows highly seasonal trends requiring careful strategy. While the sections above show seasonal averages, it's also insightful to look at the extremes:
- During the high season, the absolute peak month showcases Palfen's highest earning potential, with monthly revenues capable of climbing to $5,520, occupancy reaching a high of 67.3%, and ADRs peaking at $246.
- Conversely, the slowest single month of the year, typically falling within the low season, marks the market's lowest point. In this month, revenue might dip to $1,002, occupancy could drop to 16.1%, and ADRs may adjust down to $211.
- Understanding both the seasonal averages and these monthly peaks and troughs in revenue, occupancy, and ADR is crucial for maximizing your Airbnb profit potential in Palfen.
Seasonal Strategies for Maximizing Profit
- Peak Season: Maximize revenue through premium pricing and potentially longer minimum stays. Ensure high availability.
- Low Season: Offer competitive pricing, special promotions (e.g., extended stay discounts), and flexible cancellation policies. Target off-season travelers like remote workers or budget-conscious guests.
- Shoulder Seasons: Implement dynamic pricing that balances peak and low rates. Target weekend travelers or specific events. Offer slightly more flexible terms than peak season.
- Regularly analyze your own performance against these Palfen seasonality benchmarks and adjust your pricing and availability strategy accordingly.
Best Areas for Airbnb Investment in Palfen (2026)
Exploring the top neighborhoods for short-term rentals in Palfen? This section highlights key areas, outlining why they are attractive for hosts and guests, along with notable local attractions. Consider these locations based on your target guest profile and investment strategy.
| Neighborhood / Area | Why Host Here? (Target Guests & Appeal) | Key Attractions & Landmarks |
|---|---|---|
| Old Town (Altstadt) | The historic center of Salzburg, famous for its stunning baroque architecture and rich cultural heritage. It attracts tourists visiting Mozart's birthplace and UNESCO World Heritage sites. | Mozart's Birthplace, Salzburg Cathedral, Hohensalzburg Fortress, Getreidegasse, Mirabell Palace and Gardens |
| Aigen | A charming and residential district of Salzburg, known for its parks and proximity to the Salzach River. It offers a peaceful atmosphere while still being close to the city center, appealing to families and nature-lovers. | Aigen Botanical Garden, Schloss Aigen, Salzach river walks, Tiergarten Hellbrunn |
| Lehen | An up-and-coming area that features modern amenities and is popular among locals. It's close to transportation and shopping, making it attractive for business travelers as well as tourists. | Shopping Center Lehen, Salzburg Arena, Plaza, Salzach river paths |
| Elisabeth-Vorstadt | Located near the main train station, this district is strategic for travelers arriving by rail. It's a mix of residential and commercial areas, with a variety of restaurants and cafes. | Mirabell Gardens, Augustiner Bräu, Salzburg Central Station, Gallery of Modern Art |
| Maxglan | A quiet residential area with a mix of local charm and convenient access to the city. Known for its parks and lovely views, it's ideal for guests seeking a cosy neighborhood experience. | Maxglan Park, Maria Plain, Heilig Geist Church |
| Parsch | Nestled between hills and meadows, it's perfect for travelers who enjoy outdoor activities. The area is scenic and has access to hiking trails while being a short distance from the city center. | Untersberg, St. Peter's Abbey, Hiking routes, Hellbrunn Palace |
| Nonntal | A peaceful and family-friendly area, home to several educational institutions and next to the beautiful Nonnberg Monastery. It offers a blend of local life and tourist attractions. | Nonnberg Abbey, St. Peter's Cemetery, Kapuzinerberg |
| Schallmoos | A vibrant neighborhood that reflects Salzburg's contemporary life, with a mix of traditional Austrian and modern eateries, and close to the city center amenities. | Europark Shopping Center, Schallmoos Park, Cafés and restaurants |
Understanding Airbnb License Requirements & STR Laws in Palfen (2026)
Yes, Palfen, Salzburg, Austria enforces high STR regulations. Obtaining a license and ensuring compliance is almost certainly required according to current 2026 STR laws. Always verify the latest short term rental regulations and Airbnb license requirements directly with local government authorities for Palfen to ensure full compliance before hosting.
(Source: AirROI data, 2026, based on 38% licensed listings)
Top Performing Airbnb Properties in Palfen (2026)
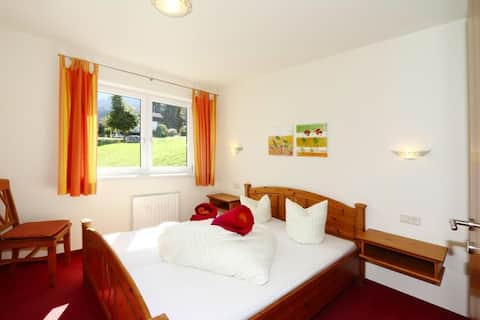
Benchmark your potential! Explore examples of top-performing Airbnb properties in Palfenbased on Trailing Twelve Month (TTM) revenue. Analyze their characteristics, revenue, occupancy rate, and ADR to understand what drives success in this market.
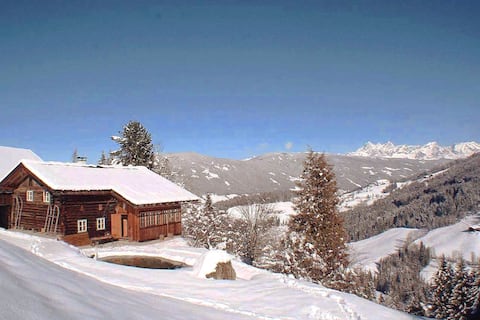
Artsy Alpine Retreat
Entire Place • 4 bedrooms
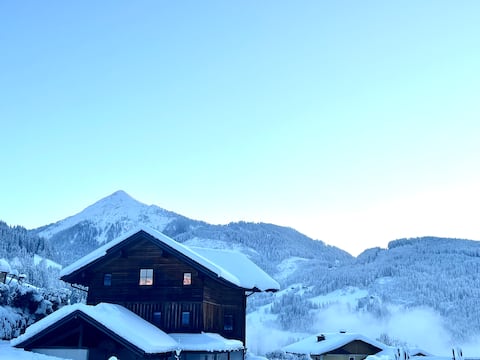
Ferienhaus Alpenfee
Entire Place • 4 bedrooms

Appartement Eckwald Altenmarkt-Zauchensee
Entire Place • N/A

Apartment Radstadt Skiwelt quiet central farm
Entire Place • 3 bedrooms
Apartment house Isegrim, Altenmarkt
Entire Place • 1 bedroom
Apartment Waldplatzl
Entire Place • 2 bedrooms
Note: Performance varies based on location, size, amenities, seasonality, and management quality. Data reflects the past 12 months.
Top Performing Airbnb Hosts in Palfen (2026)
Learn from the best! This table showcases top-performing Airbnb hosts in Palfen based on the number of properties managed and estimated total revenue over the past year. Analyze their scale and performance metrics.
| Host Name | Properties | Grossing Revenue | Stay Reviews | Avg Rating |
|---|---|---|---|---|
| Christoph | 1 | $63,342 | 32 | 4.97/5.0 |
| Host #189003786 | 1 | $58,722 | 1 | 0.00/5.0 |
| Ria Belvilla | 2 | $35,779 | 17 | 4.72/5.0 |
| Nathalie | 1 | $23,675 | 75 | 4.92/5.0 |
| Annelies | 1 | $23,054 | 63 | 4.78/5.0 |
| Michaela | 1 | $17,343 | 3 | 5.00/5.0 |
| Valentina | 1 | $13,724 | 16 | 4.94/5.0 |
| Brigitte | 1 | $12,915 | 4 | 5.00/5.0 |
| Eva | 1 | $12,902 | 30 | 4.87/5.0 |
| Bifeis | 1 | $7,663 | 13 | 5.00/5.0 |
Analyzing the strategies of top hosts, such as their property selection, pricing, and guest communication, can offer valuable lessons for optimizing your own Airbnb operations in Palfen.
Dive Deeper: Advanced Palfen STR Market Data (2026)
Ready to unlock more insights? AirROI provides access to advanced metrics and comprehensive Airbnb data for Palfen. Explore detailed analytics beyond this report to refine your investment strategy, optimize pricing, and maximize your vacation rental profits.
Explore Advanced MetricsPalfen Short-Term Rental Market Composition (2026): Property & Room Types
Room Type Distribution
Property Type Distribution
Market Composition Insights for Palfen
- The Palfen Airbnb market composition is heavily skewed towards Entire Home/Apt listings, which make up 93.8% of the 16 active rentals. This indicates strong guest preference for privacy and space.
- Looking at the property type distribution in Palfen, Apartment/Condo properties are the most common (68.8%), reflecting the local real estate landscape.
- Houses represent a significant 25% portion, catering likely to families or larger groups.
Palfen Airbnb Room Capacity Analysis (2026): Bedroom Distribution
Distribution of Listings by Number of Bedrooms
Room Capacity Insights for Palfen
- The dominant room capacity in Palfen is 2 bedrooms listings, making up 31.3% of the market. This suggests a strong demand for properties suitable for couples or solo travelers.
- Together, 2 bedrooms and 3 bedrooms properties represent 50.1% of the active Airbnb listings in Palfen, indicating a high concentration in these sizes.
- A significant 37.6% of listings offer 3+ bedrooms, catering to larger groups and families seeking more space in Palfen.
Palfen Vacation Rental Guest Capacity Trends (2026)
Distribution of Listings by Guest Capacity
Guest Capacity Insights for Palfen
- The most common guest capacity trend in Palfen vacation rentals is listings accommodating 8+ guests (31.3%). This suggests the primary traveler segment is likely larger groups.
- Properties designed for 8+ guests and 4 guests dominate the Palfen STR market, accounting for 50.1% of listings.
- 50.1% of properties accommodate 6+ guests, serving the market segment for larger families or group travel in Palfen.
- On average, properties in Palfen are equipped to host 5.4 guests.
Palfen Airbnb Booking Patterns (2026): Available vs. Booked Days
Available Days Distribution
Booked Days Distribution
Booking Pattern Insights for Palfen
- The most common availability pattern in Palfen falls within the 271-366 days range, representing 56.3% of listings. This suggests many properties have significant open periods on their calendars.
- Approximately 93.8% of listings show high availability (181+ days open annually), indicating potential for increased bookings or specific owner usage patterns.
- For booked days, the 31-90 days range is most frequent in Palfen (43.8%), reflecting common guest stay durations or potential owner blocking patterns.
- A notable 6.3% of properties secure long booking periods (181+ days booked per year), highlighting successful long-term rental strategies or significant owner usage.
Palfen Airbnb Minimum Stay Requirements Analysis
Distribution of Listings by Minimum Night Requirement
1 Night
3 listings
18.8% of total
2 Nights
1 listings
6.3% of total
3 Nights
1 listings
6.3% of total
4-6 Nights
5 listings
31.3% of total
7-29 Nights
2 listings
12.5% of total
30+ Nights
4 listings
25% of total
Key Insights
- The most prevalent minimum stay requirement in Palfen is 4-6 Nights, adopted by 31.3% of listings. This highlights the market's preference for longer commitments.
- A significant segment (25%) caters to monthly stays (30+ nights) in Palfen, pointing to opportunities in the extended-stay market.
Recommendations
- Align with the market by considering a 4-6 Nights minimum stay, as 31.3% of Palfen hosts use this setting.
- If feasible, allowing 1-night stays, especially midweek or during low season, could capture last-minute bookings, as only 18.8% currently do.
- Explore offering discounts for stays of 30+ nights to attract the 25% of the market seeking extended stays.
- Adjust minimum nights based on seasonality – potentially shorter during low season and longer during peak demand periods in Palfen.
Palfen Airbnb Cancellation Policy Trends Analysis (2026)
Super Strict 60 Days
1 listings
7.1% of total
Moderate
1 listings
7.1% of total
Firm
5 listings
35.7% of total
Strict
7 listings
50% of total
Cancellation Policy Insights for Palfen
- The prevailing Airbnb cancellation policy trend in Palfen is Strict, used by 50% of listings.
- A majority (85.7%) of hosts in Palfen utilize Firm or Strict policies, indicating a market where hosts prioritize booking security.
Recommendations for Hosts
- Consider adopting a Strict policy to align with the 50% market standard in Palfen.
- With 50% using Strict terms, this is a viable option in Palfen, particularly for high-value properties or during peak demand periods.
- Regularly review your cancellation policy against competitors and market demand shifts in Palfen.
Palfen STR Booking Lead Time Analysis (2026)
Average Booking Lead Time by Month
Booking Lead Time Insights for Palfen
- The overall average booking lead time for vacation rentals in Palfen is 78 days.
- Guests book furthest in advance for stays during February (average 137 days), likely coinciding with peak travel demand or local events.
- The shortest booking windows occur for stays in November (average 34 days), indicating more last-minute travel plans during this time.
- Seasonally, Winter (117 days avg.) sees the longest lead times, while Fall (38 days avg.) has the shortest, reflecting typical travel planning cycles.
Recommendations for Hosts
- Use the overall average lead time (78 days) as a baseline for your pricing and availability strategy in Palfen.
- For February stays, consider implementing length-of-stay discounts or slightly higher rates for bookings made less than 137 days out to capitalize on advance planning.
- Target marketing efforts for the Winter season well in advance (at least 117 days) to capture early planners.
- Monitor your own booking lead times against these Palfen averages to identify opportunities for dynamic pricing adjustments.
Popular & Essential Airbnb Amenities in Palfen (2026)
Amenity Prevalence
Amenity Insights for Palfen
- Essential amenities in Palfen that guests expect include: Wifi, Hangers, Heating. Lacking these (any) could significantly impact bookings.
- Popular amenities like Kitchen, Essentials, TV are common but not universal. Offering these can provide a competitive edge.
Recommendations for Hosts
- Ensure your listing includes all essential amenities for Palfen: Wifi, Hangers, Heating.
- Consider adding popular differentiators like Kitchen or Essentials to increase appeal.
- Highlight unique or less common amenities you offer (e.g., hot tub, dedicated workspace, EV charger) in your listing description and photos.
- Regularly check competitor amenities in Palfen to stay competitive.
Palfen Airbnb Guest Demographics & Profile Analysis (2026)
Guest Profile Summary for Palfen
- The typical guest profile for Airbnb in Palfen consists of predominantly international visitors (88%), with top international origins including Austria, typically belonging to the Post-2000s (Gen Z/Alpha) group (50%), primarily speaking English or German.
- Domestic travelers account for 11.8% of guests.
- Key international markets include Germany (50%) and Austria (11.8%).
- Top languages spoken are English (35.9%) followed by German (29.7%).
- A significant demographic segment is the Post-2000s (Gen Z/Alpha) group, representing 50% of guests.
Recommendations for Hosts
- Focus marketing internationally, particularly towards travelers from Austria.
- Tailor amenities and listing descriptions to appeal to the dominant Post-2000s (Gen Z/Alpha) demographic (e.g., highlight fast WiFi, smart home features, local guides).
- Highlight unique local experiences or amenities relevant to the primary guest profile.
- Consider seasonal promotions aligned with peak travel times for key origin markets.
Nearby Short-Term Rental Market Comparison
How does the Palfen Airbnb market stack up against its neighbors? Compare key performance metrics like average monthly revenue, ADR, and occupancy rates in surrounding areas to understand the broader regional STR landscape.
| Market | Active Properties | Monthly Revenue | Daily Rate | Avg. Occupancy |
|---|---|---|---|---|
| Hallstatt | 27 | $5,051 | $303.45 | 64% |
| Cortina d'Ampezzo | 266 | $3,457 | $383.72 | 44% |
| Obertauern | 11 | $3,415 | $364.49 | 47% |
| Reith bei Kitzbühel | 46 | $3,373 | $322.27 | 44% |
| Hof bei Salzburg | 16 | $3,172 | $219.24 | 51% |
| Going am Wilden Kaiser | 27 | $3,036 | $375.98 | 36% |
| Molln | 15 | $3,030 | $179.00 | 52% |
| Colle Santa Lucia | 16 | $3,016 | $187.80 | 47% |
| Sankt Martin am Tennengebirge | 13 | $2,994 | $237.59 | 52% |
| Itter | 27 | $2,962 | $420.86 | 41% |