Strobl Airbnb Market Analysis 2026: Short Term Rental Data & Vacation Rental Statistics in Salzburg, Austria
Is Airbnb profitable in Strobl in 2026? Explore comprehensive Airbnb analytics for Strobl, Salzburg, Austria to uncover income potential. This 2026 STR market report for Strobl, based on AirROI data from February 2025 to January 2026, reveals key trends in the niche market of 33 active listings.
Whether you're considering an Airbnb investment in Strobl, optimizing your existing vacation rental, or exploring rental arbitrage opportunities, understanding the Strobl Airbnb data is crucial. Understanding the local regulations is key to maximizing your short term rental income potential. Let's dive into the specifics.
Key Strobl Airbnb Performance Metrics Overview
Monthly Airbnb Revenue Variations & Income Potential in Strobl (2026)
Understanding the monthly revenue variations for Airbnb listings in Strobl is key to maximizing your short term rental income potential. Seasonality significantly impacts earnings. Our analysis, based on data from the past 12 months, shows that the peak revenue month for STRs in Strobl is typically July, while November often presents the lowest earnings, highlighting opportunities for strategic pricing adjustments during shoulder and low seasons. Explore the typical Airbnb income in Strobl across different performance tiers:
- Best-in-class properties (Top 10%) achieve $4,159+ monthly, often utilizing dynamic pricing and superior guest experiences.
- Strong performing properties (Top 25%) earn $3,093 or more, indicating effective management and desirable locations/amenities.
- Typical properties (Median) generate around $2,063 per month, representing the average market performance.
- Entry-level properties (Bottom 25%) see earnings around $1,336, often with potential for optimization.
Average Monthly Airbnb Earnings Trend in Strobl
Strobl Airbnb Occupancy Rate Trends (2026)
Maximize your bookings by understanding the Strobl STR occupancy trends. Seasonal demand shifts significantly influence how often properties are booked. Typically, Julysees the highest demand (peak season occupancy), while January experiences the lowest (low season). Effective strategies, like adjusting minimum stays or offering promotions, can boost occupancy during slower periods. Here's how different property tiers perform in Strobl:
- Best-in-class properties (Top 10%) achieve 78%+ occupancy, indicating high desirability and potentially optimized availability.
- Strong performing properties (Top 25%) maintain 60% or higher occupancy, suggesting good market fit and guest satisfaction.
- Typical properties (Median) have an occupancy rate around 42%.
- Entry-level properties (Bottom 25%) average 26% occupancy, potentially facing higher vacancy.
Average Monthly Occupancy Rate Trend in Strobl
Average Daily Rate (ADR) Airbnb Trends in Strobl (2026)
Effective short term rental pricing strategy in Strobl involves understanding monthly ADR fluctuations. The Average Daily Rate (ADR) for Airbnb in Strobl typically peaks in December and dips lowest during March. Leveraging Airbnb dynamic pricing tools or strategies based on this seasonality can significantly boost revenue. Here's a look at the typical nightly rates achieved:
- Best-in-class properties (Top 10%) command rates of $293+ per night, often due to premium features or locations.
- Strong performing properties (Top 25%) achieve nightly rates of $214 or more.
- Typical properties (Median) charge around $158 per night.
- Entry-level properties (Bottom 25%) earn around $120 per night.
Average Daily Rate (ADR) Trend by Month in Strobl
Get Live Strobl Market Intelligence 👇

Explore Real-time Analytics
Airbnb Seasonality Analysis & Trends in Strobl (2026)
Peak Season (July, August, June)
- Revenue averages $3,894 per month
- Occupancy rates average 67.2%
- Daily rates average $186
Shoulder Season
- Revenue averages $2,026 per month
- Occupancy maintains around 41.6%
- Daily rates hold near $177
Low Season (January, March, November)
- Revenue drops to average $1,253 per month
- Occupancy decreases to average 25.4%
- Daily rates adjust to average $179
Seasonality Insights for Strobl
- The Airbnb seasonality in Strobl shows highly seasonal trends requiring careful strategy. While the sections above show seasonal averages, it's also insightful to look at the extremes:
- During the high season, the absolute peak month showcases Strobl's highest earning potential, with monthly revenues capable of climbing to $4,572, occupancy reaching a high of 78.0%, and ADRs peaking at $197.
- Conversely, the slowest single month of the year, typically falling within the low season, marks the market's lowest point. In this month, revenue might dip to $1,210, occupancy could drop to 19.0%, and ADRs may adjust down to $156.
- Understanding both the seasonal averages and these monthly peaks and troughs in revenue, occupancy, and ADR is crucial for maximizing your Airbnb profit potential in Strobl.
Seasonal Strategies for Maximizing Profit
- Peak Season: Maximize revenue through premium pricing and potentially longer minimum stays. Ensure high availability.
- Low Season: Offer competitive pricing, special promotions (e.g., extended stay discounts), and flexible cancellation policies. Target off-season travelers like remote workers or budget-conscious guests.
- Shoulder Seasons: Implement dynamic pricing that balances peak and low rates. Target weekend travelers or specific events. Offer slightly more flexible terms than peak season.
- Regularly analyze your own performance against these Strobl seasonality benchmarks and adjust your pricing and availability strategy accordingly.
Best Areas for Airbnb Investment in Strobl (2026)
Exploring the top neighborhoods for short-term rentals in Strobl? This section highlights key areas, outlining why they are attractive for hosts and guests, along with notable local attractions. Consider these locations based on your target guest profile and investment strategy.
| Neighborhood / Area | Why Host Here? (Target Guests & Appeal) | Key Attractions & Landmarks |
|---|---|---|
| Lake Wolfgang | Strobl is situated on the shores of the beautiful Lake Wolfgang, offering stunning views and recreational activities such as swimming, hiking, and boating. This attracts tourists year-round looking for nature and relaxation. | Lake Wolfgang, Hiking in the Schafberg, Boat rental services, Strobl village center, Summer festivals, Winter sports nearby |
| Strobl Village Center | The village center of Strobl offers charm and picturesque Austrian architecture. It is close to local shops, restaurants, and services, making it convenient for Airbnb guests. | Strobl parish church, Local restaurants and cafes, Shops and boutiques, Festival events, Annual Christmas market |
| Schafberg Mountain | The Schafberg is a prominent mountain near Strobl that offers breathtaking panoramic views of the surrounding area. It's popular for hiking and the cog railway ride up the mountain. | Schafberg cog railway, Panoramic views, Hiking trails, Schafberg peak, Restaurant at the summit |
| Wolfgangsee | The entire Wolfgangsee area is renowned for its stunning lakeside views and charming villages, providing guests with a variety of activities including sailing, cycling, and exploring nearby towns. | Sailing on Wolfgangsee, Visit St. Wolfgang and St. Gilgen, Cycling paths, Scenic walking trails, Culinary experiences |
| Historical Sites | The region is rich in history with numerous historical buildings and sites nearby. This attracts history enthusiasts and tourists interested in Austrian culture. | Gmunden Castle, The old wooden bridge, Historical museums, Church of St. Wolfgang, Historic town of Gmunden |
| Salzburg Proximity | Being close to Salzburg, Strobl offers guests the ability to easily explore this famous city known for its music and history, while enjoying the tranquility of the countryside. | Mozart's birthplace, Hohensalzburg Fortress, Mirabell Palace, Salzburg Old Town, Festivals and concerts |
| Ski Resorts | The area is close to various ski resorts that offer winter sports, which attracts guests looking for skiing and snowboarding opportunities during the winter months. | Skiing in Postalm, Snowboarding facilities, Winter hiking trails, Après-ski bars, Ski rentals |
| Wellness Retreats | Strobl and its surroundings have several wellness and spa retreats, making it a perfect destination for those seeking relaxation and rejuvenation. | Spa resorts, Wellness programs, Yoga retreats, Massage therapies, Nature therapies |
Understanding Airbnb License Requirements & STR Laws in Strobl (2026)
With 18% of listings showing registration in 2026, understanding potential Airbnb license requirements is crucial in Strobl. Always verify the latest short term rental regulations and Airbnb license requirements directly with local government authorities for Strobl to ensure full compliance before hosting.
(Source: AirROI data, 2026, based on 18% licensed listings)
Top Performing Airbnb Properties in Strobl (2026)
Benchmark your potential! Explore examples of top-performing Airbnb properties in Stroblbased on Trailing Twelve Month (TTM) revenue. Analyze their characteristics, revenue, occupancy rate, and ADR to understand what drives success in this market.
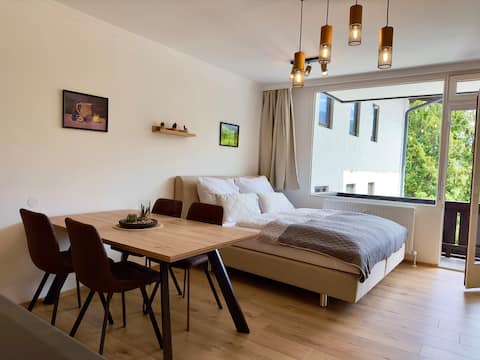
Alpenoase
Entire Place • 1 bedroom
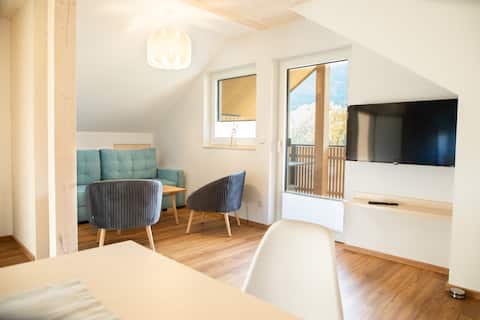
Moosaik Apartments - Apartment with 2 bedrooms
Entire Place • 2 bedrooms
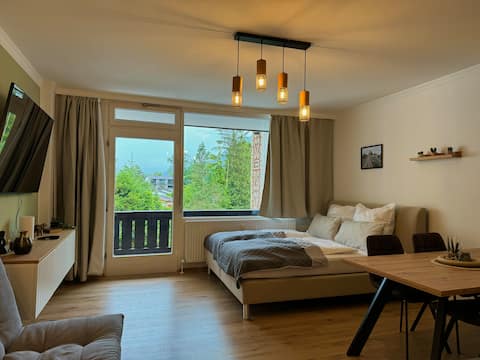
Bergruhe
Entire Place • 1 bedroom

Lake Wolfgang Seeblickplatzl
Entire Place • 1 bedroom
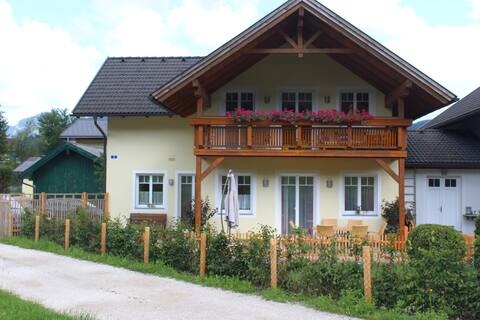
Pepi vacation home in Strobl am Wolfgangsee
Entire Place • 3 bedrooms

Mountain Lake Suite
Entire Place • 1 bedroom
Note: Performance varies based on location, size, amenities, seasonality, and management quality. Data reflects the past 12 months.
Top Performing Airbnb Hosts in Strobl (2026)
Learn from the best! This table showcases top-performing Airbnb hosts in Strobl based on the number of properties managed and estimated total revenue over the past year. Analyze their scale and performance metrics.
| Host Name | Properties | Grossing Revenue | Stay Reviews | Avg Rating |
|---|---|---|---|---|
| Stefan | 2 | $87,752 | 130 | 4.86/5.0 |
| Magdalena | 2 | $73,728 | 44 | 5.00/5.0 |
| Wolfgangsee Appartements | 2 | $44,266 | 4 | 5.00/5.0 |
| Lorenz | 1 | $36,461 | 17 | 4.88/5.0 |
| Andrea | 1 | $36,427 | 15 | 5.00/5.0 |
| Stefan | 1 | $34,435 | 100 | 4.88/5.0 |
| Gregor | 2 | $32,505 | 71 | 4.68/5.0 |
| Evgenia | 1 | $28,376 | 73 | 4.81/5.0 |
| Lorenz | 1 | $25,105 | 13 | 4.31/5.0 |
| Lukas | 1 | $24,576 | 24 | 4.88/5.0 |
Analyzing the strategies of top hosts, such as their property selection, pricing, and guest communication, can offer valuable lessons for optimizing your own Airbnb operations in Strobl.
Dive Deeper: Advanced Strobl STR Market Data (2026)
Ready to unlock more insights? AirROI provides access to advanced metrics and comprehensive Airbnb data for Strobl. Explore detailed analytics beyond this report to refine your investment strategy, optimize pricing, and maximize your vacation rental profits.
Explore Advanced MetricsStrobl Short-Term Rental Market Composition (2026): Property & Room Types
Room Type Distribution
Property Type Distribution
Market Composition Insights for Strobl
- The Strobl Airbnb market composition is heavily skewed towards Entire Home/Apt listings, which make up 93.9% of the 33 active rentals. This indicates strong guest preference for privacy and space.
- Looking at the property type distribution in Strobl, Apartment/Condo properties are the most common (81.8%), reflecting the local real estate landscape.
- Houses represent a significant 18.2% portion, catering likely to families or larger groups.
Strobl Airbnb Room Capacity Analysis (2026): Bedroom Distribution
Distribution of Listings by Number of Bedrooms
Room Capacity Insights for Strobl
- The dominant room capacity in Strobl is 1 bedroom listings, making up 60.6% of the market. This suggests a strong demand for properties suitable for couples or solo travelers.
- Together, 1 bedroom and 2 bedrooms properties represent 78.8% of the active Airbnb listings in Strobl, indicating a high concentration in these sizes.
- With over half the market (60.6%) consisting of studios or 1-bedroom units, Strobl is particularly well-suited for individuals or couples.
- Listings with 3+ bedrooms (9.1%) represent a smaller niche, potentially indicating an underserved market for larger group accommodations in Strobl.
Strobl Vacation Rental Guest Capacity Trends (2026)
Distribution of Listings by Guest Capacity
Guest Capacity Insights for Strobl
- The most common guest capacity trend in Strobl vacation rentals is listings accommodating 4 guests (30.3%). This suggests the primary traveler segment is likely small families or groups.
- Properties designed for 4 guests and 3 guests dominate the Strobl STR market, accounting for 51.5% of listings.
- 18.2% of properties accommodate 6+ guests, serving the market segment for larger families or group travel in Strobl.
- On average, properties in Strobl are equipped to host 3.6 guests.
Strobl Airbnb Booking Patterns (2026): Available vs. Booked Days
Available Days Distribution
Booked Days Distribution
Booking Pattern Insights for Strobl
- The most common availability pattern in Strobl falls within the 271-366 days range, representing 42.4% of listings. This suggests many properties have significant open periods on their calendars.
- Approximately 72.7% of listings show high availability (181+ days open annually), indicating potential for increased bookings or specific owner usage patterns.
- For booked days, the 91-180 days range is most frequent in Strobl (30.3%), reflecting common guest stay durations or potential owner blocking patterns.
- A notable 27.3% of properties secure long booking periods (181+ days booked per year), highlighting successful long-term rental strategies or significant owner usage.
Strobl Airbnb Minimum Stay Requirements Analysis
Distribution of Listings by Minimum Night Requirement
1 Night
3 listings
9.1% of total
2 Nights
7 listings
21.2% of total
3 Nights
3 listings
9.1% of total
4-6 Nights
6 listings
18.2% of total
7-29 Nights
1 listings
3% of total
30+ Nights
13 listings
39.4% of total
Key Insights
- The most prevalent minimum stay requirement in Strobl is 30+ Nights, adopted by 39.4% of listings. This highlights the market's preference for longer commitments.
- A significant segment (39.4%) caters to monthly stays (30+ nights) in Strobl, pointing to opportunities in the extended-stay market.
Recommendations
- Align with the market by considering a 30+ Nights minimum stay, as 39.4% of Strobl hosts use this setting.
- If feasible, allowing 1-night stays, especially midweek or during low season, could capture last-minute bookings, as only 9.1% currently do.
- Explore offering discounts for stays of 30+ nights to attract the 39.4% of the market seeking extended stays.
- Adjust minimum nights based on seasonality – potentially shorter during low season and longer during peak demand periods in Strobl.
Strobl Airbnb Cancellation Policy Trends Analysis (2026)
Flexible
4 listings
12.1% of total
Moderate
8 listings
24.2% of total
Firm
12 listings
36.4% of total
Strict
9 listings
27.3% of total
Cancellation Policy Insights for Strobl
- The prevailing Airbnb cancellation policy trend in Strobl is Firm, used by 36.4% of listings.
- A majority (63.7%) of hosts in Strobl utilize Firm or Strict policies, indicating a market where hosts prioritize booking security.
Recommendations for Hosts
- Consider adopting a Firm policy to align with the 36.4% market standard in Strobl.
- Regularly review your cancellation policy against competitors and market demand shifts in Strobl.
Strobl STR Booking Lead Time Analysis (2026)
Average Booking Lead Time by Month
Booking Lead Time Insights for Strobl
- The overall average booking lead time for vacation rentals in Strobl is 54 days.
- Guests book furthest in advance for stays during July (average 97 days), likely coinciding with peak travel demand or local events.
- The shortest booking windows occur for stays in March (average 31 days), indicating more last-minute travel plans during this time.
- Seasonally, Summer (83 days avg.) sees the longest lead times, while Fall (42 days avg.) has the shortest, reflecting typical travel planning cycles.
Recommendations for Hosts
- Use the overall average lead time (54 days) as a baseline for your pricing and availability strategy in Strobl.
- For July stays, consider implementing length-of-stay discounts or slightly higher rates for bookings made less than 97 days out to capitalize on advance planning.
- Target marketing efforts for the Summer season well in advance (at least 83 days) to capture early planners.
- Monitor your own booking lead times against these Strobl averages to identify opportunities for dynamic pricing adjustments.
Popular & Essential Airbnb Amenities in Strobl (2026)
Amenity Prevalence
Amenity Insights for Strobl
- Essential amenities in Strobl that guests expect include: Kitchen, Heating, TV. Lacking these (any) could significantly impact bookings.
- Popular amenities like Free parking on premises, Wifi, Hangers are common but not universal. Offering these can provide a competitive edge.
- Warning: Wifi is not universally provided but is considered essential globally. Ensure reliable Wifi is offered.
Recommendations for Hosts
- Ensure your listing includes all essential amenities for Strobl: Kitchen, Heating, TV.
- Prioritize adding missing essentials: Heating, TV.
- Consider adding popular differentiators like Free parking on premises or Wifi to increase appeal.
- Highlight unique or less common amenities you offer (e.g., hot tub, dedicated workspace, EV charger) in your listing description and photos.
- Regularly check competitor amenities in Strobl to stay competitive.
Strobl Airbnb Guest Demographics & Profile Analysis (2026)
Guest Profile Summary for Strobl
- The typical guest profile for Airbnb in Strobl consists of predominantly international visitors (89%), with top international origins including Czechia, typically belonging to the Post-2000s (Gen Z/Alpha) group (50%), primarily speaking English or German.
- Domestic travelers account for 10.9% of guests.
- Key international markets include Germany (24.8%) and Czechia (11.7%).
- Top languages spoken are English (41.3%) followed by German (16.3%).
- A significant demographic segment is the Post-2000s (Gen Z/Alpha) group, representing 50% of guests.
Recommendations for Hosts
- Focus marketing internationally, particularly towards travelers from Czechia.
- Tailor amenities and listing descriptions to appeal to the dominant Post-2000s (Gen Z/Alpha) demographic (e.g., highlight fast WiFi, smart home features, local guides).
- Highlight unique local experiences or amenities relevant to the primary guest profile.
- Consider seasonal promotions aligned with peak travel times for key origin markets.
Nearby Short-Term Rental Market Comparison
How does the Strobl Airbnb market stack up against its neighbors? Compare key performance metrics like average monthly revenue, ADR, and occupancy rates in surrounding areas to understand the broader regional STR landscape.
| Market | Active Properties | Monthly Revenue | Daily Rate | Avg. Occupancy |
|---|---|---|---|---|
| Scheffau am Wilden Kaiser | 12 | $6,669 | $906.83 | 30% |
| Hallstatt | 31 | $4,918 | $293.92 | 62% |
| Cortina d'Ampezzo | 309 | $3,646 | $474.12 | 40% |
| Going am Wilden Kaiser | 27 | $3,596 | $406.50 | 37% |
| Bayrischzell | 41 | $3,550 | $389.91 | 33% |
| Krimml | 53 | $3,544 | $359.14 | 41% |
| Hof bei Salzburg | 21 | $3,403 | $301.21 | 49% |
| Reith bei Kitzbühel | 49 | $3,385 | $356.25 | 34% |
| Colle Santa Lucia | 21 | $3,353 | $248.56 | 46% |
| Unterach am Attersee | 16 | $3,220 | $285.15 | 43% |