Landl Airbnb Market Analysis 2026: Short Term Rental Data & Vacation Rental Statistics in Styria, Austria
Is Airbnb profitable in Landl in 2026? Explore comprehensive Airbnb analytics for Landl, Styria, Austria to uncover income potential. This 2026 STR market report for Landl, based on AirROI data from February 2025 to January 2026, reveals key trends in the niche market of 25 active listings.
Whether you're considering an Airbnb investment in Landl, optimizing your existing vacation rental, or exploring rental arbitrage opportunities, understanding the Landl Airbnb data is crucial. Leveraging the low regulation environment is key to maximizing your short term rental income potential. Let's dive into the specifics.
Key Landl Airbnb Performance Metrics Overview
Monthly Airbnb Revenue Variations & Income Potential in Landl (2026)
Understanding the monthly revenue variations for Airbnb listings in Landl is key to maximizing your short term rental income potential. Seasonality significantly impacts earnings. Our analysis, based on data from the past 12 months, shows that the peak revenue month for STRs in Landl is typically August, while January often presents the lowest earnings, highlighting opportunities for strategic pricing adjustments during shoulder and low seasons. Explore the typical Airbnb income in Landl across different performance tiers:
- Best-in-class properties (Top 10%) achieve $3,047+ monthly, often utilizing dynamic pricing and superior guest experiences.
- Strong performing properties (Top 25%) earn $2,002 or more, indicating effective management and desirable locations/amenities.
- Typical properties (Median) generate around $1,056 per month, representing the average market performance.
- Entry-level properties (Bottom 25%) see earnings around $558, often with potential for optimization.
Average Monthly Airbnb Earnings Trend in Landl
Landl Airbnb Occupancy Rate Trends (2026)
Maximize your bookings by understanding the Landl STR occupancy trends. Seasonal demand shifts significantly influence how often properties are booked. Typically, Julysees the highest demand (peak season occupancy), while January experiences the lowest (low season). Effective strategies, like adjusting minimum stays or offering promotions, can boost occupancy during slower periods. Here's how different property tiers perform in Landl:
- Best-in-class properties (Top 10%) achieve 62%+ occupancy, indicating high desirability and potentially optimized availability.
- Strong performing properties (Top 25%) maintain 40% or higher occupancy, suggesting good market fit and guest satisfaction.
- Typical properties (Median) have an occupancy rate around 23%.
- Entry-level properties (Bottom 25%) average 10% occupancy, potentially facing higher vacancy.
Average Monthly Occupancy Rate Trend in Landl
Average Daily Rate (ADR) Airbnb Trends in Landl (2026)
Effective short term rental pricing strategy in Landl involves understanding monthly ADR fluctuations. The Average Daily Rate (ADR) for Airbnb in Landl typically peaks in June and dips lowest during March. Leveraging Airbnb dynamic pricing tools or strategies based on this seasonality can significantly boost revenue. Here's a look at the typical nightly rates achieved:
- Best-in-class properties (Top 10%) command rates of $294+ per night, often due to premium features or locations.
- Strong performing properties (Top 25%) achieve nightly rates of $225 or more.
- Typical properties (Median) charge around $182 per night.
- Entry-level properties (Bottom 25%) earn around $121 per night.
Average Daily Rate (ADR) Trend by Month in Landl
Get Live Landl Market Intelligence 👇

Explore Real-time Analytics
Airbnb Seasonality Analysis & Trends in Landl (2026)
Peak Season (August, July, June)
- Revenue averages $2,232 per month
- Occupancy rates average 43.0%
- Daily rates average $195
Shoulder Season
- Revenue averages $1,416 per month
- Occupancy maintains around 27.4%
- Daily rates hold near $187
Low Season (January, November, December)
- Revenue drops to average $893 per month
- Occupancy decreases to average 18.3%
- Daily rates adjust to average $186
Seasonality Insights for Landl
- The Airbnb seasonality in Landl shows highly seasonal trends requiring careful strategy. While the sections above show seasonal averages, it's also insightful to look at the extremes:
- During the high season, the absolute peak month showcases Landl's highest earning potential, with monthly revenues capable of climbing to $2,365, occupancy reaching a high of 45.7%, and ADRs peaking at $196.
- Conversely, the slowest single month of the year, typically falling within the low season, marks the market's lowest point. In this month, revenue might dip to $727, occupancy could drop to 13.1%, and ADRs may adjust down to $184.
- Understanding both the seasonal averages and these monthly peaks and troughs in revenue, occupancy, and ADR is crucial for maximizing your Airbnb profit potential in Landl.
Seasonal Strategies for Maximizing Profit
- Peak Season: Maximize revenue through premium pricing and potentially longer minimum stays. Ensure high availability.
- Low Season: Offer competitive pricing, special promotions (e.g., extended stay discounts), and flexible cancellation policies. Target off-season travelers like remote workers or budget-conscious guests.
- Shoulder Seasons: Implement dynamic pricing that balances peak and low rates. Target weekend travelers or specific events. Offer slightly more flexible terms than peak season.
- Regularly analyze your own performance against these Landl seasonality benchmarks and adjust your pricing and availability strategy accordingly.
Best Areas for Airbnb Investment in Landl (2026)
Exploring the top neighborhoods for short-term rentals in Landl? This section highlights key areas, outlining why they are attractive for hosts and guests, along with notable local attractions. Consider these locations based on your target guest profile and investment strategy.
| Neighborhood / Area | Why Host Here? (Target Guests & Appeal) | Key Attractions & Landmarks |
|---|---|---|
| Graz | The capital of Styria, known for its rich history, vibrant cultural scene, and youthful atmosphere due to a large student population. An attractive destination for both tourists and long-term renters. | Graz Old Town, Schlossberg, Eggenberg Palace, Universalmuseum Joanneum, Murinsel, Grazer Dom |
| Bad Aussee | A picturesque spa town in the Salzkammergut region, known for its thermal baths, stunning alpine scenery, and outdoor activities. Ideal for tourists seeking relaxation and adventure. | Ausee Lake, Narzissenbad, Dachstein-Tauern, Loser Mountain, Grimming |
| Schladming | A renowned ski resort destination that attracts winter sports enthusiasts. Offers great investment potential due to year-round tourism—skiing in winter, hiking, and biking in summer. | Planai Ski Area, Dachstein Glacier, Schladming Adventure Park, Reiteralm, Schladming-Dachstein Region |
| Leoben | A historic town known for its mining history and university, which brings in many students and professionals. A growing area for short-term rentals and business stays. | Leoben Main Square, Goethegasse, Hochschulstadt Leoben, Museum der Stadt Leoben, Murmurdal |
| Stainach-Pürgg | A charming village that serves as a gateway to the stunning Styrian mountains, popular with hikers and nature lovers. Great for attracting guests seeking tranquility and nature experiences. | Pürgger Ried, Enns River, Grimming Mountain, Hiking Trails |
| Knittelfeld | A small town that benefits from its proximity to larger cities and has various motorsport attractions, including the Red Bull Ring. A good spot for both leisure and business travelers. | Red Bull Ring, Knittelfeld City Center, Herberstein Castle |
| Fohnsdorf | An emerging area for short-term rentals, especially for those visiting nearby attractions and businesses. It has a mix of cultural events and natural beauty. | Fohnsdorf Castle, Cultural Events, Murtal Nature |
| Mariazell | A famous pilgrimage town known for its basilica and beautiful natural surroundings. Attracts visitors searching for spiritual experiences and outdoor activities in Styria. | Mariazell Basilica, Blashof Ski Resort, Hydropower Plant, Ötscher-Tormäuer National Park |
Understanding Airbnb License Requirements & STR Laws in Landl (2026)
While Landl, Styria, Austria currently shows low STR regulations, specific Airbnb license requirements might still exist or change. Always verify the latest short term rental regulations and Airbnb license requirements directly with local government authorities for Landl to ensure full compliance before hosting.
(Source: AirROI data, 2026, finding no licensed listings among those analyzed)
Top Performing Airbnb Properties in Landl (2026)
Benchmark your potential! Explore examples of top-performing Airbnb properties in Landlbased on Trailing Twelve Month (TTM) revenue. Analyze their characteristics, revenue, occupancy rate, and ADR to understand what drives success in this market.
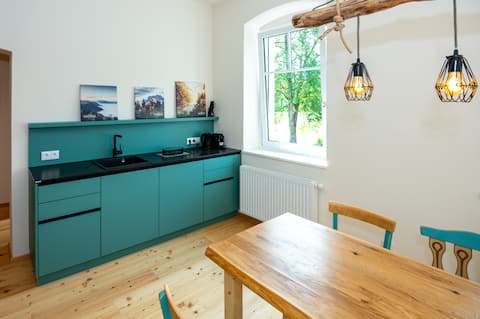
NaturparkResort GeoApartment 1
Entire Place • 1 bedroom
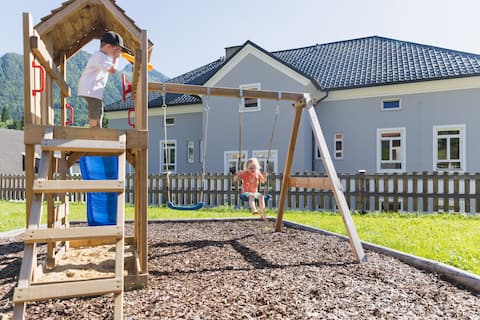
NaturparkResort Alte Schule AP4 8 people
Entire Place • 1 bedroom
Grottenheim
Entire Place • 3 bedrooms
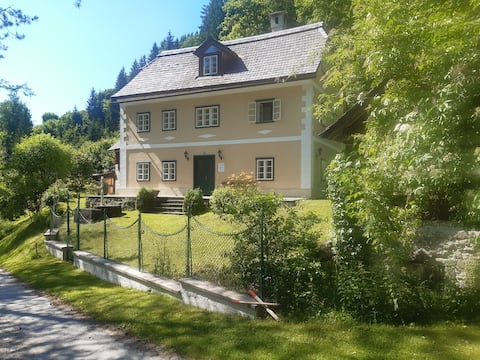
Vacation home sHäuserl
Entire Place • 1 bedroom

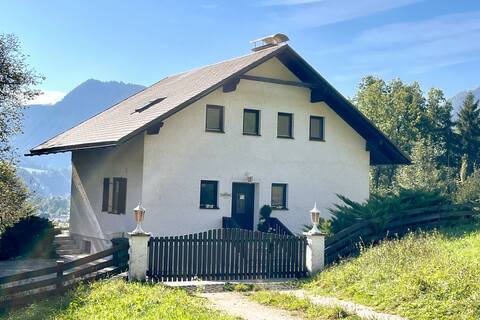
Esche Vacation Rental
Entire Place • 1 bedroom

Accommodation in the Gesäuse
Entire Place • 2 bedrooms
Note: Performance varies based on location, size, amenities, seasonality, and management quality. Data reflects the past 12 months.
Top Performing Airbnb Hosts in Landl (2026)
Learn from the best! This table showcases top-performing Airbnb hosts in Landl based on the number of properties managed and estimated total revenue over the past year. Analyze their scale and performance metrics.
| Host Name | Properties | Grossing Revenue | Stay Reviews | Avg Rating |
|---|---|---|---|---|
| Verena | 14 | $151,772 | 132 | 4.89/5.0 |
| Susanne | 1 | $47,979 | 23 | 5.00/5.0 |
| Erika | 2 | $19,657 | 19 | 4.94/5.0 |
| Renate | 1 | $18,862 | 51 | 4.96/5.0 |
| Martin & Birgit | 1 | $18,042 | 5 | 5.00/5.0 |
| Gabor | 1 | $15,685 | 72 | 4.94/5.0 |
| Matthias | 1 | $14,956 | 48 | 4.92/5.0 |
| Birgit | 1 | $10,042 | 22 | 4.86/5.0 |
| Elfi | 1 | $5,883 | 1 | Not Rated |
| Claudia | 1 | $964 | 68 | 4.69/5.0 |
Analyzing the strategies of top hosts, such as their property selection, pricing, and guest communication, can offer valuable lessons for optimizing your own Airbnb operations in Landl.
Dive Deeper: Advanced Landl STR Market Data (2026)
Ready to unlock more insights? AirROI provides access to advanced metrics and comprehensive Airbnb data for Landl. Explore detailed analytics beyond this report to refine your investment strategy, optimize pricing, and maximize your vacation rental profits.
Explore Advanced MetricsLandl Short-Term Rental Market Composition (2026): Property & Room Types
Room Type Distribution
Property Type Distribution
Market Composition Insights for Landl
- The Landl Airbnb market composition is heavily skewed towards Entire Home/Apt listings, which make up 92% of the 25 active rentals. This indicates strong guest preference for privacy and space.
- Looking at the property type distribution in Landl, Apartment/Condo properties are the most common (68%), reflecting the local real estate landscape.
- Houses represent a significant 20% portion, catering likely to families or larger groups.
- Smaller segments like hotel/boutique (combined 4.0%) offer potential for unique stay experiences.
Landl Airbnb Room Capacity Analysis (2026): Bedroom Distribution
Distribution of Listings by Number of Bedrooms
Room Capacity Insights for Landl
- The dominant room capacity in Landl is 1 bedroom listings, making up 44% of the market. This suggests a strong demand for properties suitable for couples or solo travelers.
- Together, 1 bedroom and 2 bedrooms properties represent 72.0% of the active Airbnb listings in Landl, indicating a high concentration in these sizes.
Landl Vacation Rental Guest Capacity Trends (2026)
Distribution of Listings by Guest Capacity
Guest Capacity Insights for Landl
- The most common guest capacity trend in Landl vacation rentals is listings accommodating 4 guests (24%). This suggests the primary traveler segment is likely small families or groups.
- Properties designed for 4 guests and 6 guests dominate the Landl STR market, accounting for 44.0% of listings.
- 44.0% of properties accommodate 6+ guests, serving the market segment for larger families or group travel in Landl.
- On average, properties in Landl are equipped to host 4.8 guests.
Landl Airbnb Booking Patterns (2026): Available vs. Booked Days
Available Days Distribution
Booked Days Distribution
Booking Pattern Insights for Landl
- The most common availability pattern in Landl falls within the 271-366 days range, representing 80% of listings. This suggests many properties have significant open periods on their calendars.
- Approximately 96.0% of listings show high availability (181+ days open annually), indicating potential for increased bookings or specific owner usage patterns.
- For booked days, the 31-90 days range is most frequent in Landl (56%), reflecting common guest stay durations or potential owner blocking patterns.
- A notable 4.0% of properties secure long booking periods (181+ days booked per year), highlighting successful long-term rental strategies or significant owner usage.
Landl Airbnb Minimum Stay Requirements Analysis
Distribution of Listings by Minimum Night Requirement
1 Night
1 listings
4% of total
2 Nights
9 listings
36% of total
3 Nights
3 listings
12% of total
4-6 Nights
2 listings
8% of total
30+ Nights
10 listings
40% of total
Key Insights
- The most prevalent minimum stay requirement in Landl is 30+ Nights, adopted by 40% of listings. This highlights the market's preference for longer commitments.
- A significant segment (40%) caters to monthly stays (30+ nights) in Landl, pointing to opportunities in the extended-stay market.
Recommendations
- Align with the market by considering a 30+ Nights minimum stay, as 40% of Landl hosts use this setting.
- If feasible, allowing 1-night stays, especially midweek or during low season, could capture last-minute bookings, as only 4% currently do.
- A 2-night minimum appears standard (36%). Consider this for weekends or peak periods.
- Explore offering discounts for stays of 30+ nights to attract the 40% of the market seeking extended stays.
- Adjust minimum nights based on seasonality – potentially shorter during low season and longer during peak demand periods in Landl.
Landl Airbnb Cancellation Policy Trends Analysis (2026)
Limited
11 listings
44% of total
Flexible
2 listings
8% of total
Moderate
3 listings
12% of total
Firm
6 listings
24% of total
Strict
3 listings
12% of total
Cancellation Policy Insights for Landl
- The prevailing Airbnb cancellation policy trend in Landl is Limited, used by 44% of listings.
- There's a relatively balanced mix between guest-friendly (20.0%) and stricter (36.0%) policies, offering choices for different guest needs.
Recommendations for Hosts
- Consider adopting a Limited policy to align with the 44% market standard in Landl.
- Using a Strict policy might deter some guests, as only 12% of listings use it. Evaluate if potential revenue protection outweighs possible lower booking rates.
- Regularly review your cancellation policy against competitors and market demand shifts in Landl.
Landl STR Booking Lead Time Analysis (2026)
Average Booking Lead Time by Month
Booking Lead Time Insights for Landl
- The overall average booking lead time for vacation rentals in Landl is 82 days.
- Guests book furthest in advance for stays during June (average 172 days), likely coinciding with peak travel demand or local events.
- The shortest booking windows occur for stays in November (average 13 days), indicating more last-minute travel plans during this time.
- Seasonally, Summer (127 days avg.) sees the longest lead times, while Winter (51 days avg.) has the shortest, reflecting typical travel planning cycles.
Recommendations for Hosts
- Use the overall average lead time (82 days) as a baseline for your pricing and availability strategy in Landl.
- For June stays, consider implementing length-of-stay discounts or slightly higher rates for bookings made less than 172 days out to capitalize on advance planning.
- During November, focus on last-minute booking availability and promotions, as guests book with very short notice (13 days avg.).
- Target marketing efforts for the Summer season well in advance (at least 127 days) to capture early planners.
- Monitor your own booking lead times against these Landl averages to identify opportunities for dynamic pricing adjustments.
Popular & Essential Airbnb Amenities in Landl (2026)
Amenity Prevalence
Amenity Insights for Landl
- Essential amenities in Landl that guests expect include: Free parking on premises, Fire extinguisher, Heating. Lacking these (any) could significantly impact bookings.
- Popular amenities like Kitchen, Essentials, Refrigerator are common but not universal. Offering these can provide a competitive edge.
- Warning: Wifi is not universally provided but is considered essential globally. Ensure reliable Wifi is offered.
Recommendations for Hosts
- Ensure your listing includes all essential amenities for Landl: Free parking on premises, Fire extinguisher, Heating.
- Prioritize adding missing essentials: Fire extinguisher, Heating.
- Consider adding popular differentiators like Kitchen or Essentials to increase appeal.
- Highlight unique or less common amenities you offer (e.g., hot tub, dedicated workspace, EV charger) in your listing description and photos.
- Regularly check competitor amenities in Landl to stay competitive.
Landl Airbnb Guest Demographics & Profile Analysis (2026)
Guest Profile Summary for Landl
- The typical guest profile for Airbnb in Landl consists of predominantly international visitors (71%), with top international origins including Germany, typically belonging to the Post-2000s (Gen Z/Alpha) group (50%), primarily speaking English or German.
- Domestic travelers account for 29.0% of guests.
- Key international markets include Austria (29%) and Germany (22.6%).
- Top languages spoken are English (41.5%) followed by German (26.8%).
- A significant demographic segment is the Post-2000s (Gen Z/Alpha) group, representing 50% of guests.
Recommendations for Hosts
- Focus marketing internationally, particularly towards travelers from Germany.
- Tailor amenities and listing descriptions to appeal to the dominant Post-2000s (Gen Z/Alpha) demographic (e.g., highlight fast WiFi, smart home features, local guides).
- Highlight unique local experiences or amenities relevant to the primary guest profile.
- Consider seasonal promotions aligned with peak travel times for key origin markets.
Nearby Short-Term Rental Market Comparison
How does the Landl Airbnb market stack up against its neighbors? Compare key performance metrics like average monthly revenue, ADR, and occupancy rates in surrounding areas to understand the broader regional STR landscape.
| Market | Active Properties | Monthly Revenue | Daily Rate | Avg. Occupancy |
|---|---|---|---|---|
| Hallstatt | 31 | $4,918 | $293.92 | 62% |
| Hof bei Salzburg | 21 | $3,403 | $301.21 | 49% |
| Unterach am Attersee | 16 | $3,220 | $285.15 | 43% |
| Molln | 14 | $3,187 | $185.02 | 52% |
| Faistenau | 11 | $3,055 | $276.07 | 40% |
| Mühlbach am Hochkönig | 86 | $3,033 | $323.28 | 40% |
| Bad Sankt Leonhard im Lavanttal | 35 | $2,804 | $300.73 | 36% |
| Salzburg | 497 | $2,785 | $204.13 | 51% |
| Golling an der Salzach | 16 | $2,601 | $241.57 | 41% |
| Spital am Semmering | 24 | $2,578 | $309.29 | 33% |