Berwang Airbnb Market Analysis 2026: Short Term Rental Data & Vacation Rental Statistics in Tyrol, Austria
Is Airbnb profitable in Berwang in 2026? Explore comprehensive Airbnb analytics for Berwang, Tyrol, Austria to uncover income potential. This 2026 STR market report for Berwang, based on AirROI data from February 2025 to January 2026, reveals key trends in the niche market of 21 active listings.
Whether you're considering an Airbnb investment in Berwang, optimizing your existing vacation rental, or exploring rental arbitrage opportunities, understanding the Berwang Airbnb data is crucial. Leveraging the low regulation environment is key to maximizing your short term rental income potential. Let's dive into the specifics.
Key Berwang Airbnb Performance Metrics Overview
Monthly Airbnb Revenue Variations & Income Potential in Berwang (2026)
Understanding the monthly revenue variations for Airbnb listings in Berwang is key to maximizing your short term rental income potential. Seasonality significantly impacts earnings. Our analysis, based on data from the past 12 months, shows that the peak revenue month for STRs in Berwang is typically February, while October often presents the lowest earnings, highlighting opportunities for strategic pricing adjustments during shoulder and low seasons. Explore the typical Airbnb income in Berwang across different performance tiers:
- Best-in-class properties (Top 10%) achieve $6,680+ monthly, often utilizing dynamic pricing and superior guest experiences.
- Strong performing properties (Top 25%) earn $4,542 or more, indicating effective management and desirable locations/amenities.
- Typical properties (Median) generate around $2,052 per month, representing the average market performance.
- Entry-level properties (Bottom 25%) see earnings around $1,249, often with potential for optimization.
Average Monthly Airbnb Earnings Trend in Berwang
Berwang Airbnb Occupancy Rate Trends (2026)
Maximize your bookings by understanding the Berwang STR occupancy trends. Seasonal demand shifts significantly influence how often properties are booked. Typically, Augustsees the highest demand (peak season occupancy), while January experiences the lowest (low season). Effective strategies, like adjusting minimum stays or offering promotions, can boost occupancy during slower periods. Here's how different property tiers perform in Berwang:
- Best-in-class properties (Top 10%) achieve 70%+ occupancy, indicating high desirability and potentially optimized availability.
- Strong performing properties (Top 25%) maintain 56% or higher occupancy, suggesting good market fit and guest satisfaction.
- Typical properties (Median) have an occupancy rate around 39%.
- Entry-level properties (Bottom 25%) average 22% occupancy, potentially facing higher vacancy.
Average Monthly Occupancy Rate Trend in Berwang
Average Daily Rate (ADR) Airbnb Trends in Berwang (2026)
Effective short term rental pricing strategy in Berwang involves understanding monthly ADR fluctuations. The Average Daily Rate (ADR) for Airbnb in Berwang typically peaks in January and dips lowest during September. Leveraging Airbnb dynamic pricing tools or strategies based on this seasonality can significantly boost revenue. Here's a look at the typical nightly rates achieved:
- Best-in-class properties (Top 10%) command rates of $433+ per night, often due to premium features or locations.
- Strong performing properties (Top 25%) achieve nightly rates of $349 or more.
- Typical properties (Median) charge around $237 per night.
- Entry-level properties (Bottom 25%) earn around $155 per night.
Average Daily Rate (ADR) Trend by Month in Berwang
Get Live Berwang Market Intelligence 👇
Explore Real-time Analytics
Airbnb Seasonality Analysis & Trends in Berwang (2026)
Peak Season (February, August, May)
- Revenue averages $4,313 per month
- Occupancy rates average 56.9%
- Daily rates average $237
Shoulder Season
- Revenue averages $2,876 per month
- Occupancy maintains around 35.0%
- Daily rates hold near $281
Low Season (April, June, October)
- Revenue drops to average $2,298 per month
- Occupancy decreases to average 33.0%
- Daily rates adjust to average $251
Seasonality Insights for Berwang
- The Airbnb seasonality in Berwang shows highly seasonal trends requiring careful strategy. While the sections above show seasonal averages, it's also insightful to look at the extremes:
- During the high season, the absolute peak month showcases Berwang's highest earning potential, with monthly revenues capable of climbing to $5,402, occupancy reaching a high of 59.7%, and ADRs peaking at $353.
- Conversely, the slowest single month of the year, typically falling within the low season, marks the market's lowest point. In this month, revenue might dip to $2,209, occupancy could drop to 23.3%, and ADRs may adjust down to $189.
- Understanding both the seasonal averages and these monthly peaks and troughs in revenue, occupancy, and ADR is crucial for maximizing your Airbnb profit potential in Berwang.
Seasonal Strategies for Maximizing Profit
- Peak Season: Maximize revenue through premium pricing and potentially longer minimum stays. Ensure high availability.
- Low Season: Offer competitive pricing, special promotions (e.g., extended stay discounts), and flexible cancellation policies. Target off-season travelers like remote workers or budget-conscious guests.
- Shoulder Seasons: Implement dynamic pricing that balances peak and low rates. Target weekend travelers or specific events. Offer slightly more flexible terms than peak season.
- Regularly analyze your own performance against these Berwang seasonality benchmarks and adjust your pricing and availability strategy accordingly.
Best Areas for Airbnb Investment in Berwang (2026)
Exploring the top neighborhoods for short-term rentals in Berwang? This section highlights key areas, outlining why they are attractive for hosts and guests, along with notable local attractions. Consider these locations based on your target guest profile and investment strategy.
| Neighborhood / Area | Why Host Here? (Target Guests & Appeal) | Key Attractions & Landmarks |
|---|---|---|
| Berwang Village | A picturesque alpine village known for its charming atmosphere and stunning mountain views. It's ideal for guests seeking a cozy retreat amidst nature, with ample options for skiing and hiking. | Berwang Ski Area, Zugspitze, Bergeralm ski resort, hiking trails, alpine meadows, traditional Austrian cuisine restaurants |
| Bergbahnen Berwang | The local cable cars provide access to fantastic ski slopes and hiking trails, making it a great choice for outdoor enthusiasts and families. | Alpine skiing, Snowboarding, Mountain biking, Hiking trails, Scenic viewpoints |
| Hochötz | Famous for its family-friendly ski areas and summer hiking paths, perfect for tourists of all ages looking to explore the Tyrolean Alps. | Hiking trails, Family ski slopes, Ötztal Nature Park, Biking routes, Alpine lodges |
| Zugspitze | The highest peak in Germany offering breathtaking views and a variety of recreational activities year-round, attracting adventure lovers and tourists. | Zugspitze glacier, Eibsee Lake, Garmisch-Partenkirchen, Cable car rides, Snow activities |
| Tyrol Alps | A magnificent region with stunning natural landscapes and adventure sports opportunities, ideal for die-hard nature lovers and thrill-seekers. | Numerous hiking paths, Ski resorts, Wildlife parks, Alpine lakes, Mountain climbing |
| Reutte | A charming town that serves as a gateway to the Tyrol region with historical sites and beautiful nature, perfect for culture and nature enthusiasts. | Fortress Ehrenberg, Hiking trails, Tannheimer Tal, Alpine huts, Lakes |
| Lermoos | A cozy village known for skiing and hiking, offering beautiful views of the Zugspitze and great access to outdoor activities for all seasons. | Ski resorts, Hiking trails, Golf courses, Lermoos mountain railway, Alpine scenery |
| Füssen | Located near the famous Neuschwanstein Castle, Füssen attracts tourists seeking history and fairy-tale experiences combined with outdoor adventure. | Neuschwanstein Castle, Hohenschwangau Castle, Forggensee, Old Town, Biking and hiking trails |
Understanding Airbnb License Requirements & STR Laws in Berwang (2026)
While Berwang, Tyrol, Austria currently shows low STR regulations, specific Airbnb license requirements might still exist or change. Always verify the latest short term rental regulations and Airbnb license requirements directly with local government authorities for Berwang to ensure full compliance before hosting.
(Source: AirROI data, 2026, finding no licensed listings among those analyzed)
Top Performing Airbnb Properties in Berwang (2026)
Benchmark your potential! Explore examples of top-performing Airbnb properties in Berwangbased on Trailing Twelve Month (TTM) revenue. Analyze their characteristics, revenue, occupancy rate, and ADR to understand what drives success in this market.
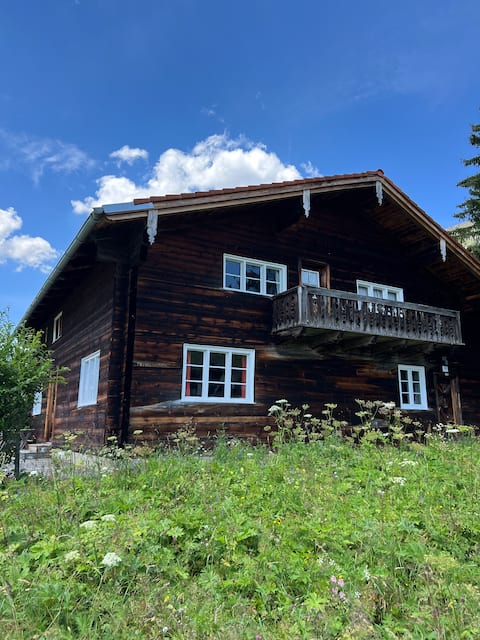
Authentic wooden house
Entire Place • 5 bedrooms
![Penthouse Alpenstern in Chalet Zur Rose [Penthouse Alpine Star in Chalet Zur Rose]](https://a0.muscache.com/im/pictures/hosting/Hosting-1199697067937027767/original/cfa654e5-5901-426e-926d-f099151cc537.jpeg?im_w=480&im_format=avif)
Penthouse Alpenstern in Chalet Zur Rose [Penthouse Alpine Star in Chalet Zur Rose]
Entire Place • 4 bedrooms
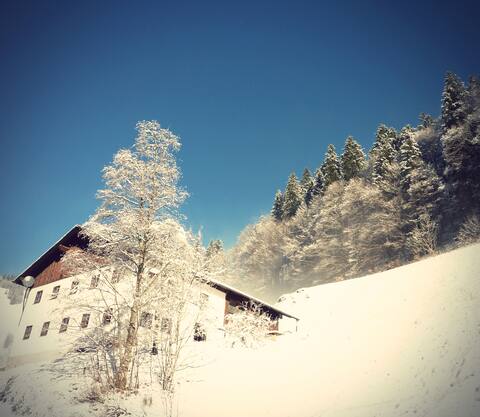
Mountain hut-Farmhouse in a small mountain village
Entire Place • 5 bedrooms

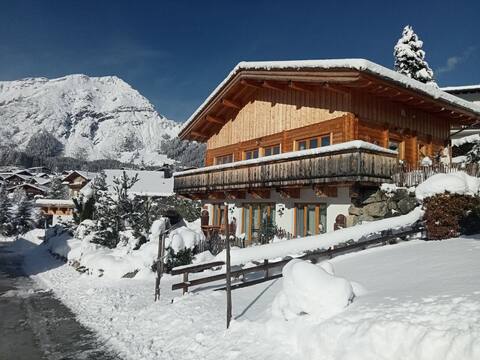
Holiday home Berwang Neunzehn-Tiroler Zugspitzarena
Entire Place • 4 bedrooms
Chalet GAIA in the mountain village of Berwang
Entire Place • 1 bedroom

Apartment 3 - Haus Amann - Tyrol - 4 Pers
Entire Place • 1 bedroom
Note: Performance varies based on location, size, amenities, seasonality, and management quality. Data reflects the past 12 months.
Top Performing Airbnb Hosts in Berwang (2026)
Learn from the best! This table showcases top-performing Airbnb hosts in Berwang based on the number of properties managed and estimated total revenue over the past year. Analyze their scale and performance metrics.
| Host Name | Properties | Grossing Revenue | Stay Reviews | Avg Rating |
|---|---|---|---|---|
| Marthijs | 12 | $192,985 | 173 | 4.67/5.0 |
| Katharina | 1 | $85,992 | 19 | 4.63/5.0 |
| Cleo | 1 | $41,741 | 23 | 4.96/5.0 |
| Cleo | 1 | $41,629 | 34 | 4.97/5.0 |
| Dieter & Tania | 2 | $30,486 | 125 | 4.96/5.0 |
| Christine | 1 | $27,783 | 11 | 5.00/5.0 |
| Peter | 2 | $19,964 | 24 | 4.68/5.0 |
| Bettina | 1 | $16,735 | 10 | 5.00/5.0 |
Analyzing the strategies of top hosts, such as their property selection, pricing, and guest communication, can offer valuable lessons for optimizing your own Airbnb operations in Berwang.
Dive Deeper: Advanced Berwang STR Market Data (2026)
Ready to unlock more insights? AirROI provides access to advanced metrics and comprehensive Airbnb data for Berwang. Explore detailed analytics beyond this report to refine your investment strategy, optimize pricing, and maximize your vacation rental profits.
Explore Advanced MetricsBerwang Short-Term Rental Market Composition (2026): Property & Room Types
Room Type Distribution
Property Type Distribution
Market Composition Insights for Berwang
- The Berwang Airbnb market composition is heavily skewed towards Entire Home/Apt listings, which make up 100% of the 21 active rentals. This indicates strong guest preference for privacy and space.
- Looking at the property type distribution in Berwang, Apartment/Condo properties are the most common (81%), reflecting the local real estate landscape.
- Smaller segments like others, house (combined 9.6%) offer potential for unique stay experiences.
Berwang Airbnb Room Capacity Analysis (2026): Bedroom Distribution
Distribution of Listings by Number of Bedrooms
Room Capacity Insights for Berwang
- The dominant room capacity in Berwang is 1 bedroom listings, making up 57.1% of the market. This suggests a strong demand for properties suitable for couples or solo travelers.
- Together, 1 bedroom and 2 bedrooms properties represent 80.9% of the active Airbnb listings in Berwang, indicating a high concentration in these sizes.
- With over half the market (57.1%) consisting of studios or 1-bedroom units, Berwang is particularly well-suited for individuals or couples.
Berwang Vacation Rental Guest Capacity Trends (2026)
Distribution of Listings by Guest Capacity
Guest Capacity Insights for Berwang
- The most common guest capacity trend in Berwang vacation rentals is listings accommodating 4 guests (28.6%). This suggests the primary traveler segment is likely small families or groups.
- Properties designed for 4 guests and 6 guests dominate the Berwang STR market, accounting for 57.2% of listings.
- 52.4% of properties accommodate 6+ guests, serving the market segment for larger families or group travel in Berwang.
- On average, properties in Berwang are equipped to host 5.2 guests.
Berwang Airbnb Booking Patterns (2026): Available vs. Booked Days
Available Days Distribution
Booked Days Distribution
Booking Pattern Insights for Berwang
- The most common availability pattern in Berwang falls within the 271-366 days range, representing 47.6% of listings. This suggests many properties have significant open periods on their calendars.
- Approximately 90.5% of listings show high availability (181+ days open annually), indicating potential for increased bookings or specific owner usage patterns.
- For booked days, the 91-180 days range is most frequent in Berwang (42.9%), reflecting common guest stay durations or potential owner blocking patterns.
- A notable 9.5% of properties secure long booking periods (181+ days booked per year), highlighting successful long-term rental strategies or significant owner usage.
Berwang Airbnb Minimum Stay Requirements Analysis
Distribution of Listings by Minimum Night Requirement
3 Nights
4 listings
19% of total
4-6 Nights
3 listings
14.3% of total
7-29 Nights
1 listings
4.8% of total
30+ Nights
13 listings
61.9% of total
Key Insights
- The most prevalent minimum stay requirement in Berwang is 30+ Nights, adopted by 61.9% of listings. This highlights the market's preference for longer commitments.
- A significant segment (61.9%) caters to monthly stays (30+ nights) in Berwang, pointing to opportunities in the extended-stay market.
Recommendations
- Align with the market by considering a 30+ Nights minimum stay, as 61.9% of Berwang hosts use this setting.
- Explore offering discounts for stays of 30+ nights to attract the 61.9% of the market seeking extended stays.
- Adjust minimum nights based on seasonality – potentially shorter during low season and longer during peak demand periods in Berwang.
Berwang Airbnb Cancellation Policy Trends Analysis (2026)
Flexible
2 listings
9.5% of total
Moderate
2 listings
9.5% of total
Firm
16 listings
76.2% of total
Strict
1 listings
4.8% of total
Cancellation Policy Insights for Berwang
- The prevailing Airbnb cancellation policy trend in Berwang is Firm, used by 76.2% of listings.
- A majority (81.0%) of hosts in Berwang utilize Firm or Strict policies, indicating a market where hosts prioritize booking security.
- Strict cancellation policies are quite rare (4.8%), potentially making listings with this policy less competitive unless justified by high demand or property type.
Recommendations for Hosts
- Consider adopting a Firm policy to align with the 76.2% market standard in Berwang.
- Using a Strict policy might deter some guests, as only 4.8% of listings use it. Evaluate if potential revenue protection outweighs possible lower booking rates.
- Regularly review your cancellation policy against competitors and market demand shifts in Berwang.
Berwang STR Booking Lead Time Analysis (2026)
Average Booking Lead Time by Month
Booking Lead Time Insights for Berwang
- The overall average booking lead time for vacation rentals in Berwang is 94 days.
- Guests book furthest in advance for stays during August (average 119 days), likely coinciding with peak travel demand or local events.
- The shortest booking windows occur for stays in November (average 40 days), indicating more last-minute travel plans during this time.
- Seasonally, Summer (104 days avg.) sees the longest lead times, while Fall (65 days avg.) has the shortest, reflecting typical travel planning cycles.
Recommendations for Hosts
- Use the overall average lead time (94 days) as a baseline for your pricing and availability strategy in Berwang.
- For August stays, consider implementing length-of-stay discounts or slightly higher rates for bookings made less than 119 days out to capitalize on advance planning.
- Target marketing efforts for the Summer season well in advance (at least 104 days) to capture early planners.
- Monitor your own booking lead times against these Berwang averages to identify opportunities for dynamic pricing adjustments.
Popular & Essential Airbnb Amenities in Berwang (2026)
Amenity Prevalence
Amenity Insights for Berwang
- Essential amenities in Berwang that guests expect include: Free parking on premises, Hot water, Hair dryer, Heating, TV, Dishes and silverware, Wifi, Coffee maker, Bed linens, Hangers. Lacking these (any) could significantly impact bookings.
Recommendations for Hosts
- Ensure your listing includes all essential amenities for Berwang: Free parking on premises, Hot water, Hair dryer, Heating, TV, Dishes and silverware, Wifi, Coffee maker, Bed linens, Hangers.
- Prioritize adding missing essentials: Dishes and silverware, Wifi, Coffee maker, Bed linens, Hangers.
- Highlight unique or less common amenities you offer (e.g., hot tub, dedicated workspace, EV charger) in your listing description and photos.
- Regularly check competitor amenities in Berwang to stay competitive.
Berwang Airbnb Guest Demographics & Profile Analysis (2026)
Guest Profile Summary for Berwang
- The typical guest profile for Airbnb in Berwang consists of predominantly international visitors (98%), with top international origins including Belgium, typically belonging to the Post-2000s (Gen Z/Alpha) group (50%), primarily speaking English or German.
- Domestic travelers account for 2.5% of guests.
- Key international markets include Germany (60%) and Belgium (10%).
- Top languages spoken are English (38.2%) followed by German (30.9%).
- A significant demographic segment is the Post-2000s (Gen Z/Alpha) group, representing 50% of guests.
Recommendations for Hosts
- Focus marketing internationally, particularly towards travelers from Belgium.
- Tailor amenities and listing descriptions to appeal to the dominant Post-2000s (Gen Z/Alpha) demographic (e.g., highlight fast WiFi, smart home features, local guides).
- Highlight unique local experiences or amenities relevant to the primary guest profile.
- Consider seasonal promotions aligned with peak travel times for key origin markets.
Nearby Short-Term Rental Market Comparison
How does the Berwang Airbnb market stack up against its neighbors? Compare key performance metrics like average monthly revenue, ADR, and occupancy rates in surrounding areas to understand the broader regional STR landscape.
| Market | Active Properties | Monthly Revenue | Daily Rate | Avg. Occupancy |
|---|---|---|---|---|
| Sankt Pankraz - San Pancrazio | 12 | $6,528 | $633.65 | 29% |
| Balderschwang | 10 | $5,253 | $304.03 | 58% |
| Urtijëi - St. Ulrich in Gröden - Ortisei | 172 | $5,054 | $718.33 | 41% |
| Bürserberg | 45 | $3,783 | $331.48 | 40% |
| Kiens - Chienes | 17 | $3,715 | $377.77 | 48% |
| Brand | 63 | $3,714 | $522.47 | 31% |
| Varenna | 226 | $3,641 | $300.50 | 52% |
| Kramsach | 12 | $3,573 | $272.32 | 48% |
| Moos in Passeier - Moso in Passiria | 20 | $3,504 | $547.30 | 23% |
| Lajen - Laion | 96 | $3,338 | $548.27 | 36% |