Lechaschau Airbnb Market Analysis 2026: Short Term Rental Data & Vacation Rental Statistics in Tyrol, Austria
Is Airbnb profitable in Lechaschau in 2026? Explore comprehensive Airbnb analytics for Lechaschau, Tyrol, Austria to uncover income potential. This 2026 STR market report for Lechaschau, based on AirROI data from February 2025 to January 2026, reveals key trends in the niche market of 19 active listings.
Whether you're considering an Airbnb investment in Lechaschau, optimizing your existing vacation rental, or exploring rental arbitrage opportunities, understanding the Lechaschau Airbnb data is crucial. Leveraging the low regulation environment is key to maximizing your short term rental income potential. Let's dive into the specifics.
Key Lechaschau Airbnb Performance Metrics Overview
Monthly Airbnb Revenue Variations & Income Potential in Lechaschau (2026)
Understanding the monthly revenue variations for Airbnb listings in Lechaschau is key to maximizing your short term rental income potential. Seasonality significantly impacts earnings. Our analysis, based on data from the past 12 months, shows that the peak revenue month for STRs in Lechaschau is typically August, while January often presents the lowest earnings, highlighting opportunities for strategic pricing adjustments during shoulder and low seasons. Explore the typical Airbnb income in Lechaschau across different performance tiers:
- Best-in-class properties (Top 10%) achieve $3,666+ monthly, often utilizing dynamic pricing and superior guest experiences.
- Strong performing properties (Top 25%) earn $2,508 or more, indicating effective management and desirable locations/amenities.
- Typical properties (Median) generate around $1,838 per month, representing the average market performance.
- Entry-level properties (Bottom 25%) see earnings around $1,025, often with potential for optimization.
Average Monthly Airbnb Earnings Trend in Lechaschau
Lechaschau Airbnb Occupancy Rate Trends (2026)
Maximize your bookings by understanding the Lechaschau STR occupancy trends. Seasonal demand shifts significantly influence how often properties are booked. Typically, Augustsees the highest demand (peak season occupancy), while January experiences the lowest (low season). Effective strategies, like adjusting minimum stays or offering promotions, can boost occupancy during slower periods. Here's how different property tiers perform in Lechaschau:
- Best-in-class properties (Top 10%) achieve 80%+ occupancy, indicating high desirability and potentially optimized availability.
- Strong performing properties (Top 25%) maintain 69% or higher occupancy, suggesting good market fit and guest satisfaction.
- Typical properties (Median) have an occupancy rate around 45%.
- Entry-level properties (Bottom 25%) average 22% occupancy, potentially facing higher vacancy.
Average Monthly Occupancy Rate Trend in Lechaschau
Average Daily Rate (ADR) Airbnb Trends in Lechaschau (2026)
Effective short term rental pricing strategy in Lechaschau involves understanding monthly ADR fluctuations. The Average Daily Rate (ADR) for Airbnb in Lechaschau typically peaks in August and dips lowest during May. Leveraging Airbnb dynamic pricing tools or strategies based on this seasonality can significantly boost revenue. Here's a look at the typical nightly rates achieved:
- Best-in-class properties (Top 10%) command rates of $210+ per night, often due to premium features or locations.
- Strong performing properties (Top 25%) achieve nightly rates of $167 or more.
- Typical properties (Median) charge around $129 per night.
- Entry-level properties (Bottom 25%) earn around $108 per night.
Average Daily Rate (ADR) Trend by Month in Lechaschau
Get Live Lechaschau Market Intelligence 👇

Explore Real-time Analytics
Airbnb Seasonality Analysis & Trends in Lechaschau (2026)
Peak Season (August, July, September)
- Revenue averages $3,149 per month
- Occupancy rates average 65.3%
- Daily rates average $193
Shoulder Season
- Revenue averages $1,819 per month
- Occupancy maintains around 43.2%
- Daily rates hold near $154
Low Season (January, February, November)
- Revenue drops to average $1,317 per month
- Occupancy decreases to average 35.8%
- Daily rates adjust to average $166
Seasonality Insights for Lechaschau
- The Airbnb seasonality in Lechaschau shows highly seasonal trends requiring careful strategy. While the sections above show seasonal averages, it's also insightful to look at the extremes:
- During the high season, the absolute peak month showcases Lechaschau's highest earning potential, with monthly revenues capable of climbing to $3,687, occupancy reaching a high of 73.7%, and ADRs peaking at $203.
- Conversely, the slowest single month of the year, typically falling within the low season, marks the market's lowest point. In this month, revenue might dip to $1,168, occupancy could drop to 27.4%, and ADRs may adjust down to $142.
- Understanding both the seasonal averages and these monthly peaks and troughs in revenue, occupancy, and ADR is crucial for maximizing your Airbnb profit potential in Lechaschau.
Seasonal Strategies for Maximizing Profit
- Peak Season: Maximize revenue through premium pricing and potentially longer minimum stays. Ensure high availability.
- Low Season: Offer competitive pricing, special promotions (e.g., extended stay discounts), and flexible cancellation policies. Target off-season travelers like remote workers or budget-conscious guests.
- Shoulder Seasons: Implement dynamic pricing that balances peak and low rates. Target weekend travelers or specific events. Offer slightly more flexible terms than peak season.
- Regularly analyze your own performance against these Lechaschau seasonality benchmarks and adjust your pricing and availability strategy accordingly.
Best Areas for Airbnb Investment in Lechaschau (2026)
Exploring the top neighborhoods for short-term rentals in Lechaschau? This section highlights key areas, outlining why they are attractive for hosts and guests, along with notable local attractions. Consider these locations based on your target guest profile and investment strategy.
| Neighborhood / Area | Why Host Here? (Target Guests & Appeal) | Key Attractions & Landmarks |
|---|---|---|
| Lechaschau Center | Quaint village center with traditional Tyrolean charm. Close to local restaurants and shops, making it an ideal spot for guests looking to experience authentic Alpine culture. | Local restaurants, Tyrolean cafes, Village square, Historic church, Nearby hiking trails |
| Reutte Valley | Stunning valley known for its breathtaking mountain views and outdoor activities. A great selection for adventure seekers and nature lovers visiting the area. | Hiking and biking trails, Reutte Castle, Lechtal Nature Park, Alpine lakes, Winter sports facilities |
| Tannheim Valley | A picturesque valley renowned for its stunning scenery and outdoor pursuits, perfect for tourists looking to enjoy the beauty of the Tyrol region. | Tannheim Lakes, Hiking routes, Ski resorts, Traditional Bavarian villages, Scenic viewpoints |
| Füssen | Just a short drive from Lechaschau, Füssen offers a blend of history and nature, with attractions like Neuschwanstein Castle nearby, making it appealing for tourists. | Neuschwanstein Castle, Hohenschwangau Castle, Füssen old town, Lake Forggen, Cultural festivals |
| Ehrenberg Ruins | Historic ruins offering stunning views and a glimpse into medieval history. A unique site for guests interested in history and culture. | Ehrenberg Fortress, Cable car rides, Walking paths, Guided tours, Cultural events |
| Lermoos | A charming village with a backdrop of the Zugspitze mountain. Offers numerous recreational activities and is popular with tourists seeking relaxation or adventure. | Zugspitze experiences, Golf courses, Winter sports, Hiking and climbing, Scenic views |
| Garmisch-Partenkirchen | Famous mountain resort town in Bavaria, just a short drive away. Attractive for international tourists with its renowned skiing and beautiful landscapes. | Zugspitze, Partnach Gorge, Olympia Ski Stadium, Historic streets, Hiking and climbing opportunities |
| Tyrol's Lake Region | A collection of scenic lakes in the region, each offering unique water activities and relaxation opportunities for visitors seeking tranquil getaways. | Lake Plansee, Boating activities, Swimming spots, Hiking nearby, Picnic areas |
Understanding Airbnb License Requirements & STR Laws in Lechaschau (2026)
While Lechaschau, Tyrol, Austria currently shows low STR regulations, specific Airbnb license requirements might still exist or change. Always verify the latest short term rental regulations and Airbnb license requirements directly with local government authorities for Lechaschau to ensure full compliance before hosting.
(Source: AirROI data, 2026, finding no licensed listings among those analyzed)
Top Performing Airbnb Properties in Lechaschau (2026)
Benchmark your potential! Explore examples of top-performing Airbnb properties in Lechaschaubased on Trailing Twelve Month (TTM) revenue. Analyze their characteristics, revenue, occupancy rate, and ADR to understand what drives success in this market.

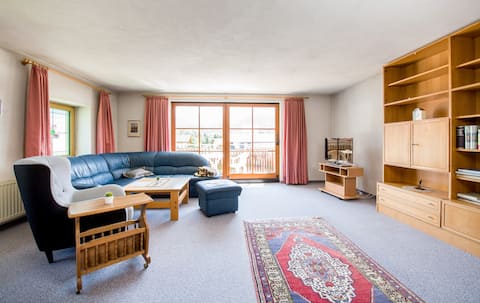
Sandi's vacation home
Entire Place • 3 bedrooms
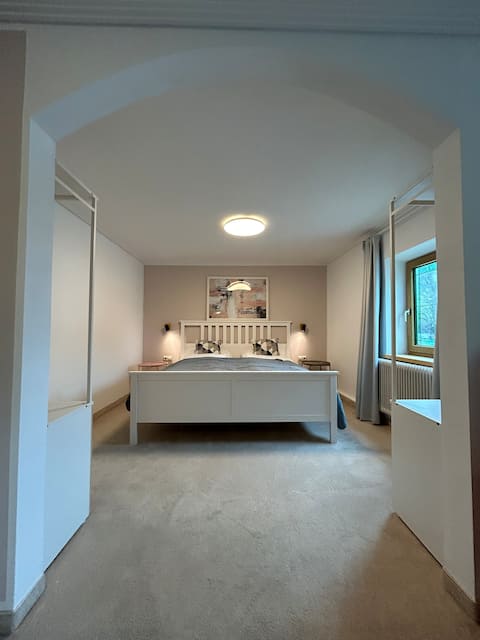
Wonderful bright apartment with balcony
Entire Place • 3 bedrooms
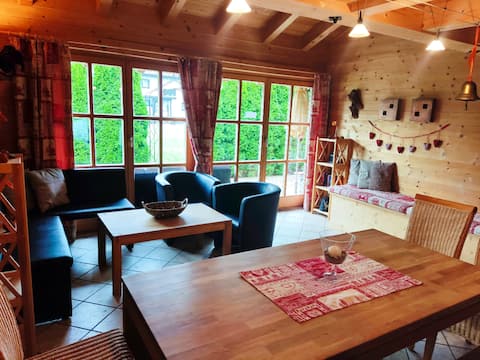
Cozy and Historic Mountain View
Entire Place • 1 bedroom
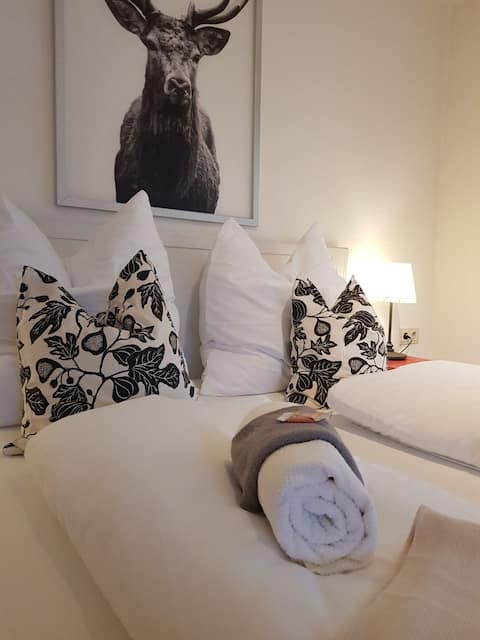
Log cabin with private Sauna * Landhaus Panorama
Entire Place • 3 bedrooms
Cozy apartment with a great view, balcony & garden
Entire Place • N/A

Apartment R. Top 4
Entire Place • 4 bedrooms
Note: Performance varies based on location, size, amenities, seasonality, and management quality. Data reflects the past 12 months.
Top Performing Airbnb Hosts in Lechaschau (2026)
Learn from the best! This table showcases top-performing Airbnb hosts in Lechaschau based on the number of properties managed and estimated total revenue over the past year. Analyze their scale and performance metrics.
| Host Name | Properties | Grossing Revenue | Stay Reviews | Avg Rating |
|---|---|---|---|---|
| Maria | 4 | $79,593 | 326 | 4.95/5.0 |
| Flo | 2 | $65,208 | 411 | 4.63/5.0 |
| Harald Und Bettina | 5 | $46,839 | 182 | 4.90/5.0 |
| Sandra | 1 | $41,080 | 18 | 5.00/5.0 |
| Max | 1 | $38,308 | 317 | 4.74/5.0 |
| Armella | 1 | $22,234 | 157 | 4.85/5.0 |
| Tashi | 1 | $16,574 | 140 | 4.96/5.0 |
| Werner | 1 | $16,313 | 38 | 4.89/5.0 |
| Viktor | 1 | $12,487 | 71 | 4.93/5.0 |
| Lisa-Marie | 1 | $9,398 | 1 | Not Rated |
Analyzing the strategies of top hosts, such as their property selection, pricing, and guest communication, can offer valuable lessons for optimizing your own Airbnb operations in Lechaschau.
Dive Deeper: Advanced Lechaschau STR Market Data (2026)
Ready to unlock more insights? AirROI provides access to advanced metrics and comprehensive Airbnb data for Lechaschau. Explore detailed analytics beyond this report to refine your investment strategy, optimize pricing, and maximize your vacation rental profits.
Explore Advanced MetricsLechaschau Short-Term Rental Market Composition (2026): Property & Room Types
Room Type Distribution
Property Type Distribution
Market Composition Insights for Lechaschau
- The Lechaschau Airbnb market composition is heavily skewed towards Entire Home/Apt listings, which make up 100% of the 19 active rentals. This indicates strong guest preference for privacy and space.
- Looking at the property type distribution in Lechaschau, Apartment/Condo properties are the most common (89.5%), reflecting the local real estate landscape.
Lechaschau Airbnb Room Capacity Analysis (2026): Bedroom Distribution
Distribution of Listings by Number of Bedrooms
Room Capacity Insights for Lechaschau
- The dominant room capacity in Lechaschau is 1 bedroom listings, making up 52.6% of the market. This suggests a strong demand for properties suitable for couples or solo travelers.
- Together, 1 bedroom and 3 bedrooms properties represent 73.7% of the active Airbnb listings in Lechaschau, indicating a high concentration in these sizes.
- With over half the market (52.6%) consisting of studios or 1-bedroom units, Lechaschau is particularly well-suited for individuals or couples.
- A significant 26.4% of listings offer 3+ bedrooms, catering to larger groups and families seeking more space in Lechaschau.
Lechaschau Vacation Rental Guest Capacity Trends (2026)
Distribution of Listings by Guest Capacity
Guest Capacity Insights for Lechaschau
- The most common guest capacity trend in Lechaschau vacation rentals is listings accommodating 4 guests (42.1%). This suggests the primary traveler segment is likely small families or groups.
- Properties designed for 4 guests and 8+ guests dominate the Lechaschau STR market, accounting for 63.2% of listings.
- 31.7% of properties accommodate 6+ guests, serving the market segment for larger families or group travel in Lechaschau.
- On average, properties in Lechaschau are equipped to host 4.9 guests.
Lechaschau Airbnb Booking Patterns (2026): Available vs. Booked Days
Available Days Distribution
Booked Days Distribution
Booking Pattern Insights for Lechaschau
- The most common availability pattern in Lechaschau falls within the 181-270 days range, representing 36.8% of listings. This suggests many properties have significant open periods on their calendars.
- Approximately 73.6% of listings show high availability (181+ days open annually), indicating potential for increased bookings or specific owner usage patterns.
- For booked days, the 91-180 days range is most frequent in Lechaschau (36.8%), reflecting common guest stay durations or potential owner blocking patterns.
- A notable 26.3% of properties secure long booking periods (181+ days booked per year), highlighting successful long-term rental strategies or significant owner usage.
Lechaschau Airbnb Minimum Stay Requirements Analysis
Distribution of Listings by Minimum Night Requirement
2 Nights
4 listings
21.1% of total
3 Nights
5 listings
26.3% of total
4-6 Nights
1 listings
5.3% of total
30+ Nights
9 listings
47.4% of total
Key Insights
- The most prevalent minimum stay requirement in Lechaschau is 30+ Nights, adopted by 47.4% of listings. This highlights the market's preference for longer commitments.
- A significant segment (47.4%) caters to monthly stays (30+ nights) in Lechaschau, pointing to opportunities in the extended-stay market.
Recommendations
- Align with the market by considering a 30+ Nights minimum stay, as 47.4% of Lechaschau hosts use this setting.
- Explore offering discounts for stays of 30+ nights to attract the 47.4% of the market seeking extended stays.
- Adjust minimum nights based on seasonality – potentially shorter during low season and longer during peak demand periods in Lechaschau.
Lechaschau Airbnb Cancellation Policy Trends Analysis (2026)
Flexible
4 listings
21.1% of total
Moderate
4 listings
21.1% of total
Firm
4 listings
21.1% of total
Strict
7 listings
36.8% of total
Cancellation Policy Insights for Lechaschau
- The prevailing Airbnb cancellation policy trend in Lechaschau is Strict, used by 36.8% of listings.
- A majority (57.9%) of hosts in Lechaschau utilize Firm or Strict policies, indicating a market where hosts prioritize booking security.
Recommendations for Hosts
- Consider adopting a Strict policy to align with the 36.8% market standard in Lechaschau.
- With 36.8% using Strict terms, this is a viable option in Lechaschau, particularly for high-value properties or during peak demand periods.
- Regularly review your cancellation policy against competitors and market demand shifts in Lechaschau.
Lechaschau STR Booking Lead Time Analysis (2026)
Average Booking Lead Time by Month
Booking Lead Time Insights for Lechaschau
- The overall average booking lead time for vacation rentals in Lechaschau is 62 days.
- Guests book furthest in advance for stays during December (average 102 days), likely coinciding with peak travel demand or local events.
- The shortest booking windows occur for stays in November (average 18 days), indicating more last-minute travel plans during this time.
- Seasonally, Summer (92 days avg.) sees the longest lead times, while Fall (40 days avg.) has the shortest, reflecting typical travel planning cycles.
Recommendations for Hosts
- Use the overall average lead time (62 days) as a baseline for your pricing and availability strategy in Lechaschau.
- For December stays, consider implementing length-of-stay discounts or slightly higher rates for bookings made less than 102 days out to capitalize on advance planning.
- Target marketing efforts for the Summer season well in advance (at least 92 days) to capture early planners.
- Monitor your own booking lead times against these Lechaschau averages to identify opportunities for dynamic pricing adjustments.
Popular & Essential Airbnb Amenities in Lechaschau (2026)
Amenity Prevalence
Amenity Insights for Lechaschau
- Essential amenities in Lechaschau that guests expect include: Wifi, Kitchen. Lacking these (any) could significantly impact bookings.
- Popular amenities like Heating, TV, Hangers are common but not universal. Offering these can provide a competitive edge.
Recommendations for Hosts
- Ensure your listing includes all essential amenities for Lechaschau: Wifi, Kitchen.
- Consider adding popular differentiators like Heating or TV to increase appeal.
- Highlight unique or less common amenities you offer (e.g., hot tub, dedicated workspace, EV charger) in your listing description and photos.
- Regularly check competitor amenities in Lechaschau to stay competitive.
Lechaschau Airbnb Guest Demographics & Profile Analysis (2026)
Guest Profile Summary for Lechaschau
- The typical guest profile for Airbnb in Lechaschau consists of predominantly international visitors (99%), with top international origins including Netherlands, typically belonging to the Post-2000s (Gen Z/Alpha) group (50%), primarily speaking English or German.
- Domestic travelers account for 1.2% of guests.
- Key international markets include Germany (52.4%) and Netherlands (10%).
- Top languages spoken are English (44.7%) followed by German (27.9%).
- A significant demographic segment is the Post-2000s (Gen Z/Alpha) group, representing 50% of guests.
Recommendations for Hosts
- Focus marketing internationally, particularly towards travelers from Netherlands.
- Tailor amenities and listing descriptions to appeal to the dominant Post-2000s (Gen Z/Alpha) demographic (e.g., highlight fast WiFi, smart home features, local guides).
- Highlight unique local experiences or amenities relevant to the primary guest profile.
- Consider seasonal promotions aligned with peak travel times for key origin markets.
Nearby Short-Term Rental Market Comparison
How does the Lechaschau Airbnb market stack up against its neighbors? Compare key performance metrics like average monthly revenue, ADR, and occupancy rates in surrounding areas to understand the broader regional STR landscape.
| Market | Active Properties | Monthly Revenue | Daily Rate | Avg. Occupancy |
|---|---|---|---|---|
| Sankt Pankraz - San Pancrazio | 12 | $6,528 | $633.65 | 29% |
| Balderschwang | 10 | $5,253 | $304.03 | 58% |
| Urtijëi - St. Ulrich in Gröden - Ortisei | 172 | $5,054 | $718.33 | 41% |
| Bürserberg | 45 | $3,783 | $331.48 | 40% |
| Kiens - Chienes | 17 | $3,715 | $377.77 | 48% |
| Brand | 63 | $3,714 | $522.47 | 31% |
| Varenna | 226 | $3,641 | $300.50 | 52% |
| Kramsach | 12 | $3,573 | $272.32 | 48% |
| Moos in Passeier - Moso in Passiria | 20 | $3,504 | $547.30 | 23% |
| Lajen - Laion | 96 | $3,338 | $548.27 | 36% |