Bimini Airbnb Market Analysis 2025: Short Term Rental Data & Vacation Rental Statistics in Bimini, Bahamas
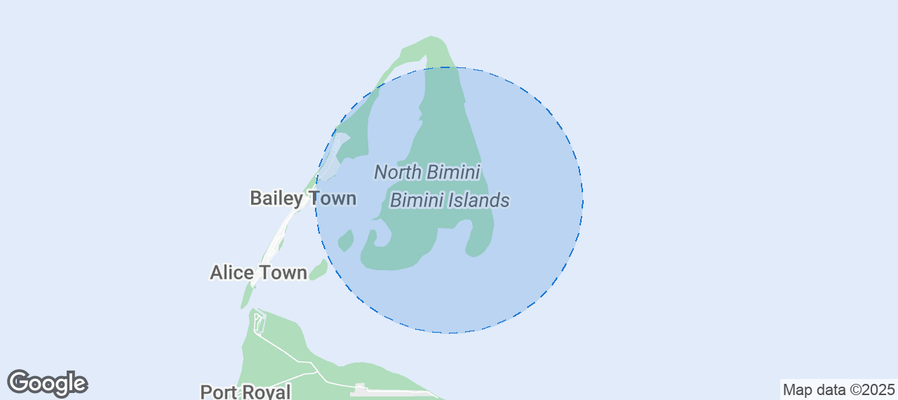
Is Airbnb profitable in Bimini in 2025? Explore comprehensive Airbnb analytics for Bimini, Bimini, Bahamas to uncover income potential. This 2025 STR market report for Bimini, based on AirROI data from August 2024 to July 2025, reveals key trends in the market of 217 active listings.
Whether you're considering an Airbnb investment in Bimini, optimizing your existing vacation rental, or exploring rental arbitrage opportunities, understanding the Bimini Airbnb data is crucial. Leveraging the low regulation environment is key to maximizing your short term rental income potential. Let's dive into the specifics.
Key Bimini Airbnb Performance Metrics Overview
Monthly Airbnb Revenue Variations & Income Potential in Bimini (2025)
Understanding the monthly revenue variations for Airbnb listings in Bimini is key to maximizing your short term rental income potential. Seasonality significantly impacts earnings. Our analysis, based on data from the past 12 months, shows that the peak revenue month for STRs in Bimini is typically July, while January often presents the lowest earnings, highlighting opportunities for strategic pricing adjustments during shoulder and low seasons. Explore the typical Airbnb income in Bimini across different performance tiers:
- Best-in-class properties (Top 10%) achieve $10,472+ monthly, often utilizing dynamic pricing and superior guest experiences.
- Strong performing properties (Top 25%) earn $5,465 or more, indicating effective management and desirable locations/amenities.
- Typical properties (Median) generate around $2,896 per month, representing the average market performance.
- Entry-level properties (Bottom 25%) see earnings around $1,473, often with potential for optimization.
Average Monthly Airbnb Earnings Trend in Bimini
Bimini Airbnb Occupancy Rate Trends (2025)
Maximize your bookings by understanding the Bimini STR occupancy trends. Seasonal demand shifts significantly influence how often properties are booked. Typically, Junesees the highest demand (peak season occupancy), while January experiences the lowest (low season). Effective strategies, like adjusting minimum stays or offering promotions, can boost occupancy during slower periods. Here's how different property tiers perform in Bimini:
- Best-in-class properties (Top 10%) achieve 59%+ occupancy, indicating high desirability and potentially optimized availability.
- Strong performing properties (Top 25%) maintain 41% or higher occupancy, suggesting good market fit and guest satisfaction.
- Typical properties (Median) have an occupancy rate around 26%.
- Entry-level properties (Bottom 25%) average 14% occupancy, potentially facing higher vacancy.
Average Monthly Occupancy Rate Trend in Bimini
Average Daily Rate (ADR) Airbnb Trends in Bimini (2025)
Effective short term rental pricing strategy in Bimini involves understanding monthly ADR fluctuations. The Average Daily Rate (ADR) for Airbnb in Bimini typically peaks in July and dips lowest during February. Leveraging Airbnb dynamic pricing tools or strategies based on this seasonality can significantly boost revenue. Here's a look at the typical nightly rates achieved:
- Best-in-class properties (Top 10%) command rates of $1,303+ per night, often due to premium features or locations.
- Strong performing properties (Top 25%) achieve nightly rates of $540 or more.
- Typical properties (Median) charge around $355 per night.
- Entry-level properties (Bottom 25%) earn around $275 per night.
Average Daily Rate (ADR) Trend by Month in Bimini
Get Live Bimini Market Intelligence 👇
Explore Real-time Analytics
Airbnb Seasonality Analysis & Trends in Bimini (2025)
Peak Season (July, June, March)
- Revenue averages $7,022 per month
- Occupancy rates average 38.0%
- Daily rates average $589
Shoulder Season
- Revenue averages $4,682 per month
- Occupancy maintains around 29.2%
- Daily rates hold near $548
Low Season (January, October, November)
- Revenue drops to average $3,022 per month
- Occupancy decreases to average 22.4%
- Daily rates adjust to average $529
Seasonality Insights for Bimini
- The Airbnb seasonality in Bimini shows highly seasonal trends requiring careful strategy. While the sections above show seasonal averages, it's also insightful to look at the extremes:
- During the high season, the absolute peak month showcases Bimini's highest earning potential, with monthly revenues capable of climbing to $7,625, occupancy reaching a high of 41.9%, and ADRs peaking at $611.
- Conversely, the slowest single month of the year, typically falling within the low season, marks the market's lowest point. In this month, revenue might dip to $2,644, occupancy could drop to 20.8%, and ADRs may adjust down to $519.
- Understanding both the seasonal averages and these monthly peaks and troughs in revenue, occupancy, and ADR is crucial for maximizing your Airbnb profit potential in Bimini.
Seasonal Strategies for Maximizing Profit
- Peak Season: Maximize revenue through premium pricing and potentially longer minimum stays. Ensure high availability.
- Low Season: Offer competitive pricing, special promotions (e.g., extended stay discounts), and flexible cancellation policies. Target off-season travelers like remote workers or budget-conscious guests.
- Shoulder Seasons: Implement dynamic pricing that balances peak and low rates. Target weekend travelers or specific events. Offer slightly more flexible terms than peak season.
- Regularly analyze your own performance against these Bimini seasonality benchmarks and adjust your pricing and availability strategy accordingly.
Best Areas for Airbnb Investment in Bimini (2025)
Exploring the top neighborhoods for short-term rentals in Bimini? This section highlights key areas, outlining why they are attractive for hosts and guests, along with notable local attractions. Consider these locations based on your target guest profile and investment strategy.
| Neighborhood / Area | Why Host Here? (Target Guests & Appeal) | Key Attractions & Landmarks |
|---|---|---|
| Alice Town | The main settlement on Bimini known for its rich history and proximity to local attractions. A great hub for visitors who want to explore Bimini's culture and enjoy the relaxed island lifestyle. | Bimini Undersea, Bimini Museum, Bimini Bay Resort, Rainbow Reef, Bimini Sands Resort |
| Pigeon Cay | A secluded area known for its stunning beaches and crystal-clear waters. Ideal for guests looking for a private getaway with easy access to water activities. | Pigeon Cay Beach, soft white sand, snorkeling and diving experiences, clearest waters around Bimini |
| North Bimini | Home to the beautiful beaches and luxury resorts of Bimini. Attracts tourists seeking a more upscale vacation experience with access to fine dining and resorts. | Paradise Beach, Bimini SuperFast Casino, Resorts World Bimini, Bimini Beach Club, Bimini underwater park |
| South Bimini | A quieter part of the island known for its natural beauty and tranquility. Popular among those looking to escape the crowds and enjoy nature. | Bimini Nature Trail, whale watching, fishing spots, beautiful secluded beaches, nature and hiking trails |
| Bimini Road | Famous for its mysterious underwater rock formation and snorkeling spots. Attracts adventurous travelers looking to explore marine life and history. | Bimini Road formation, scuba diving spots, nearby shipwrecks, accessible marine life, historical significance |
| Gun Cay | A small uninhabited island with beautiful landscapes. Great for day trips and those looking to discover untouched nature. | Gun Cay Beach, caribbean charm, island hopping, secluded beach experience, marine adventures |
| The Resort World Bimini | A large resort area offering luxury accommodations and amenities. Popular with travelers seeking an all-inclusive experience and various recreational activities. | Resort pools, private beaches, nightlife and entertainment, water sports facilities, spa services |
| Bimini Bay | A picturesque area with luxurious villas and great proximity to the marina. Perfect for guests looking for upscale vacation rentals and water activities. | Bimini Bonefish Club, local dining experiences, yacht and fishing charters, beautiful waterfront views, Bimini markets |
Understanding Airbnb License Requirements & STR Laws in Bimini (2025)
While Bimini, Bimini, Bahamas currently shows low STR regulations, specific Airbnb license requirements might still exist or change. Always verify the latest short term rental regulations and Airbnb license requirements directly with local government authorities for Bimini to ensure full compliance before hosting.
(Source: AirROI data, 2025, based on 0% licensed listings)
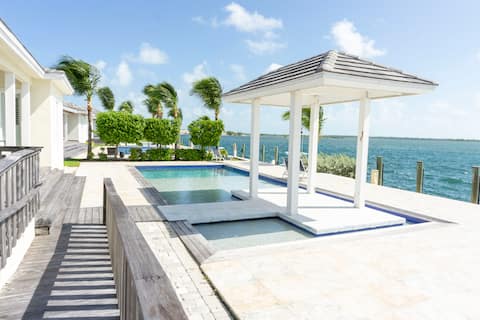
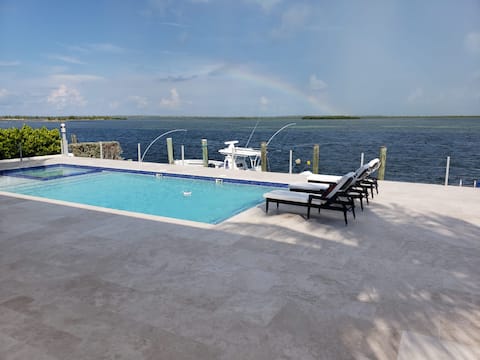
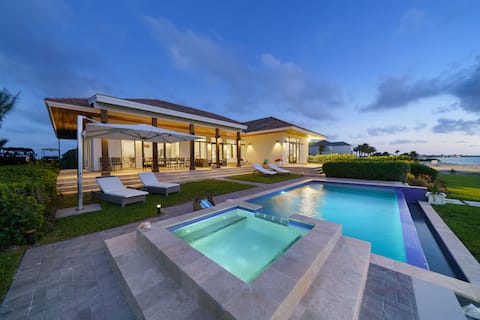
Top Performing Airbnb Properties in Bimini (2025)
Benchmark your potential! Explore examples of top-performing Airbnb properties in Biminibased on Trailing Twelve Month (TTM) revenue. Analyze their characteristics, revenue, occupancy rate, and ADR to understand what drives success in this market.
Bimini Bay Getaway & Golf Cart
Entire Place • 5 bedrooms
Relax beach house.
Entire Place • 5 bedrooms
Luxurious beachfront home w/pool
Entire Place • 4 bedrooms

Amamare Waterfront Villa | Pool, Dock & Games
Entire Place • 4 bedrooms
Villa on the Beach | Heated Pool | Corsair Key
Entire Place • 4 bedrooms
Bimini Bay Island Luxury Home
Entire Place • 5 bedrooms
Note: Performance varies based on location, size, amenities, seasonality, and management quality. Data reflects the past 12 months.
Top Performing Airbnb Hosts in Bimini (2025)
Learn from the best! This table showcases top-performing Airbnb hosts in Bimini based on the number of properties managed and estimated total revenue over the past year. Analyze their scale and performance metrics.
| Host Name | Properties | Grossing Revenue | Stay Reviews | Avg Rating |
|---|---|---|---|---|
| GG Property Management | 13 | $609,374 | 189 | 4.83/5.0 |
| Don | 15 | $443,467 | 533 | 4.84/5.0 |
| Tissurra | 1 | $371,396 | 58 | 4.69/5.0 |
| Monica | 2 | $333,381 | 48 | 4.93/5.0 |
| Ramses | 2 | $302,417 | 17 | 5.00/5.0 |
| Noel | 1 | $299,788 | 10 | 5.00/5.0 |
| Bimini Bay View | 7 | $258,292 | 102 | 4.88/5.0 |
| Yaikelis | 1 | $255,194 | 32 | 4.97/5.0 |
| Latitude Key | 1 | $251,375 | 5 | 5.00/5.0 |
| Edward | 1 | $232,271 | 5 | 4.60/5.0 |
Analyzing the strategies of top hosts, such as their property selection, pricing, and guest communication, can offer valuable lessons for optimizing your own Airbnb operations in Bimini.
Dive Deeper: Advanced Bimini STR Market Data (2025)
Ready to unlock more insights? AirROI provides access to advanced metrics and comprehensive Airbnb data for Bimini. Explore detailed analytics beyond this report to refine your investment strategy, optimize pricing, and maximize your vacation rental profits.
Explore Advanced MetricsBimini Short-Term Rental Market Composition (2025): Property & Room Types
Room Type Distribution
Property Type Distribution
Market Composition Insights for Bimini
- The Bimini Airbnb market composition is heavily skewed towards Entire Home/Apt listings, which make up 96.3% of the 217 active rentals. This indicates strong guest preference for privacy and space.
- Looking at the property type distribution in Bimini, Apartment/Condo properties are the most common (53.5%), reflecting the local real estate landscape.
- Houses represent a significant 42.9% portion, catering likely to families or larger groups.
- Smaller segments like others, hotel/boutique, unique stays, outdoor/unique (combined 3.8%) offer potential for unique stay experiences.
Bimini Airbnb Room Capacity Analysis (2025): Bedroom Distribution
Distribution of Listings by Number of Bedrooms
Room Capacity Insights for Bimini
- The dominant room capacity in Bimini is 2 bedrooms listings, making up 43.3% of the market. This suggests a strong demand for properties suitable for couples or solo travelers.
- Together, 2 bedrooms and 3 bedrooms properties represent 62.7% of the active Airbnb listings in Bimini, indicating a high concentration in these sizes.
- A significant 32.8% of listings offer 3+ bedrooms, catering to larger groups and families seeking more space in Bimini.
Bimini Vacation Rental Guest Capacity Trends (2025)
Distribution of Listings by Guest Capacity
Guest Capacity Insights for Bimini
- The most common guest capacity trend in Bimini vacation rentals is listings accommodating 6 guests (34.6%). This suggests the primary traveler segment is likely larger groups.
- Properties designed for 6 guests and 8+ guests dominate the Bimini STR market, accounting for 65.9% of listings.
- 65.9% of properties accommodate 6+ guests, serving the market segment for larger families or group travel in Bimini.
- On average, properties in Bimini are equipped to host 5.7 guests.
Bimini Airbnb Booking Patterns (2025): Available vs. Booked Days
Available Days Distribution
Booked Days Distribution
Booking Pattern Insights for Bimini
- The most common availability pattern in Bimini falls within the 271-366 days range, representing 69.6% of listings. This suggests many properties have significant open periods on their calendars.
- Approximately 95.9% of listings show high availability (181+ days open annually), indicating potential for increased bookings or specific owner usage patterns.
- For booked days, the 31-90 days range is most frequent in Bimini (48.8%), reflecting common guest stay durations or potential owner blocking patterns.
- A notable 4.1% of properties secure long booking periods (181+ days booked per year), highlighting successful long-term rental strategies or significant owner usage.
Bimini Airbnb Minimum Stay Requirements Analysis
Distribution of Listings by Minimum Night Requirement
1 Night
31 listings
14.6% of total
2 Nights
94 listings
44.1% of total
3 Nights
35 listings
16.4% of total
4-6 Nights
3 listings
1.4% of total
30+ Nights
50 listings
23.5% of total
Key Insights
- The most prevalent minimum stay requirement in Bimini is 2 Nights, adopted by 44.1% of listings. This highlights the market's preference for shorter, flexible bookings.
- A significant segment (23.5%) caters to monthly stays (30+ nights) in Bimini, pointing to opportunities in the extended-stay market.
Recommendations
- Align with the market by considering a 2 Nights minimum stay, as 44.1% of Bimini hosts use this setting.
- If feasible, allowing 1-night stays, especially midweek or during low season, could capture last-minute bookings, as only 14.6% currently do.
- A 2-night minimum appears standard (44.1%). Consider this for weekends or peak periods.
- Explore offering discounts for stays of 30+ nights to attract the 23.5% of the market seeking extended stays.
- Adjust minimum nights based on seasonality – potentially shorter during low season and longer during peak demand periods in Bimini.
Bimini Airbnb Cancellation Policy Trends Analysis (2025)
Super Strict 60 Days
1 listings
0.5% of total
Flexible
39 listings
18.2% of total
Moderate
59 listings
27.6% of total
Firm
66 listings
30.8% of total
Strict
49 listings
22.9% of total
Cancellation Policy Insights for Bimini
- The prevailing Airbnb cancellation policy trend in Bimini is Firm, used by 30.8% of listings.
- A majority (53.7%) of hosts in Bimini utilize Firm or Strict policies, indicating a market where hosts prioritize booking security.
Recommendations for Hosts
- Consider adopting a Firm policy to align with the 30.8% market standard in Bimini.
- Regularly review your cancellation policy against competitors and market demand shifts in Bimini.
Bimini STR Booking Lead Time Analysis (2025)
Average Booking Lead Time by Month
Booking Lead Time Insights for Bimini
- The overall average booking lead time for vacation rentals in Bimini is 56 days.
- Guests book furthest in advance for stays during May (average 131 days), likely coinciding with peak travel demand or local events.
- The shortest booking windows occur for stays in September (average 26 days), indicating more last-minute travel plans during this time.
- Seasonally, Spring (74 days avg.) sees the longest lead times, while Fall (30 days avg.) has the shortest, reflecting typical travel planning cycles.
Recommendations for Hosts
- Use the overall average lead time (56 days) as a baseline for your pricing and availability strategy in Bimini.
- For May stays, consider implementing length-of-stay discounts or slightly higher rates for bookings made less than 131 days out to capitalize on advance planning.
- Target marketing efforts for the Spring season well in advance (at least 74 days) to capture early planners.
- Monitor your own booking lead times against these Bimini averages to identify opportunities for dynamic pricing adjustments.
Popular & Essential Airbnb Amenities in Bimini (2025)
Amenity Prevalence
Amenity Insights for Bimini
- Essential amenities in Bimini that guests expect include: Air conditioning, Wifi. Lacking these (any) could significantly impact bookings.
- Popular amenities like TV, Kitchen, Smoke alarm are common but not universal. Offering these can provide a competitive edge.
Recommendations for Hosts
- Ensure your listing includes all essential amenities for Bimini: Air conditioning, Wifi.
- Prioritize adding missing essentials: Air conditioning, Wifi.
- Consider adding popular differentiators like TV or Kitchen to increase appeal.
- Highlight unique or less common amenities you offer (e.g., hot tub, dedicated workspace, EV charger) in your listing description and photos.
- Regularly check competitor amenities in Bimini to stay competitive.
Bimini Airbnb Guest Demographics & Profile Analysis (2025)
Guest Profile Summary for Bimini
- The typical guest profile for Airbnb in Bimini consists of predominantly international visitors (95%), with top international origins including Bahamas, typically belonging to the Post-2000s (Gen Z/Alpha) group (50%), primarily speaking English or Spanish.
- Domestic travelers account for 5.4% of guests.
- Key international markets include United States (85.4%) and Bahamas (5.4%).
- Top languages spoken are English (58%) followed by Spanish (30.9%).
- A significant demographic segment is the Post-2000s (Gen Z/Alpha) group, representing 50% of guests.
Recommendations for Hosts
- Focus marketing internationally, particularly towards travelers from Bahamas.
- Tailor amenities and listing descriptions to appeal to the dominant Post-2000s (Gen Z/Alpha) demographic (e.g., highlight fast WiFi, smart home features, local guides).
- Highlight unique local experiences or amenities relevant to the primary guest profile.
- Consider seasonal promotions aligned with peak travel times for key origin markets.
Nearby Short-Term Rental Market Comparison
How does the Bimini Airbnb market stack up against its neighbors? Compare key performance metrics like average monthly revenue, ADR, and occupancy rates in surrounding areas to understand the broader regional STR landscape.
| Market | Active Properties | Monthly Revenue | Daily Rate | Avg. Occupancy |
|---|---|---|---|---|
| Bal Harbour Village | 39 | $9,338 | $848.10 | 37% |
| Lake Clarke Shores | 28 | $7,162 | $501.48 | 51% |
| North Bay Village | 124 | $5,788 | $507.23 | 47% |
| Pinecrest | 14 | $5,660 | $637.33 | 48% |
| Lighthouse Point | 86 | $5,620 | $459.86 | 51% |
| Duck Key | 59 | $5,505 | $463.19 | 43% |
| Key Biscayne | 112 | $5,166 | $455.44 | 50% |
| Ocean Ridge | 13 | $4,824 | $631.34 | 51% |
| Miami Shores | 88 | $4,596 | $433.15 | 49% |
| Juno Beach | 37 | $4,533 | $368.05 | 45% |