New Providence Airbnb Market Analysis 2025: Short Term Rental Data & Vacation Rental Statistics in New Providence, Bahamas
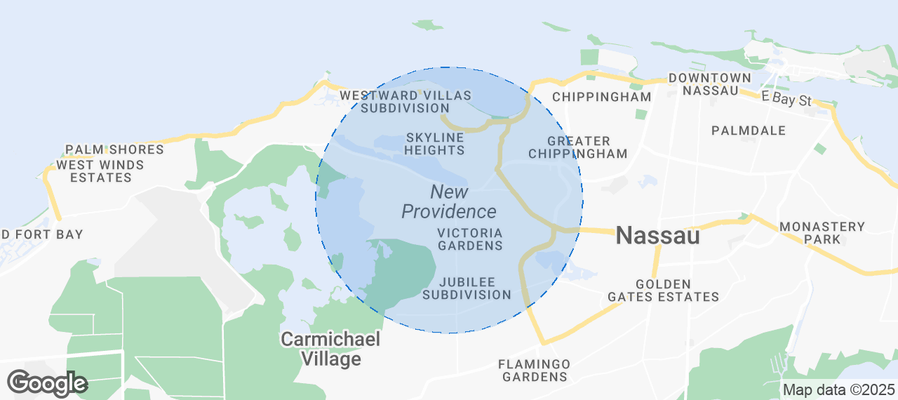
Is Airbnb profitable in New Providence in 2025? Explore comprehensive Airbnb analytics for New Providence, New Providence, Bahamas to uncover income potential. This 2025 STR market report for New Providence, based on AirROI data from August 2024 to July 2025, reveals key trends in the bustling market of 1,507 active listings.
Whether you're considering an Airbnb investment in New Providence, optimizing your existing vacation rental, or exploring rental arbitrage opportunities, understanding the New Providence Airbnb data is crucial. Leveraging the low regulation environment is key to maximizing your short term rental income potential. Let's dive into the specifics.
Key New Providence Airbnb Performance Metrics Overview
Monthly Airbnb Revenue Variations & Income Potential in New Providence (2025)
Understanding the monthly revenue variations for Airbnb listings in New Providence is key to maximizing your short term rental income potential. Seasonality significantly impacts earnings. Our analysis, based on data from the past 12 months, shows that the peak revenue month for STRs in New Providence is typically March, while September often presents the lowest earnings, highlighting opportunities for strategic pricing adjustments during shoulder and low seasons. Explore the typical Airbnb income in New Providence across different performance tiers:
- Best-in-class properties (Top 10%) achieve $9,283+ monthly, often utilizing dynamic pricing and superior guest experiences.
- Strong performing properties (Top 25%) earn $4,666 or more, indicating effective management and desirable locations/amenities.
- Typical properties (Median) generate around $2,141 per month, representing the average market performance.
- Entry-level properties (Bottom 25%) see earnings around $965, often with potential for optimization.
Average Monthly Airbnb Earnings Trend in New Providence
New Providence Airbnb Occupancy Rate Trends (2025)
Maximize your bookings by understanding the New Providence STR occupancy trends. Seasonal demand shifts significantly influence how often properties are booked. Typically, Marchsees the highest demand (peak season occupancy), while October experiences the lowest (low season). Effective strategies, like adjusting minimum stays or offering promotions, can boost occupancy during slower periods. Here's how different property tiers perform in New Providence:
- Best-in-class properties (Top 10%) achieve 79%+ occupancy, indicating high desirability and potentially optimized availability.
- Strong performing properties (Top 25%) maintain 62% or higher occupancy, suggesting good market fit and guest satisfaction.
- Typical properties (Median) have an occupancy rate around 38%.
- Entry-level properties (Bottom 25%) average 19% occupancy, potentially facing higher vacancy.
Average Monthly Occupancy Rate Trend in New Providence
Average Daily Rate (ADR) Airbnb Trends in New Providence (2025)
Effective short term rental pricing strategy in New Providence involves understanding monthly ADR fluctuations. The Average Daily Rate (ADR) for Airbnb in New Providence typically peaks in June and dips lowest during September. Leveraging Airbnb dynamic pricing tools or strategies based on this seasonality can significantly boost revenue. Here's a look at the typical nightly rates achieved:
- Best-in-class properties (Top 10%) command rates of $677+ per night, often due to premium features or locations.
- Strong performing properties (Top 25%) achieve nightly rates of $355 or more.
- Typical properties (Median) charge around $180 per night.
- Entry-level properties (Bottom 25%) earn around $112 per night.
Average Daily Rate (ADR) Trend by Month in New Providence
Get Live New Providence Market Intelligence 👇
Explore Real-time Analytics
Airbnb Seasonality Analysis & Trends in New Providence (2025)
Peak Season (March, December, April)
- Revenue averages $5,048 per month
- Occupancy rates average 48.3%
- Daily rates average $321
Shoulder Season
- Revenue averages $3,944 per month
- Occupancy maintains around 40.8%
- Daily rates hold near $314
Low Season (September, October, November)
- Revenue drops to average $2,807 per month
- Occupancy decreases to average 35.0%
- Daily rates adjust to average $298
Seasonality Insights for New Providence
- The Airbnb seasonality in New Providence shows highly seasonal trends requiring careful strategy. While the sections above show seasonal averages, it's also insightful to look at the extremes:
- During the high season, the absolute peak month showcases New Providence's highest earning potential, with monthly revenues capable of climbing to $5,642, occupancy reaching a high of 52.5%, and ADRs peaking at $328.
- Conversely, the slowest single month of the year, typically falling within the low season, marks the market's lowest point. In this month, revenue might dip to $2,452, occupancy could drop to 34.2%, and ADRs may adjust down to $296.
- Understanding both the seasonal averages and these monthly peaks and troughs in revenue, occupancy, and ADR is crucial for maximizing your Airbnb profit potential in New Providence.
Seasonal Strategies for Maximizing Profit
- Peak Season: Maximize revenue through premium pricing and potentially longer minimum stays. Ensure high availability.
- Low Season: Offer competitive pricing, special promotions (e.g., extended stay discounts), and flexible cancellation policies. Target off-season travelers like remote workers or budget-conscious guests.
- Shoulder Seasons: Implement dynamic pricing that balances peak and low rates. Target weekend travelers or specific events. Offer slightly more flexible terms than peak season.
- Regularly analyze your own performance against these New Providence seasonality benchmarks and adjust your pricing and availability strategy accordingly.
Best Areas for Airbnb Investment in New Providence (2025)
Exploring the top neighborhoods for short-term rentals in New Providence? This section highlights key areas, outlining why they are attractive for hosts and guests, along with notable local attractions. Consider these locations based on your target guest profile and investment strategy.
| Neighborhood / Area | Why Host Here? (Target Guests & Appeal) | Key Attractions & Landmarks |
|---|---|---|
| Cable Beach | Famous for its stunning beaches and luxurious resorts, Cable Beach is a top destination for tourists in Nassau. It offers beautiful turquoise waters and a variety of beach activities, making it appealing for short-term rental guests. | Cable Beach, Baha Mar Resort, Sandals Royal Bahamian, The Royal Blue Golf Club, Local restaurants and bars |
| Downtown Nassau | The vibrant heart of Nassau, offering rich history, culture, and a bustling marketplace. It's a popular area for tourists wanting to experience local life and easy access to attractions. | The Queen's Staircase, Pirates Museum, Nassau Straw Market, National Art Gallery of The Bahamas, Fort Charlotte |
| Paradise Island | Home to world-famous resorts and the Atlantis resort complex. This island attracts families and luxury travelers looking for upscale experiences and activities. | Atlantis Paradise Island, Aquaventure Water Park, Marine Habitat, Cabbage Beach |
| Lyford Cay | An exclusive community known for its luxury homes and private beaches, appealing to high-end travelers looking for privacy and seclusion. | Lyford Cay Club, Private beaches, Luxurious dining options |
| Arawak Cay | A popular destination for local cuisine and seafood, Arawak Cay attracts foodies and tourists wanting to experience authentic Bahamian flavors. | Fish Fry at Arawak Cay, Local eateries, Cultural festivals |
| Clifton Heritage Park | A beautiful natural reserve and historical site, attracting nature lovers and those interested in the history of the Bahamas. | Clifton Heritage Park, Historical ruins, Beaches, Nature trails |
| Junkanoo Beach | Close to the action of downtown Nassau, this beach is popular for its lively atmosphere and close proximity to nightlife and local entertainment. | Junkanoo Beach, Water sports rentals, Local bars and music |
| Waterside Village | An upcoming area with waterfront properties, attracting visitors interested in a relaxing atmosphere by the sea and proximity to local attractions. | Shopping and dining options, Scenic waterfront views, Local art galleries |
Understanding Airbnb License Requirements & STR Laws in New Providence (2025)
While New Providence, New Providence, Bahamas currently shows low STR regulations, specific Airbnb license requirements might still exist or change. Always verify the latest short term rental regulations and Airbnb license requirements directly with local government authorities for New Providence to ensure full compliance before hosting.
(Source: AirROI data, 2025, based on 0% licensed listings)
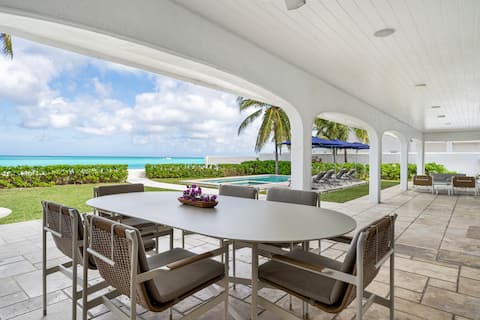
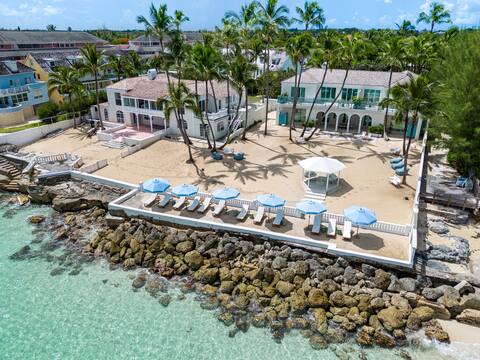
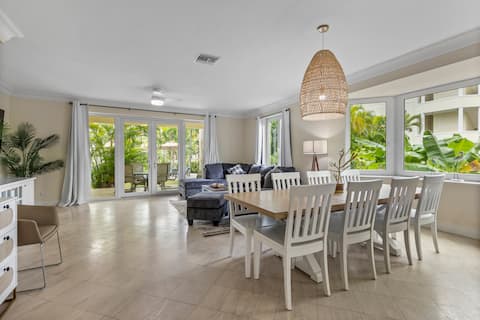
Top Performing Airbnb Properties in New Providence (2025)
Benchmark your potential! Explore examples of top-performing Airbnb properties in New Providencebased on Trailing Twelve Month (TTM) revenue. Analyze their characteristics, revenue, occupancy rate, and ADR to understand what drives success in this market.

Paradise Beach Villa, OCEANFRONT~Paradise Island~
Entire Place • 4 bedrooms
*Car Included* Villa Oasis- Beachfront Home + Pool
Entire Place • 4 bedrooms
10-Bedroom Emerald Wave Oceanfront Estate
Entire Place • 10 bedrooms

Villa Mar Y Sol, Nassau - Sea and Sun Vacation
Entire Place • 7 bedrooms
Sleeps 40+/24 Bedrooms/Atlantis
Entire Place • 24 bedrooms

Blue Birds Beach House Villa with Heated Pool
Entire Place • 5 bedrooms
Note: Performance varies based on location, size, amenities, seasonality, and management quality. Data reflects the past 12 months.
Top Performing Airbnb Hosts in New Providence (2025)
Learn from the best! This table showcases top-performing Airbnb hosts in New Providence based on the number of properties managed and estimated total revenue over the past year. Analyze their scale and performance metrics.
| Host Name | Properties | Grossing Revenue | Stay Reviews | Avg Rating |
|---|---|---|---|---|
| Brianne | 24 | $2,308,278 | 568 | 4.90/5.0 |
| Scott | 29 | $1,945,255 | 2394 | 4.84/5.0 |
| Kristina | 12 | $1,089,598 | 506 | 4.90/5.0 |
| Nicole | 3 | $875,562 | 13 | 5.00/5.0 |
| Angela | 9 | $837,517 | 429 | 4.91/5.0 |
| Michelle | 9 | $819,250 | 174 | 4.94/5.0 |
| Madison | 8 | $704,111 | 338 | 4.88/5.0 |
| Jaqueline | 13 | $694,450 | 213 | 4.09/5.0 |
| Hermann Josef | 11 | $663,703 | 125 | 4.10/5.0 |
| Valencia | 8 | $633,553 | 147 | 4.70/5.0 |
Analyzing the strategies of top hosts, such as their property selection, pricing, and guest communication, can offer valuable lessons for optimizing your own Airbnb operations in New Providence.
Dive Deeper: Advanced New Providence STR Market Data (2025)
Ready to unlock more insights? AirROI provides access to advanced metrics and comprehensive Airbnb data for New Providence. Explore detailed analytics beyond this report to refine your investment strategy, optimize pricing, and maximize your vacation rental profits.
Explore Advanced MetricsNew Providence Short-Term Rental Market Composition (2025): Property & Room Types
Room Type Distribution
Property Type Distribution
Market Composition Insights for New Providence
- The New Providence Airbnb market composition is heavily skewed towards Entire Home/Apt listings, which make up 94% of the 1,507 active rentals. This indicates strong guest preference for privacy and space.
- Looking at the property type distribution in New Providence, Apartment/Condo properties are the most common (60.5%), reflecting the local real estate landscape.
- Houses represent a significant 26.8% portion, catering likely to families or larger groups.
- The presence of 5.2% Hotel/Boutique listings indicates integration with traditional hospitality.
- Smaller segments like outdoor/unique, unique stays (combined 1.0%) offer potential for unique stay experiences.
New Providence Airbnb Room Capacity Analysis (2025): Bedroom Distribution
Distribution of Listings by Number of Bedrooms
Room Capacity Insights for New Providence
- The dominant room capacity in New Providence is 1 bedroom listings, making up 44.9% of the market. This suggests a strong demand for properties suitable for couples or solo travelers.
- Together, 1 bedroom and 2 bedrooms properties represent 72.4% of the active Airbnb listings in New Providence, indicating a high concentration in these sizes.
- A significant 22.0% of listings offer 3+ bedrooms, catering to larger groups and families seeking more space in New Providence.
New Providence Vacation Rental Guest Capacity Trends (2025)
Distribution of Listings by Guest Capacity
Guest Capacity Insights for New Providence
- The most common guest capacity trend in New Providence vacation rentals is listings accommodating 2 guests (30.7%). This suggests the primary traveler segment is likely couples or solo travelers.
- Properties designed for 2 guests and 4 guests dominate the New Providence STR market, accounting for 53.5% of listings.
- 31.3% of properties accommodate 6+ guests, serving the market segment for larger families or group travel in New Providence.
- On average, properties in New Providence are equipped to host 4.1 guests.
New Providence Airbnb Booking Patterns (2025): Available vs. Booked Days
Available Days Distribution
Booked Days Distribution
Booking Pattern Insights for New Providence
- The most common availability pattern in New Providence falls within the 271-366 days range, representing 53.9% of listings. This suggests many properties have significant open periods on their calendars.
- Approximately 80.8% of listings show high availability (181+ days open annually), indicating potential for increased bookings or specific owner usage patterns.
- For booked days, the 31-90 days range is most frequent in New Providence (30.7%), reflecting common guest stay durations or potential owner blocking patterns.
- A notable 20.2% of properties secure long booking periods (181+ days booked per year), highlighting successful long-term rental strategies or significant owner usage.
New Providence Airbnb Minimum Stay Requirements Analysis
Distribution of Listings by Minimum Night Requirement
1 Night
369 listings
24.8% of total
2 Nights
391 listings
26.3% of total
3 Nights
279 listings
18.8% of total
4-6 Nights
114 listings
7.7% of total
7-29 Nights
26 listings
1.7% of total
30+ Nights
307 listings
20.7% of total
Key Insights
- The most prevalent minimum stay requirement in New Providence is 2 Nights, adopted by 26.3% of listings. This highlights the market's preference for shorter, flexible bookings.
- A significant segment (20.7%) caters to monthly stays (30+ nights) in New Providence, pointing to opportunities in the extended-stay market.
Recommendations
- Align with the market by considering a 2 Nights minimum stay, as 26.3% of New Providence hosts use this setting.
- If feasible, allowing 1-night stays, especially midweek or during low season, could capture last-minute bookings, as only 24.8% currently do.
- Explore offering discounts for stays of 30+ nights to attract the 20.7% of the market seeking extended stays.
- Adjust minimum nights based on seasonality – potentially shorter during low season and longer during peak demand periods in New Providence.
New Providence Airbnb Cancellation Policy Trends Analysis (2025)
Super Strict 30 Days
15 listings
1% of total
Super Strict 60 Days
26 listings
1.8% of total
Flexible
355 listings
24% of total
Moderate
361 listings
24.4% of total
Firm
294 listings
19.9% of total
Strict
426 listings
28.8% of total
Cancellation Policy Insights for New Providence
- The prevailing Airbnb cancellation policy trend in New Providence is Strict, used by 28.8% of listings.
- There's a relatively balanced mix between guest-friendly (48.4%) and stricter (48.7%) policies, offering choices for different guest needs.
Recommendations for Hosts
- Consider adopting a Strict policy to align with the 28.8% market standard in New Providence.
- Regularly review your cancellation policy against competitors and market demand shifts in New Providence.
New Providence STR Booking Lead Time Analysis (2025)
Average Booking Lead Time by Month
Booking Lead Time Insights for New Providence
- The overall average booking lead time for vacation rentals in New Providence is 35 days.
- Guests book furthest in advance for stays during December (average 54 days), likely coinciding with peak travel demand or local events.
- The shortest booking windows occur for stays in September (average 20 days), indicating more last-minute travel plans during this time.
- Seasonally, Winter (44 days avg.) sees the longest lead times, while Fall (31 days avg.) has the shortest, reflecting typical travel planning cycles.
Recommendations for Hosts
- Use the overall average lead time (35 days) as a baseline for your pricing and availability strategy in New Providence.
- For December stays, consider implementing length-of-stay discounts or slightly higher rates for bookings made less than 54 days out to capitalize on advance planning.
- Target marketing efforts for the Winter season well in advance (at least 44 days) to capture early planners.
- Monitor your own booking lead times against these New Providence averages to identify opportunities for dynamic pricing adjustments.
Popular & Essential Airbnb Amenities in New Providence (2025)
Amenity Prevalence
Amenity Insights for New Providence
- Essential amenities in New Providence that guests expect include: Wifi, Air conditioning, TV. Lacking these (any) could significantly impact bookings.
- Popular amenities like Free parking on premises, Kitchen, Hot water are common but not universal. Offering these can provide a competitive edge.
Recommendations for Hosts
- Ensure your listing includes all essential amenities for New Providence: Wifi, Air conditioning, TV.
- Prioritize adding missing essentials: Wifi, Air conditioning, TV.
- Consider adding popular differentiators like Free parking on premises or Kitchen to increase appeal.
- Highlight unique or less common amenities you offer (e.g., hot tub, dedicated workspace, EV charger) in your listing description and photos.
- Regularly check competitor amenities in New Providence to stay competitive.
New Providence Airbnb Guest Demographics & Profile Analysis (2025)
Guest Profile Summary for New Providence
- The typical guest profile for Airbnb in New Providence consists of predominantly international visitors (76%), with top international origins including Bahamas, typically belonging to the Post-2000s (Gen Z/Alpha) group (50%), primarily speaking English or Spanish.
- Domestic travelers account for 24.1% of guests.
- Key international markets include United States (50.8%) and Bahamas (24.1%).
- Top languages spoken are English (66%) followed by Spanish (12.2%).
- A significant demographic segment is the Post-2000s (Gen Z/Alpha) group, representing 50% of guests.
Recommendations for Hosts
- Focus marketing internationally, particularly towards travelers from Bahamas.
- Tailor amenities and listing descriptions to appeal to the dominant Post-2000s (Gen Z/Alpha) demographic (e.g., highlight fast WiFi, smart home features, local guides).
- Highlight unique local experiences or amenities relevant to the primary guest profile.
- Consider seasonal promotions aligned with peak travel times for key origin markets.
Nearby Short-Term Rental Market Comparison
How does the New Providence Airbnb market stack up against its neighbors? Compare key performance metrics like average monthly revenue, ADR, and occupancy rates in surrounding areas to understand the broader regional STR landscape.
| Market | Active Properties | Monthly Revenue | Daily Rate | Avg. Occupancy |
|---|---|---|---|---|
| Harbour Island | 83 | $9,022 | $1175.08 | 38% |
| Hope Town | 79 | $4,828 | $728.61 | 31% |
| North Eleuthera | 33 | $4,224 | $420.35 | 45% |
| Central Eleuthera | 336 | $3,668 | $466.22 | 38% |
| West Grand Bahama | 21 | $3,648 | $628.37 | 28% |
| South Abaco | 25 | $3,350 | $363.34 | 44% |
| Spanish Wells | 84 | $3,124 | $338.29 | 40% |
| Green Turtle Cay | 49 | $3,091 | $488.37 | 34% |
| Central Abaco | 67 | $2,795 | $379.18 | 32% |
| North Abaco | 126 | $2,653 | $418.71 | 34% |