Hastings Airbnb Market Analysis 2025: Short Term Rental Data & Vacation Rental Statistics in Christ Church, Barbados
Is Airbnb profitable in Hastings in 2025? Explore comprehensive Airbnb analytics for Hastings, Christ Church, Barbados to uncover income potential. This 2025 STR market report for Hastings, based on AirROI data from November 2024 to October 2025, reveals key trends in the niche market of 17 active listings.
Whether you're considering an Airbnb investment in Hastings, optimizing your existing vacation rental, or exploring rental arbitrage opportunities, understanding the Hastings Airbnb data is crucial. Leveraging the low regulation environment is key to maximizing your short term rental income potential. Let's dive into the specifics.
Key Hastings Airbnb Performance Metrics Overview
Monthly Airbnb Revenue Variations & Income Potential in Hastings (2025)
Understanding the monthly revenue variations for Airbnb listings in Hastings is key to maximizing your short term rental income potential. Seasonality significantly impacts earnings. Our analysis, based on data from the past 12 months, shows that the peak revenue month for STRs in Hastings is typically January, while October often presents the lowest earnings, highlighting opportunities for strategic pricing adjustments during shoulder and low seasons. Explore the typical Airbnb income in Hastings across different performance tiers:
- Best-in-class properties (Top 10%) achieve $6,760+ monthly, often utilizing dynamic pricing and superior guest experiences.
- Strong performing properties (Top 25%) earn $4,792 or more, indicating effective management and desirable locations/amenities.
- Typical properties (Median) generate around $2,760 per month, representing the average market performance.
- Entry-level properties (Bottom 25%) see earnings around $1,419, often with potential for optimization.
Average Monthly Airbnb Earnings Trend in Hastings
Hastings Airbnb Occupancy Rate Trends (2025)
Maximize your bookings by understanding the Hastings STR occupancy trends. Seasonal demand shifts significantly influence how often properties are booked. Typically, Januarysees the highest demand (peak season occupancy), while October experiences the lowest (low season). Effective strategies, like adjusting minimum stays or offering promotions, can boost occupancy during slower periods. Here's how different property tiers perform in Hastings:
- Best-in-class properties (Top 10%) achieve 86%+ occupancy, indicating high desirability and potentially optimized availability.
- Strong performing properties (Top 25%) maintain 77% or higher occupancy, suggesting good market fit and guest satisfaction.
- Typical properties (Median) have an occupancy rate around 57%.
- Entry-level properties (Bottom 25%) average 33% occupancy, potentially facing higher vacancy.
Average Monthly Occupancy Rate Trend in Hastings
Average Daily Rate (ADR) Airbnb Trends in Hastings (2025)
Effective short term rental pricing strategy in Hastings involves understanding monthly ADR fluctuations. The Average Daily Rate (ADR) for Airbnb in Hastings typically peaks in January and dips lowest during September. Leveraging Airbnb dynamic pricing tools or strategies based on this seasonality can significantly boost revenue. Here's a look at the typical nightly rates achieved:
- Best-in-class properties (Top 10%) command rates of $312+ per night, often due to premium features or locations.
- Strong performing properties (Top 25%) achieve nightly rates of $221 or more.
- Typical properties (Median) charge around $162 per night.
- Entry-level properties (Bottom 25%) earn around $82 per night.
Average Daily Rate (ADR) Trend by Month in Hastings
Get Live Hastings Market Intelligence 👇

Explore Real-time Analytics
Airbnb Seasonality Analysis & Trends in Hastings (2025)
Peak Season (January, March, December)
- Revenue averages $4,757 per month
- Occupancy rates average 74.9%
- Daily rates average $178
Shoulder Season
- Revenue averages $3,399 per month
- Occupancy maintains around 56.7%
- Daily rates hold near $169
Low Season (August, September, October)
- Revenue drops to average $1,912 per month
- Occupancy decreases to average 36.0%
- Daily rates adjust to average $160
Seasonality Insights for Hastings
- The Airbnb seasonality in Hastings shows highly seasonal trends requiring careful strategy. While the sections above show seasonal averages, it's also insightful to look at the extremes:
- During the high season, the absolute peak month showcases Hastings's highest earning potential, with monthly revenues capable of climbing to $5,596, occupancy reaching a high of 86.4%, and ADRs peaking at $179.
- Conversely, the slowest single month of the year, typically falling within the low season, marks the market's lowest point. In this month, revenue might dip to $1,541, occupancy could drop to 26.4%, and ADRs may adjust down to $158.
- Understanding both the seasonal averages and these monthly peaks and troughs in revenue, occupancy, and ADR is crucial for maximizing your Airbnb profit potential in Hastings.
Seasonal Strategies for Maximizing Profit
- Peak Season: Maximize revenue through premium pricing and potentially longer minimum stays. Ensure high availability.
- Low Season: Offer competitive pricing, special promotions (e.g., extended stay discounts), and flexible cancellation policies. Target off-season travelers like remote workers or budget-conscious guests.
- Shoulder Seasons: Implement dynamic pricing that balances peak and low rates. Target weekend travelers or specific events. Offer slightly more flexible terms than peak season.
- Regularly analyze your own performance against these Hastings seasonality benchmarks and adjust your pricing and availability strategy accordingly.
Best Areas for Airbnb Investment in Hastings (2025)
Exploring the top neighborhoods for short-term rentals in Hastings? This section highlights key areas, outlining why they are attractive for hosts and guests, along with notable local attractions. Consider these locations based on your target guest profile and investment strategy.
| Neighborhood / Area | Why Host Here? (Target Guests & Appeal) | Key Attractions & Landmarks |
|---|---|---|
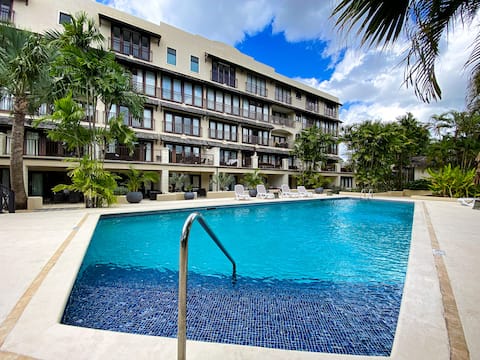
| Hastings | A vibrant coastal area known for its beautiful beaches, lively atmosphere, and proximity to local attractions. Ideal for tourists looking for both relaxation and recreation. | Hastings Beach, South Coast Boardwalk, George Washington House, oceanfront dining and nightlife, local shops and markets |
| Worthing | A popular area with a mix of local charm and tourist amenities. Perfect for visitors seeking a more laid-back beach experience with easy access to restaurants and shops. | Worthing Beach, Worthing Square, Bluefin Restaurant, local bars and cafés, Snorkeling opportunities |
| Dover | Famous for its stunning beaches and vibrant nightlife. A hotspot for tourists looking to enjoy watersports, dining, and entertainment. | Dover Beach, St. Lawrence Gap, local clubs and bars, watersports activities, restaurants with Caribbean cuisine |
| Oistins | Known for its weekly fish fry and lively atmosphere. A cultural hub where visitors can enjoy local food and entertainment. | Oistins Fish Fry, Miami Beach, local market experiences, art and craft shops, live music events |
| Pine Gardens | A quieter residential area with easy access to beaches and local attractions. Great for families and those seeking a more relaxed stay. | beach access at nearby locations, local parks, shopping centers, community events, family-friendly activities |
| Christ Church Parish | A larger area featuring diverse locales from busy beaches to quiet residential spots. Offers something for every type of traveler. | Crane Beach, Bottom Bay, local historical sites, marketplaces, ecotourism experiences |
| Silver Sands | Renowned for its beautiful, uncrowded beaches and popular among windsurfers. Attractive to those seeking a beach-focused vacation. | Silver Sands Beach, water sports activities, local surf shops, beachfront accommodations, peaceful surroundings |
| Rockley | A well-established area with a mix of locals and tourists. Known for its golf courses, and watersports, attracting both relaxation and sporting enthusiasts. | Rockley Beach, golf courses, shopping and dining areas, turtle watching, natural beauty |
Understanding Airbnb License Requirements & STR Laws in Hastings (2025)
While Hastings, Christ Church, Barbados currently shows low STR regulations, specific Airbnb license requirements might still exist or change. Always verify the latest short term rental regulations and Airbnb license requirements directly with local government authorities for Hastings to ensure full compliance before hosting.
(Source: AirROI data, 2025, finding no licensed listings among those analyzed)
Top Performing Airbnb Properties in Hastings (2025)
Benchmark your potential! Explore examples of top-performing Airbnb properties in Hastingsbased on Trailing Twelve Month (TTM) revenue. Analyze their characteristics, revenue, occupancy rate, and ADR to understand what drives success in this market.

#3 Maple Gardens - Oasis of Tranquility
Entire Place • 2 bedrooms

Modern 2 Bed/2 Bath Condo - with pool and gym
Entire Place • 2 bedrooms
1 bedroom+patio in a luxury gated condo with pool
Entire Place • 1 bedroom
Stylish 1 bedroom gated condo with pool
Entire Place • 1 bedroom
Charleston Beachfront 1 Bedroom Apartment
Entire Place • 1 bedroom

Modern breezy apartment, 1 minute from the beach!
Entire Place • 2 bedrooms
Note: Performance varies based on location, size, amenities, seasonality, and management quality. Data reflects the past 12 months.
Top Performing Airbnb Hosts in Hastings (2025)
Learn from the best! This table showcases top-performing Airbnb hosts in Hastings based on the number of properties managed and estimated total revenue over the past year. Analyze their scale and performance metrics.
| Host Name | Properties | Grossing Revenue | Stay Reviews | Avg Rating |
|---|---|---|---|---|
| Alexander | 2 | $100,753 | 168 | 4.92/5.0 |
| Camille | 1 | $77,537 | 92 | 4.93/5.0 |
| Heather | 7 | $66,485 | 221 | 4.90/5.0 |
| SRI Holidays Inc. | 1 | $65,473 | 22 | 4.91/5.0 |
| Shona | 1 | $40,229 | 27 | 4.81/5.0 |
| Ruairidh | 1 | $32,292 | 22 | 4.73/5.0 |
| Ray | 1 | $19,695 | 26 | 4.92/5.0 |
| Wendy L | 1 | $12,928 | 68 | 4.88/5.0 |
| Ava | 1 | $10,640 | 31 | 4.87/5.0 |
| Vinita | 1 | $5,124 | 98 | 4.30/5.0 |
Analyzing the strategies of top hosts, such as their property selection, pricing, and guest communication, can offer valuable lessons for optimizing your own Airbnb operations in Hastings.
Dive Deeper: Advanced Hastings STR Market Data (2025)
Ready to unlock more insights? AirROI provides access to advanced metrics and comprehensive Airbnb data for Hastings. Explore detailed analytics beyond this report to refine your investment strategy, optimize pricing, and maximize your vacation rental profits.
Explore Advanced MetricsHastings Short-Term Rental Market Composition (2025): Property & Room Types
Room Type Distribution
Property Type Distribution
Market Composition Insights for Hastings
- The Hastings Airbnb market composition is heavily skewed towards Entire Home/Apt listings, which make up 76.5% of the 17 active rentals. This indicates strong guest preference for privacy and space.
- Looking at the property type distribution in Hastings, Apartment/Condo properties are the most common (82.4%), reflecting the local real estate landscape.
- Houses represent a significant 17.6% portion, catering likely to families or larger groups.
Hastings Airbnb Room Capacity Analysis (2025): Bedroom Distribution
Distribution of Listings by Number of Bedrooms
Room Capacity Insights for Hastings
- The dominant room capacity in Hastings is 2 bedrooms listings, making up 41.2% of the market. This suggests a strong demand for properties suitable for couples or solo travelers.
- Together, 2 bedrooms and 1 bedroom properties represent 76.5% of the active Airbnb listings in Hastings, indicating a high concentration in these sizes.
Hastings Vacation Rental Guest Capacity Trends (2025)
Distribution of Listings by Guest Capacity
Guest Capacity Insights for Hastings
- The most common guest capacity trend in Hastings vacation rentals is listings accommodating 4 guests (47.1%). This suggests the primary traveler segment is likely small families or groups.
- Properties designed for 4 guests and 2 guests dominate the Hastings STR market, accounting for 76.5% of listings.
- On average, properties in Hastings are equipped to host 2.5 guests.
Hastings Airbnb Booking Patterns (2025): Available vs. Booked Days
Available Days Distribution
Booked Days Distribution
Booking Pattern Insights for Hastings
- The most common availability pattern in Hastings falls within the 271-366 days range, representing 35.3% of listings. This suggests many properties have significant open periods on their calendars.
- Approximately 70.6% of listings show high availability (181+ days open annually), indicating potential for increased bookings or specific owner usage patterns.
- For booked days, the 91-180 days range is most frequent in Hastings (41.2%), reflecting common guest stay durations or potential owner blocking patterns.
- A notable 29.4% of properties secure long booking periods (181+ days booked per year), highlighting successful long-term rental strategies or significant owner usage.
Hastings Airbnb Minimum Stay Requirements Analysis
Distribution of Listings by Minimum Night Requirement
1 Night
1 listings
5.9% of total
2 Nights
5 listings
29.4% of total
3 Nights
1 listings
5.9% of total
4-6 Nights
6 listings
35.3% of total
7-29 Nights
1 listings
5.9% of total
30+ Nights
3 listings
17.6% of total
Key Insights
- The most prevalent minimum stay requirement in Hastings is 4-6 Nights, adopted by 35.3% of listings. This highlights the market's preference for longer commitments.
- A significant segment (17.6%) caters to monthly stays (30+ nights) in Hastings, pointing to opportunities in the extended-stay market.
Recommendations
- Align with the market by considering a 4-6 Nights minimum stay, as 35.3% of Hastings hosts use this setting.
- If feasible, allowing 1-night stays, especially midweek or during low season, could capture last-minute bookings, as only 5.9% currently do.
- Explore offering discounts for stays of 30+ nights to attract the 17.6% of the market seeking extended stays.
- Adjust minimum nights based on seasonality – potentially shorter during low season and longer during peak demand periods in Hastings.
Hastings Airbnb Cancellation Policy Trends Analysis (2025)
Moderate
3 listings
17.6% of total
Firm
1 listings
5.9% of total
Strict
13 listings
76.5% of total
Cancellation Policy Insights for Hastings
- The prevailing Airbnb cancellation policy trend in Hastings is Strict, used by 76.5% of listings.
- A majority (82.4%) of hosts in Hastings utilize Firm or Strict policies, indicating a market where hosts prioritize booking security.
Recommendations for Hosts
- Consider adopting a Strict policy to align with the 76.5% market standard in Hastings.
- With 76.5% using Strict terms, this is a viable option in Hastings, particularly for high-value properties or during peak demand periods.
- Regularly review your cancellation policy against competitors and market demand shifts in Hastings.
Hastings STR Booking Lead Time Analysis (2025)
Average Booking Lead Time by Month
Booking Lead Time Insights for Hastings
- The overall average booking lead time for vacation rentals in Hastings is 100 days.
- Guests book furthest in advance for stays during January (average 182 days), likely coinciding with peak travel demand or local events.
- The shortest booking windows occur for stays in June (average 35 days), indicating more last-minute travel plans during this time.
- Seasonally, Winter (119 days avg.) sees the longest lead times, while Summer (54 days avg.) has the shortest, reflecting typical travel planning cycles.
Recommendations for Hosts
- Use the overall average lead time (100 days) as a baseline for your pricing and availability strategy in Hastings.
- For January stays, consider implementing length-of-stay discounts or slightly higher rates for bookings made less than 182 days out to capitalize on advance planning.
- Target marketing efforts for the Winter season well in advance (at least 119 days) to capture early planners.
- Monitor your own booking lead times against these Hastings averages to identify opportunities for dynamic pricing adjustments.
Popular & Essential Airbnb Amenities in Hastings (2025)
Amenity Prevalence
Amenity Insights for Hastings
- Essential amenities in Hastings that guests expect include: Wifi, Air conditioning, Kitchen, Essentials, TV. Lacking these (any) could significantly impact bookings.
- Popular amenities like Dryer, Dishes and silverware, Hot water are common but not universal. Offering these can provide a competitive edge.
Recommendations for Hosts
- Ensure your listing includes all essential amenities for Hastings: Wifi, Air conditioning, Kitchen, Essentials, TV.
- Consider adding popular differentiators like Dryer or Dishes and silverware to increase appeal.
- Highlight unique or less common amenities you offer (e.g., hot tub, dedicated workspace, EV charger) in your listing description and photos.
- Regularly check competitor amenities in Hastings to stay competitive.
Hastings Airbnb Guest Demographics & Profile Analysis (2025)
Guest Profile Summary for Hastings
- The typical guest profile for Airbnb in Hastings consists of predominantly international visitors (100%), with top international origins including United States, typically belonging to the Post-2000s (Gen Z/Alpha) group (50%), primarily speaking English or Spanish.
- Domestic travelers account for 0.0% of guests.
- Key international markets include United Kingdom (40.4%) and United States (23.1%).
- Top languages spoken are English (54.5%) followed by Spanish (18.2%).
- A significant demographic segment is the Post-2000s (Gen Z/Alpha) group, representing 50% of guests.
Recommendations for Hosts
- Focus marketing internationally, particularly towards travelers from United States.
- Tailor amenities and listing descriptions to appeal to the dominant Post-2000s (Gen Z/Alpha) demographic (e.g., highlight fast WiFi, smart home features, local guides).
- Highlight unique local experiences or amenities relevant to the primary guest profile.
- Consider seasonal promotions aligned with peak travel times for key origin markets.
Nearby Short-Term Rental Market Comparison
How does the Hastings Airbnb market stack up against its neighbors? Compare key performance metrics like average monthly revenue, ADR, and occupancy rates in surrounding areas to understand the broader regional STR landscape.
| Market | Active Properties | Monthly Revenue | Daily Rate | Avg. Occupancy |
|---|---|---|---|---|
| Belair | 33 | $5,272 | $516.78 | 39% |
| Gibbes | 17 | $5,141 | $504.66 | 45% |
| Clinketts | 13 | $5,084 | $434.66 | 49% |
| Rock Dundo | 22 | $5,038 | $582.24 | 45% |
| Prospect | 29 | $5,022 | $396.63 | 50% |
| Mount Standfast | 400 | $4,616 | $603.90 | 41% |
| Mullins | 44 | $4,394 | $444.21 | 50% |
| Cap Estate | 17 | $4,103 | $618.14 | 36% |
| Speightstown | 57 | $3,937 | $419.49 | 50% |
| Fitts Village | 70 | $3,779 | $339.74 | 50% |