Saint James Airbnb Market Analysis 2025: Short Term Rental Data & Vacation Rental Statistics in Saint James, Barbados
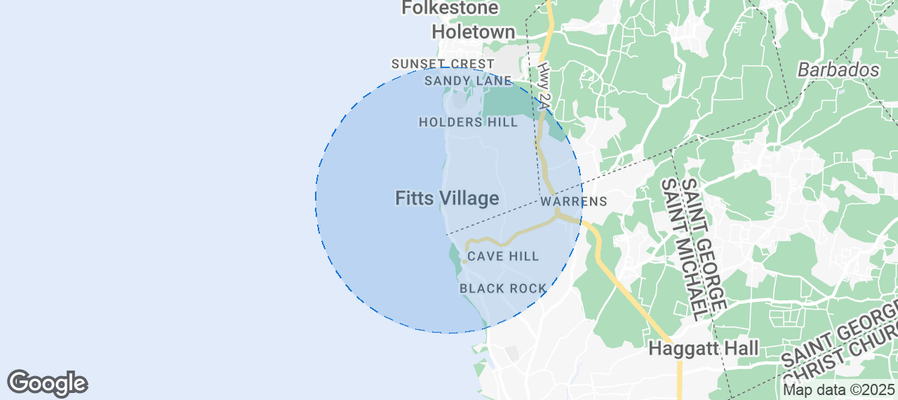
Is Airbnb profitable in Saint James in 2025? Explore comprehensive Airbnb analytics for Saint James, Saint James, Barbados to uncover income potential. This 2025 STR market report for Saint James, based on AirROI data from May 2024 to April 2025, reveals key trends in the niche market of 18 active listings.
Whether you're considering an Airbnb investment in Saint James, optimizing your existing vacation rental, or exploring rental arbitrage opportunities, understanding the Saint James Airbnb data is crucial. Leveraging the low regulation environment is key to maximizing your short term rental income potential. Let's dive into the specifics.
Key Saint James Airbnb Performance Metrics Overview
Monthly Airbnb Revenue Variations & Income Potential in Saint James (2025)
Understanding the monthly revenue variations for Airbnb listings in Saint James is key to maximizing your short term rental income potential. Seasonality significantly impacts earnings. Our analysis, based on data from the past 12 months, shows that the peak revenue month for STRs in Saint James is typically May, while December often presents the lowest earnings, highlighting opportunities for strategic pricing adjustments during shoulder and low seasons. Explore the typical Airbnb income in Saint James across different performance tiers:
- Best-in-class properties (Top 10%) achieve $44,000+ monthly, often utilizing dynamic pricing and superior guest experiences.
- Strong performing properties (Top 25%) earn $20,191 or more, indicating effective management and desirable locations/amenities.
- Typical properties (Median) generate around $5,146 per month, representing the average market performance.
- Entry-level properties (Bottom 25%) see earnings around $1,917, often with potential for optimization.
Average Monthly Airbnb Earnings Trend in Saint James
Saint James Airbnb Occupancy Rate Trends (2025)
Maximize your bookings by understanding the Saint James STR occupancy trends. Seasonal demand shifts significantly influence how often properties are booked. Typically, Februarysees the highest demand (peak season occupancy), while October experiences the lowest (low season). Effective strategies, like adjusting minimum stays or offering promotions, can boost occupancy during slower periods. Here's how different property tiers perform in Saint James:
- Best-in-class properties (Top 10%) achieve 80%+ occupancy, indicating high desirability and potentially optimized availability.
- Strong performing properties (Top 25%) maintain 55% or higher occupancy, suggesting good market fit and guest satisfaction.
- Typical properties (Median) have an occupancy rate around 33%.
- Entry-level properties (Bottom 25%) average 18% occupancy, potentially facing higher vacancy.
Average Monthly Occupancy Rate Trend in Saint James
Average Daily Rate (ADR) Airbnb Trends in Saint James (2025)
Effective short term rental pricing strategy in Saint James involves understanding monthly ADR fluctuations. The Average Daily Rate (ADR) for Airbnb in Saint James typically peaks in May and dips lowest during April. Leveraging Airbnb dynamic pricing tools or strategies based on this seasonality can significantly boost revenue. Here's a look at the typical nightly rates achieved:
- Best-in-class properties (Top 10%) command rates of $1,805+ per night, often due to premium features or locations.
- Strong performing properties (Top 25%) achieve nightly rates of $980 or more.
- Typical properties (Median) charge around $320 per night.
- Entry-level properties (Bottom 25%) earn around $101 per night.
Average Daily Rate (ADR) Trend by Month in Saint James
Get Live Saint James Market Intelligence 👇
Explore Real-time Analytics
Airbnb Seasonality Analysis & Trends in Saint James (2025)
Peak Season (May, October, August)
- Revenue averages $19,470 per month
- Occupancy rates average 29.4%
- Daily rates average $844
Shoulder Season
- Revenue averages $14,314 per month
- Occupancy maintains around 42.5%
- Daily rates hold near $748
Low Season (January, April, December)
- Revenue drops to average $6,715 per month
- Occupancy decreases to average 46.1%
- Daily rates adjust to average $530
Seasonality Insights for Saint James
- The Airbnb seasonality in Saint James shows highly seasonal trends requiring careful strategy. While the sections above show seasonal averages, it's also insightful to look at the extremes:
- During the high season, the absolute peak month showcases Saint James's highest earning potential, with monthly revenues capable of climbing to $20,229, occupancy reaching a high of 67.9%, and ADRs peaking at $870.
- Conversely, the slowest single month of the year, typically falling within the low season, marks the market's lowest point. In this month, revenue might dip to $5,644, occupancy could drop to 24.8%, and ADRs may adjust down to $467.
- Understanding both the seasonal averages and these monthly peaks and troughs in revenue, occupancy, and ADR is crucial for maximizing your Airbnb profit potential in Saint James.
Seasonal Strategies for Maximizing Profit
- Peak Season: Maximize revenue through premium pricing and potentially longer minimum stays. Ensure high availability.
- Low Season: Offer competitive pricing, special promotions (e.g., extended stay discounts), and flexible cancellation policies. Target off-season travelers like remote workers or budget-conscious guests.
- Shoulder Seasons: Implement dynamic pricing that balances peak and low rates. Target weekend travelers or specific events. Offer slightly more flexible terms than peak season.
- Regularly analyze your own performance against these Saint James seasonality benchmarks and adjust your pricing and availability strategy accordingly.
Best Areas for Airbnb Investment in Saint James (2025)
Exploring the top neighborhoods for short-term rentals in Saint James? This section highlights key areas, outlining why they are attractive for hosts and guests, along with notable local attractions. Consider these locations based on your target guest profile and investment strategy.
| Neighborhood / Area | Why Host Here? (Target Guests & Appeal) | Key Attractions & Landmarks |
|---|---|---|
| Holetown | A vibrant area with beautiful beaches, shopping, and dining. Known for its lively atmosphere, making it ideal for tourists looking for both relaxation and entertainment. | Limegrove Lifestyle Centre, The Beach House, Holetown Beach, Chattel Village, St. James Parish Church |
| Paynes Bay | A picturesque bay area that offers stunning beachfront views and luxury villas. Popular among visitors for water sports and fine dining. | Paynes Bay Beach, Dolphin Discovery, St. Lawrence Gap, Seafood restaurants |
| Folkestone Marine Park | A beautiful marine reserve that offers snorkeling and diving opportunities. Attracts nature lovers and aquatic enthusiasts. | Folkestone Marine Park and Museum, Underwater snorkeling, Scuba diving spots, Coral reefs |
| Speightstown | Rich in history and culture, Speightstown offers a tranquil atmosphere and beautiful beaches. A perfect spot for travelers looking to escape the tourist crowds. | The Arlington House Museum, Speightstown Beach, Tides Restaurant, St. Peter's Church |
| West Coast (Platinum Coast) | Known for its upscale resorts and pristine beaches, the Platinum Coast is a premier location for luxury travelers seeking relaxation and high-end amenities. | Paynes Bay, Mullins Beach, Sandy Lane Beach, Luxury resorts and spas |
| Sugar Hill | A gated community that offers luxury villas with beautiful ocean views. Attracts upscale tourists and those looking for a serene getaway. | Golf courses, Spa facilities, Infinity pools |
| Newcastle | A quieter, more residential area offering access to beautiful beaches and local culture. Ideal for those seeking authenticity in their travel experience. | Local markets, Beaches, Community events |
| Coconut Grove | A wonderful area filled with lush greenery and beautiful beaches, it is great for families and those looking to enjoy nature and relaxation. | Coconut Grove Beach, Nature trails, Family-friendly activities |
Understanding Airbnb License Requirements & STR Laws in Saint James (2025)
While Saint James, Saint James, Barbados currently shows low STR regulations, specific Airbnb license requirements might still exist or change. Always verify the latest short term rental regulations and Airbnb license requirements directly with local government authorities for Saint James to ensure full compliance before hosting.
(Source: AirROI data, 2025, finding no licensed listings among those analyzed)
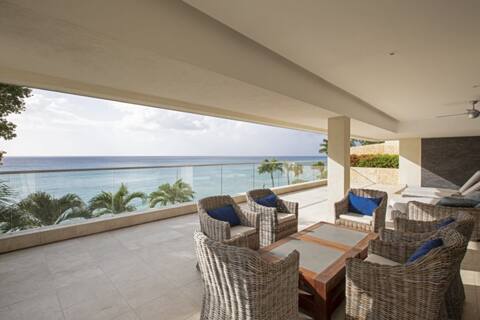
Top Performing Airbnb Properties in Saint James (2025)
Benchmark your potential! Explore examples of top-performing Airbnb properties in Saint Jamesbased on Trailing Twelve Month (TTM) revenue. Analyze their characteristics, revenue, occupancy rate, and ADR to understand what drives success in this market.
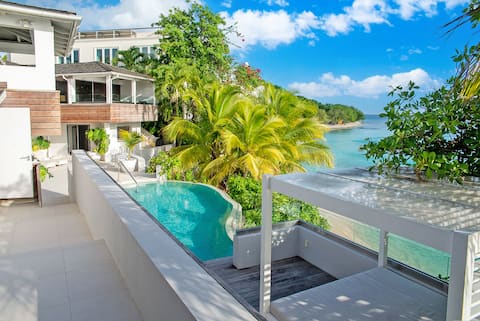
Portobello Villa Beachfront — Summer Deal
Entire Place • 5 bedrooms
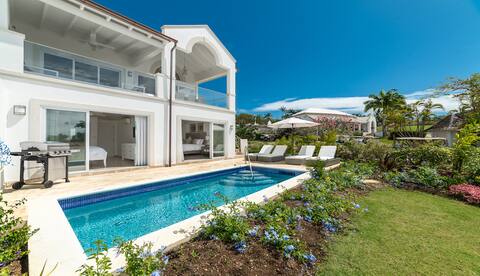
Four bedroom luxurious Mews Villa in a gated resid
Entire Place • 4 bedrooms
Portico 1
Entire Place • 3 bedrooms

Hullabaloo
Entire Place • 3 bedrooms
Ocean Views and Fully Furnished Two Bedroom
Entire Place • 2 bedrooms

LUXURY VILLA:5 mins walk to beach,4 bedrooms, pool
Entire Place • 4 bedrooms
Note: Performance varies based on location, size, amenities, seasonality, and management quality. Data reflects the past 12 months.
Top Performing Airbnb Hosts in Saint James (2025)
Learn from the best! This table showcases top-performing Airbnb hosts in Saint James based on the number of properties managed and estimated total revenue over the past year. Analyze their scale and performance metrics.
| Host Name | Properties | Grossing Revenue | Stay Reviews | Avg Rating |
|---|---|---|---|---|
| Host #543430909 | 1 | $302,444 | 0 | 0.00/5.0 |
| Host #44930752 | 2 | $128,850 | 0 | 0.00/5.0 |
| Host #498187767 | 1 | $74,212 | 0 | 0.00/5.0 |
| Marilil | 2 | $72,927 | 111 | 4.89/5.0 |
| Chesterton | 1 | $69,315 | 3 | 5.00/5.0 |
| Clive & Lily | 1 | $34,468 | 17 | 4.41/5.0 |
| Host #467011591 | 3 | $23,987 | 0 | 0.00/5.0 |
| Paulette | 1 | $18,956 | 6 | 5.00/5.0 |
| Nicole | 1 | $4,215 | 10 | 4.70/5.0 |
| Cherise | 1 | $3,972 | 38 | 4.39/5.0 |
Analyzing the strategies of top hosts, such as their property selection, pricing, and guest communication, can offer valuable lessons for optimizing your own Airbnb operations in Saint James.
Dive Deeper: Advanced Saint James STR Market Data (2025)
Ready to unlock more insights? AirROI provides access to advanced metrics and comprehensive Airbnb data for Saint James. Explore detailed analytics beyond this report to refine your investment strategy, optimize pricing, and maximize your vacation rental profits.
Explore Advanced MetricsSaint James Short-Term Rental Market Composition (2025): Property & Room Types
Room Type Distribution
Property Type Distribution
Market Composition Insights for Saint James
- The Saint James Airbnb market composition is heavily skewed towards Entire Home/Apt listings, which make up 83.3% of the 18 active rentals. This indicates strong guest preference for privacy and space.
- Looking at the property type distribution in Saint James, House properties are the most common (66.7%), reflecting the local real estate landscape.
- Houses represent a significant 66.7% portion, catering likely to families or larger groups.
Saint James Airbnb Room Capacity Analysis (2025): Bedroom Distribution
Distribution of Listings by Number of Bedrooms
Room Capacity Insights for Saint James
- The dominant room capacity in Saint James is 1 bedroom listings, making up 33.3% of the market. This suggests a strong demand for properties suitable for couples or solo travelers.
- Together, 1 bedroom and 2 bedrooms properties represent 61.1% of the active Airbnb listings in Saint James, indicating a high concentration in these sizes.
- A significant 38.9% of listings offer 3+ bedrooms, catering to larger groups and families seeking more space in Saint James.
Saint James Vacation Rental Guest Capacity Trends (2025)
Distribution of Listings by Guest Capacity
Guest Capacity Insights for Saint James
- The most common guest capacity trend in Saint James vacation rentals is listings accommodating 6 guests (27.8%). This suggests the primary traveler segment is likely larger groups.
- Properties designed for 6 guests and 2 guests dominate the Saint James STR market, accounting for 55.6% of listings.
- 44.5% of properties accommodate 6+ guests, serving the market segment for larger families or group travel in Saint James.
- On average, properties in Saint James are equipped to host 4.6 guests.
Saint James Airbnb Booking Patterns (2025): Available vs. Booked Days
Available Days Distribution
Booked Days Distribution
Booking Pattern Insights for Saint James
- The most common availability pattern in Saint James falls within the 271-366 days range, representing 66.7% of listings. This suggests many properties have significant open periods on their calendars.
- Approximately 88.9% of listings show high availability (181+ days open annually), indicating potential for increased bookings or specific owner usage patterns.
- For booked days, the 31-90 days range is most frequent in Saint James (55.6%), reflecting common guest stay durations or potential owner blocking patterns.
- A notable 16.7% of properties secure long booking periods (181+ days booked per year), highlighting successful long-term rental strategies or significant owner usage.
Saint James Airbnb Minimum Stay Requirements Analysis
Distribution of Listings by Minimum Night Requirement
1 Night
3 listings
18.8% of total
3 Nights
3 listings
18.8% of total
4-6 Nights
2 listings
12.5% of total
7-29 Nights
3 listings
18.8% of total
30+ Nights
5 listings
31.3% of total
Key Insights
- The most prevalent minimum stay requirement in Saint James is 30+ Nights, adopted by 31.3% of listings. This highlights the market's preference for longer commitments.
- Very short stays (1-2 nights) are less common (18.8%), suggesting hosts prefer slightly longer bookings to optimize turnover.
- A significant segment (31.3%) caters to monthly stays (30+ nights) in Saint James, pointing to opportunities in the extended-stay market.
Recommendations
- Align with the market by considering a 30+ Nights minimum stay, as 31.3% of Saint James hosts use this setting.
- If feasible, allowing 1-night stays, especially midweek or during low season, could capture last-minute bookings, as only 18.8% currently do.
- Explore offering discounts for stays of 30+ nights to attract the 31.3% of the market seeking extended stays.
- Adjust minimum nights based on seasonality – potentially shorter during low season and longer during peak demand periods in Saint James.
Saint James Airbnb Cancellation Policy Trends Analysis (2025)
Super Strict 30 Days
1 listings
10% of total
Flexible
2 listings
20% of total
Moderate
1 listings
10% of total
Firm
2 listings
20% of total
Strict
4 listings
40% of total
Cancellation Policy Insights for Saint James
- The prevailing Airbnb cancellation policy trend in Saint James is Strict, used by 40% of listings.
- A majority (60.0%) of hosts in Saint James utilize Firm or Strict policies, indicating a market where hosts prioritize booking security.
Recommendations for Hosts
- Consider adopting a Strict policy to align with the 40% market standard in Saint James.
- With 40% using Strict terms, this is a viable option in Saint James, particularly for high-value properties or during peak demand periods.
- Regularly review your cancellation policy against competitors and market demand shifts in Saint James.
Saint James STR Booking Lead Time Analysis (2025)
Average Booking Lead Time by Month
Booking Lead Time Insights for Saint James
- The overall average booking lead time for vacation rentals in Saint James is 62 days.
- Guests book furthest in advance for stays during November (average 169 days), likely coinciding with peak travel demand or local events.
- The shortest booking windows occur for stays in July (average 34 days), indicating more last-minute travel plans during this time.
- Seasonally, Fall (120 days avg.) sees the longest lead times, while Summer (65 days avg.) has the shortest, reflecting typical travel planning cycles.
Recommendations for Hosts
- Use the overall average lead time (62 days) as a baseline for your pricing and availability strategy in Saint James.
- For November stays, consider implementing length-of-stay discounts or slightly higher rates for bookings made less than 169 days out to capitalize on advance planning.
- Target marketing efforts for the Fall season well in advance (at least 120 days) to capture early planners.
- Monitor your own booking lead times against these Saint James averages to identify opportunities for dynamic pricing adjustments.
Popular & Essential Airbnb Amenities in Saint James (2025)
Amenity Prevalence
Amenity Insights for Saint James
- Essential amenities in Saint James that guests expect include: Kitchen, Washer, Wifi, Hot water. Lacking these (any) could significantly impact bookings.
- Popular amenities like Air conditioning, TV, Free parking on premises are common but not universal. Offering these can provide a competitive edge.
Recommendations for Hosts
- Ensure your listing includes all essential amenities for Saint James: Kitchen, Washer, Wifi, Hot water.
- Consider adding popular differentiators like Air conditioning or TV to increase appeal.
- Highlight unique or less common amenities you offer (e.g., hot tub, dedicated workspace, EV charger) in your listing description and photos.
- Regularly check competitor amenities in Saint James to stay competitive.
Saint James Airbnb Guest Demographics & Profile Analysis (2025)
Guest Profile Summary for Saint James
- The typical guest profile for Airbnb in Saint James consists of predominantly international visitors (100%), with top international origins including United Kingdom, typically belonging to the Post-2000s (Gen Z/Alpha) group (50%), primarily speaking English or Spanish.
- Domestic travelers account for 0.0% of guests.
- Key international markets include United States (47.6%) and United Kingdom (33.3%).
- Top languages spoken are English (83.3%) followed by Spanish (16.7%).
- A significant demographic segment is the Post-2000s (Gen Z/Alpha) group, representing 50% of guests.
Recommendations for Hosts
- Focus marketing internationally, particularly towards travelers from United Kingdom.
- Tailor amenities and listing descriptions to appeal to the dominant Post-2000s (Gen Z/Alpha) demographic (e.g., highlight fast WiFi, smart home features, local guides).
- Highlight unique local experiences or amenities relevant to the primary guest profile.
- Consider seasonal promotions aligned with peak travel times for key origin markets.
Nearby Short-Term Rental Market Comparison
How does the Saint James Airbnb market stack up against its neighbors? Compare key performance metrics like average monthly revenue, ADR, and occupancy rates in surrounding areas to understand the broader regional STR landscape.
| Market | Active Properties | Monthly Revenue | Daily Rate | Avg. Occupancy |
|---|---|---|---|---|
| Mullins | 45 | $5,377 | $653.76 | 44% |
| Prospect | 34 | $5,347 | $423.36 | 45% |
| Gibbes | 18 | $4,957 | $493.62 | 45% |
| Mount Standfast | 370 | $4,781 | $563.88 | 41% |
| Clinketts | 14 | $4,454 | $390.35 | 45% |
| Rock Dundo | 19 | $4,323 | $394.32 | 46% |
| Belair | 24 | $4,192 | $377.04 | 40% |
| Speightstown | 51 | $4,172 | $385.90 | 49% |
| Bayfield | 10 | $3,857 | $231.59 | 38% |
| Crane | 16 | $3,800 | $335.01 | 45% |