St. Elizabeths Airbnb Market Analysis 2025: Short Term Rental Data & Vacation Rental Statistics in Saint Joseph, Barbados
Is Airbnb profitable in St. Elizabeths in 2025? Explore comprehensive Airbnb analytics for St. Elizabeths, Saint Joseph, Barbados to uncover income potential. This 2025 STR market report for St. Elizabeths, based on AirROI data from September 2024 to August 2025, reveals key trends in the niche market of 18 active listings.
Whether you're considering an Airbnb investment in St. Elizabeths, optimizing your existing vacation rental, or exploring rental arbitrage opportunities, understanding the St. Elizabeths Airbnb data is crucial. Leveraging the low regulation environment is key to maximizing your short term rental income potential. Let's dive into the specifics.
Key St. Elizabeths Airbnb Performance Metrics Overview
Monthly Airbnb Revenue Variations & Income Potential in St. Elizabeths (2025)
Understanding the monthly revenue variations for Airbnb listings in St. Elizabeths is key to maximizing your short term rental income potential. Seasonality significantly impacts earnings. Our analysis, based on data from the past 12 months, shows that the peak revenue month for STRs in St. Elizabeths is typically December, while July often presents the lowest earnings, highlighting opportunities for strategic pricing adjustments during shoulder and low seasons. Explore the typical Airbnb income in St. Elizabeths across different performance tiers:
- Best-in-class properties (Top 10%) achieve $4,120+ monthly, often utilizing dynamic pricing and superior guest experiences.
- Strong performing properties (Top 25%) earn $2,979 or more, indicating effective management and desirable locations/amenities.
- Typical properties (Median) generate around $1,748 per month, representing the average market performance.
- Entry-level properties (Bottom 25%) see earnings around $893, often with potential for optimization.
Average Monthly Airbnb Earnings Trend in St. Elizabeths
St. Elizabeths Airbnb Occupancy Rate Trends (2025)
Maximize your bookings by understanding the St. Elizabeths STR occupancy trends. Seasonal demand shifts significantly influence how often properties are booked. Typically, Januarysees the highest demand (peak season occupancy), while July experiences the lowest (low season). Effective strategies, like adjusting minimum stays or offering promotions, can boost occupancy during slower periods. Here's how different property tiers perform in St. Elizabeths:
- Best-in-class properties (Top 10%) achieve 65%+ occupancy, indicating high desirability and potentially optimized availability.
- Strong performing properties (Top 25%) maintain 54% or higher occupancy, suggesting good market fit and guest satisfaction.
- Typical properties (Median) have an occupancy rate around 32%.
- Entry-level properties (Bottom 25%) average 19% occupancy, potentially facing higher vacancy.
Average Monthly Occupancy Rate Trend in St. Elizabeths
Average Daily Rate (ADR) Airbnb Trends in St. Elizabeths (2025)
Effective short term rental pricing strategy in St. Elizabeths involves understanding monthly ADR fluctuations. The Average Daily Rate (ADR) for Airbnb in St. Elizabeths typically peaks in January and dips lowest during April. Leveraging Airbnb dynamic pricing tools or strategies based on this seasonality can significantly boost revenue. Here's a look at the typical nightly rates achieved:
- Best-in-class properties (Top 10%) command rates of $327+ per night, often due to premium features or locations.
- Strong performing properties (Top 25%) achieve nightly rates of $224 or more.
- Typical properties (Median) charge around $190 per night.
- Entry-level properties (Bottom 25%) earn around $110 per night.
Average Daily Rate (ADR) Trend by Month in St. Elizabeths
Get Live St. Elizabeths Market Intelligence 👇

Explore Real-time Analytics
Airbnb Seasonality Analysis & Trends in St. Elizabeths (2025)
Peak Season (December, January, October)
- Revenue averages $3,298 per month
- Occupancy rates average 49.4%
- Daily rates average $225
Shoulder Season
- Revenue averages $2,121 per month
- Occupancy maintains around 38.2%
- Daily rates hold near $207
Low Season (July, August, September)
- Revenue drops to average $935 per month
- Occupancy decreases to average 19.7%
- Daily rates adjust to average $200
Seasonality Insights for St. Elizabeths
- The Airbnb seasonality in St. Elizabeths shows highly seasonal trends requiring careful strategy. While the sections above show seasonal averages, it's also insightful to look at the extremes:
- During the high season, the absolute peak month showcases St. Elizabeths's highest earning potential, with monthly revenues capable of climbing to $3,661, occupancy reaching a high of 58.5%, and ADRs peaking at $230.
- Conversely, the slowest single month of the year, typically falling within the low season, marks the market's lowest point. In this month, revenue might dip to $804, occupancy could drop to 16.7%, and ADRs may adjust down to $184.
- Understanding both the seasonal averages and these monthly peaks and troughs in revenue, occupancy, and ADR is crucial for maximizing your Airbnb profit potential in St. Elizabeths.
Seasonal Strategies for Maximizing Profit
- Peak Season: Maximize revenue through premium pricing and potentially longer minimum stays. Ensure high availability.
- Low Season: Offer competitive pricing, special promotions (e.g., extended stay discounts), and flexible cancellation policies. Target off-season travelers like remote workers or budget-conscious guests.
- Shoulder Seasons: Implement dynamic pricing that balances peak and low rates. Target weekend travelers or specific events. Offer slightly more flexible terms than peak season.
- Regularly analyze your own performance against these St. Elizabeths seasonality benchmarks and adjust your pricing and availability strategy accordingly.
Best Areas for Airbnb Investment in St. Elizabeths (2025)
Exploring the top neighborhoods for short-term rentals in St. Elizabeths? This section highlights key areas, outlining why they are attractive for hosts and guests, along with notable local attractions. Consider these locations based on your target guest profile and investment strategy.
| Neighborhood / Area | Why Host Here? (Target Guests & Appeal) | Key Attractions & Landmarks |
|---|---|---|
| Negril | Famous for its stunning beaches and laid-back vibes, perfect for tourists looking to unwind at beautiful resort spots with vibrant nightlife. | Seven Mile Beach, Rick's Cafe, Negril Cliffs, The Blue Hole, Kool Runnings Water Park |
| Ocho Rios | A popular tourist destination known for its beautiful waterfalls, beaches, and rich culture, making it an ideal spot for vacation rentals. | Dunn's River Falls, Mystic Mountain, Ocho Rios Bay Beach, Turtle River Park, Reggae Beach |
| Montego Bay | A major tourist hub with luxurious resorts, golf courses, and vibrant nightlife, attracting visitors from around the world. | Doctor's Cave Beach, Rose Hall Great House, Hip Strip, Martha Brae River, White Witch Golf Course |
| Falmouth | Known for its well-preserved Georgian architecture and close proximity to beaches and attractions, it's gaining attention from visitors. | Falmouth Cruise Ship Port, Glistening Waters, Burwood Beach, The Water Square, Good Hope Estate |
| Port Antonio | Renowned for its stunning natural beauty and lush landscapes, this area appeals to eco-tourists and those seeking tranquility. | Blue Lagoon, Frenchman's Cove, Winnifred Beach, Rafting on the Rio Grande, Portland Jamaica |
| Treasure Beach | A hidden gem on the South Coast known for its unspoiled beaches and charming community atmosphere, ideal for a peaceful getaway. | Treasure Beach, Frenchmans Bay, Billy's Bay, Parottee Bay, Great Pedro Bay |
| South Coast | Features beautiful beaches and is ideal for travelers seeking a quieter, more local experience away from the typical tourist areas. | Jake's Hotel, Black River Safari, YS Falls, Treasure Beach, Parottee Bay |
| Kingston | The vibrant capital city known for its music scene and cultural attractions, perfect for travelers interested in history and urban life. | Bob Marley Museum, Devon House, National Gallery of Jamaica, Emancipation Park, Port Royal |
Understanding Airbnb License Requirements & STR Laws in St. Elizabeths (2025)
While St. Elizabeths, Saint Joseph, Barbados currently shows low STR regulations, specific Airbnb license requirements might still exist or change. Always verify the latest short term rental regulations and Airbnb license requirements directly with local government authorities for St. Elizabeths to ensure full compliance before hosting.
(Source: AirROI data, 2025, finding no licensed listings among those analyzed)
Top Performing Airbnb Properties in St. Elizabeths (2025)
Benchmark your potential! Explore examples of top-performing Airbnb properties in St. Elizabethsbased on Trailing Twelve Month (TTM) revenue. Analyze their characteristics, revenue, occupancy rate, and ADR to understand what drives success in this market.

Beyond "the upper floor" a Paradise in Barbados
Entire Place • 2 bedrooms

Little Diamond, Rustic Wooden Jungle House
Entire Place • 3 bedrooms
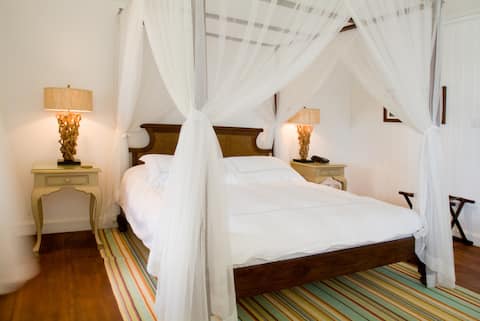
Breathtaking East Coast Suite
Private Room • 1 bedroom
"Beyond" the full house
Entire Place • 4 bedrooms
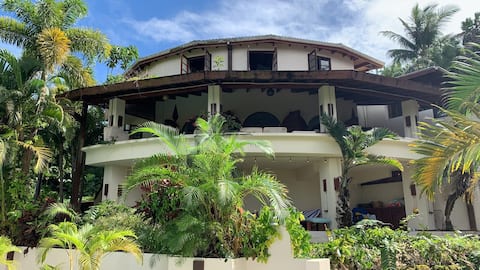
Incredible Villa overlooking Bathsheba
Entire Place • 5 bedrooms

Suryanam -Airy apartment with beautiful oceanview.
Entire Place • 1 bedroom
Note: Performance varies based on location, size, amenities, seasonality, and management quality. Data reflects the past 12 months.
Top Performing Airbnb Hosts in St. Elizabeths (2025)
Learn from the best! This table showcases top-performing Airbnb hosts in St. Elizabeths based on the number of properties managed and estimated total revenue over the past year. Analyze their scale and performance metrics.
| Host Name | Properties | Grossing Revenue | Stay Reviews | Avg Rating |
|---|---|---|---|---|
| Fabio Massimo | 2 | $68,963 | 89 | 4.92/5.0 |
| Andrew L.M Warden And Patricia | 3 | $62,648 | 83 | 4.59/5.0 |
| Jacob | 1 | $38,493 | 56 | 4.61/5.0 |
| Eoin | 1 | $23,909 | 12 | 4.58/5.0 |
| Mario | 1 | $23,406 | 18 | 5.00/5.0 |
| Luke Paul | 1 | $19,976 | 87 | 4.83/5.0 |
| Dominique | 1 | $16,190 | 24 | 4.75/5.0 |
| Peter | 1 | $13,741 | 19 | 4.95/5.0 |
| Jeff & Vicki | 3 | $10,983 | 151 | 4.85/5.0 |
| Cheryl | 1 | $7,377 | 2 | Not Rated |
Analyzing the strategies of top hosts, such as their property selection, pricing, and guest communication, can offer valuable lessons for optimizing your own Airbnb operations in St. Elizabeths.
Dive Deeper: Advanced St. Elizabeths STR Market Data (2025)
Ready to unlock more insights? AirROI provides access to advanced metrics and comprehensive Airbnb data for St. Elizabeths. Explore detailed analytics beyond this report to refine your investment strategy, optimize pricing, and maximize your vacation rental profits.
Explore Advanced MetricsSt. Elizabeths Short-Term Rental Market Composition (2025): Property & Room Types
Room Type Distribution
Property Type Distribution
Market Composition Insights for St. Elizabeths
- The St. Elizabeths Airbnb market composition is heavily skewed towards Entire Home/Apt listings, which make up 77.8% of the 18 active rentals. This indicates strong guest preference for privacy and space.
- Looking at the property type distribution in St. Elizabeths, House properties are the most common (50%), reflecting the local real estate landscape.
- Houses represent a significant 50% portion, catering likely to families or larger groups.
- The presence of 22.2% Hotel/Boutique listings indicates integration with traditional hospitality.
St. Elizabeths Airbnb Room Capacity Analysis (2025): Bedroom Distribution
Distribution of Listings by Number of Bedrooms
Room Capacity Insights for St. Elizabeths
- The dominant room capacity in St. Elizabeths is 1 bedroom listings, making up 33.3% of the market. This suggests a strong demand for properties suitable for couples or solo travelers.
- Together, 1 bedroom and 2 bedrooms properties represent 61.1% of the active Airbnb listings in St. Elizabeths, indicating a high concentration in these sizes.
- A significant 39.0% of listings offer 3+ bedrooms, catering to larger groups and families seeking more space in St. Elizabeths.
St. Elizabeths Vacation Rental Guest Capacity Trends (2025)
Distribution of Listings by Guest Capacity
Guest Capacity Insights for St. Elizabeths
- The most common guest capacity trend in St. Elizabeths vacation rentals is listings accommodating 4 guests (38.9%). This suggests the primary traveler segment is likely small families or groups.
- Properties designed for 4 guests and 2 guests dominate the St. Elizabeths STR market, accounting for 72.2% of listings.
- 22.2% of properties accommodate 6+ guests, serving the market segment for larger families or group travel in St. Elizabeths.
- On average, properties in St. Elizabeths are equipped to host 3.8 guests.
St. Elizabeths Airbnb Booking Patterns (2025): Available vs. Booked Days
Available Days Distribution
Booked Days Distribution
Booking Pattern Insights for St. Elizabeths
- The most common availability pattern in St. Elizabeths falls within the 271-366 days range, representing 50% of listings. This suggests many properties have significant open periods on their calendars.
- Approximately 88.9% of listings show high availability (181+ days open annually), indicating potential for increased bookings or specific owner usage patterns.
- For booked days, the 91-180 days range is most frequent in St. Elizabeths (38.9%), reflecting common guest stay durations or potential owner blocking patterns.
- A notable 11.1% of properties secure long booking periods (181+ days booked per year), highlighting successful long-term rental strategies or significant owner usage.
St. Elizabeths Airbnb Minimum Stay Requirements Analysis
Distribution of Listings by Minimum Night Requirement
1 Night
4 listings
23.5% of total
4-6 Nights
4 listings
23.5% of total
7-29 Nights
4 listings
23.5% of total
30+ Nights
5 listings
29.4% of total
Key Insights
- The most prevalent minimum stay requirement in St. Elizabeths is 30+ Nights, adopted by 29.4% of listings. This highlights the market's preference for longer commitments.
- A significant segment (29.4%) caters to monthly stays (30+ nights) in St. Elizabeths, pointing to opportunities in the extended-stay market.
Recommendations
- Align with the market by considering a 30+ Nights minimum stay, as 29.4% of St. Elizabeths hosts use this setting.
- If feasible, allowing 1-night stays, especially midweek or during low season, could capture last-minute bookings, as only 23.5% currently do.
- Explore offering discounts for stays of 30+ nights to attract the 29.4% of the market seeking extended stays.
- Adjust minimum nights based on seasonality – potentially shorter during low season and longer during peak demand periods in St. Elizabeths.
St. Elizabeths Airbnb Cancellation Policy Trends Analysis (2025)
Flexible
3 listings
17.6% of total
Moderate
1 listings
5.9% of total
Firm
5 listings
29.4% of total
Strict
8 listings
47.1% of total
Cancellation Policy Insights for St. Elizabeths
- The prevailing Airbnb cancellation policy trend in St. Elizabeths is Strict, used by 47.1% of listings.
- A majority (76.5%) of hosts in St. Elizabeths utilize Firm or Strict policies, indicating a market where hosts prioritize booking security.
Recommendations for Hosts
- Consider adopting a Strict policy to align with the 47.1% market standard in St. Elizabeths.
- With 47.1% using Strict terms, this is a viable option in St. Elizabeths, particularly for high-value properties or during peak demand periods.
- Regularly review your cancellation policy against competitors and market demand shifts in St. Elizabeths.
St. Elizabeths STR Booking Lead Time Analysis (2025)
Average Booking Lead Time by Month
Booking Lead Time Insights for St. Elizabeths
- The overall average booking lead time for vacation rentals in St. Elizabeths is 68 days.
- Guests book furthest in advance for stays during January (average 98 days), likely coinciding with peak travel demand or local events.
- The shortest booking windows occur for stays in June (average 5 days), indicating more last-minute travel plans during this time.
- Seasonally, Winter (90 days avg.) sees the longest lead times, while Summer (32 days avg.) has the shortest, reflecting typical travel planning cycles.
Recommendations for Hosts
- Use the overall average lead time (68 days) as a baseline for your pricing and availability strategy in St. Elizabeths.
- For January stays, consider implementing length-of-stay discounts or slightly higher rates for bookings made less than 98 days out to capitalize on advance planning.
- During June, focus on last-minute booking availability and promotions, as guests book with very short notice (5 days avg.).
- Target marketing efforts for the Winter season well in advance (at least 90 days) to capture early planners.
- Monitor your own booking lead times against these St. Elizabeths averages to identify opportunities for dynamic pricing adjustments.
Popular & Essential Airbnb Amenities in St. Elizabeths (2025)
Amenity Prevalence
Amenity Insights for St. Elizabeths
- Essential amenities in St. Elizabeths that guests expect include: Kitchen. Lacking these (this) could significantly impact bookings.
- Popular amenities like Free parking on premises, Wifi, TV are common but not universal. Offering these can provide a competitive edge.
- Warning: Wifi is not universally provided but is considered essential globally. Ensure reliable Wifi is offered.
Recommendations for Hosts
- Ensure your listing includes all essential amenities for St. Elizabeths: Kitchen.
- Consider adding popular differentiators like Free parking on premises or Wifi to increase appeal.
- Highlight unique or less common amenities you offer (e.g., hot tub, dedicated workspace, EV charger) in your listing description and photos.
- Regularly check competitor amenities in St. Elizabeths to stay competitive.
St. Elizabeths Airbnb Guest Demographics & Profile Analysis (2025)
Guest Profile Summary for St. Elizabeths
- The typical guest profile for Airbnb in St. Elizabeths consists of predominantly international visitors (91%), with top international origins including United Kingdom, typically belonging to the Post-2000s (Gen Z/Alpha) group (50%), primarily speaking English or French.
- Domestic travelers account for 9.5% of guests.
- Key international markets include United States (34.9%) and United Kingdom (25.4%).
- Top languages spoken are English (44.6%) followed by French (17.9%).
- A significant demographic segment is the Post-2000s (Gen Z/Alpha) group, representing 50% of guests.
Recommendations for Hosts
- Focus marketing internationally, particularly towards travelers from United Kingdom.
- Tailor amenities and listing descriptions to appeal to the dominant Post-2000s (Gen Z/Alpha) demographic (e.g., highlight fast WiFi, smart home features, local guides).
- Highlight unique local experiences or amenities relevant to the primary guest profile.
- Consider seasonal promotions aligned with peak travel times for key origin markets.
Nearby Short-Term Rental Market Comparison
How does the St. Elizabeths Airbnb market stack up against its neighbors? Compare key performance metrics like average monthly revenue, ADR, and occupancy rates in surrounding areas to understand the broader regional STR landscape.
| Market | Active Properties | Monthly Revenue | Daily Rate | Avg. Occupancy |
|---|---|---|---|---|
| Prospect | 30 | $5,095 | $453.27 | 50% |
| Clinketts | 13 | $5,037 | $422.23 | 48% |
| Rock Dundo | 22 | $4,757 | $564.06 | 46% |
| Belair | 33 | $4,734 | $506.73 | 40% |
| Mount Standfast | 405 | $4,308 | $590.31 | 41% |
| Cap Estate | 17 | $4,073 | $613.86 | 35% |
| Gibbes | 18 | $4,072 | $378.21 | 43% |
| Mullins | 48 | $3,956 | $432.30 | 49% |
| Speightstown | 59 | $3,629 | $405.20 | 50% |
| Fitts Village | 72 | $3,440 | $317.33 | 51% |