Antwerp Airbnb Market Analysis 2025: Short Term Rental Data & Vacation Rental Statistics in Antwerp, Belgium
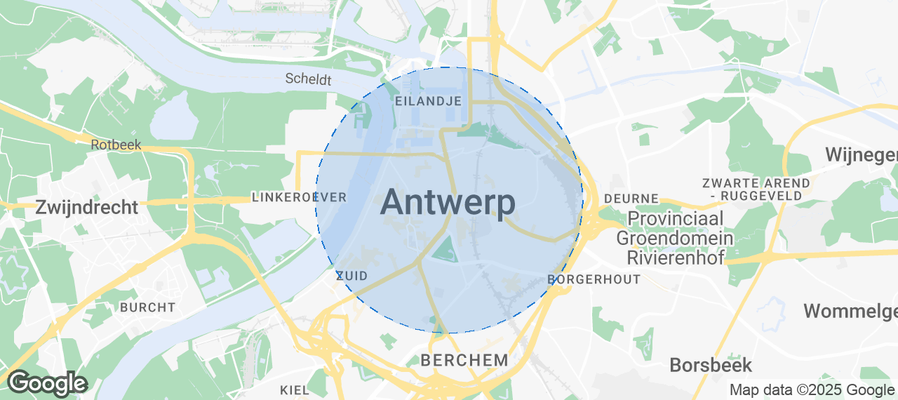
Is Airbnb profitable in Antwerp in 2025? Explore comprehensive Airbnb analytics for Antwerp, Antwerp, Belgium to uncover income potential. This 2025 STR market report for Antwerp, based on AirROI data from July 2024 to June 2025, reveals key trends in the bustling market of 2,003 active listings.
Whether you're considering an Airbnb investment in Antwerp, optimizing your existing vacation rental, or exploring rental arbitrage opportunities, understanding the Antwerp Airbnb data is crucial. Leveraging the low regulation environment is key to maximizing your short term rental income potential. Let's dive into the specifics.
Key Antwerp Airbnb Performance Metrics Overview
Monthly Airbnb Revenue Variations & Income Potential in Antwerp (2025)
Understanding the monthly revenue variations for Airbnb listings in Antwerp is key to maximizing your short term rental income potential. Seasonality significantly impacts earnings. Our analysis, based on data from the past 12 months, shows that the peak revenue month for STRs in Antwerp is typically August, while January often presents the lowest earnings, highlighting opportunities for strategic pricing adjustments during shoulder and low seasons. Explore the typical Airbnb income in Antwerp across different performance tiers:
- Best-in-class properties (Top 10%) achieve $3,708+ monthly, often utilizing dynamic pricing and superior guest experiences.
- Strong performing properties (Top 25%) earn $2,482 or more, indicating effective management and desirable locations/amenities.
- Typical properties (Median) generate around $1,533 per month, representing the average market performance.
- Entry-level properties (Bottom 25%) see earnings around $844, often with potential for optimization.
Average Monthly Airbnb Earnings Trend in Antwerp
Antwerp Airbnb Occupancy Rate Trends (2025)
Maximize your bookings by understanding the Antwerp STR occupancy trends. Seasonal demand shifts significantly influence how often properties are booked. Typically, Augustsees the highest demand (peak season occupancy), while January experiences the lowest (low season). Effective strategies, like adjusting minimum stays or offering promotions, can boost occupancy during slower periods. Here's how different property tiers perform in Antwerp:
- Best-in-class properties (Top 10%) achieve 84%+ occupancy, indicating high desirability and potentially optimized availability.
- Strong performing properties (Top 25%) maintain 67% or higher occupancy, suggesting good market fit and guest satisfaction.
- Typical properties (Median) have an occupancy rate around 46%.
- Entry-level properties (Bottom 25%) average 25% occupancy, potentially facing higher vacancy.
Average Monthly Occupancy Rate Trend in Antwerp
Average Daily Rate (ADR) Airbnb Trends in Antwerp (2025)
Effective short term rental pricing strategy in Antwerp involves understanding monthly ADR fluctuations. The Average Daily Rate (ADR) for Airbnb in Antwerp typically peaks in June and dips lowest during January. Leveraging Airbnb dynamic pricing tools or strategies based on this seasonality can significantly boost revenue. Here's a look at the typical nightly rates achieved:
- Best-in-class properties (Top 10%) command rates of $222+ per night, often due to premium features or locations.
- Strong performing properties (Top 25%) achieve nightly rates of $150 or more.
- Typical properties (Median) charge around $105 per night.
- Entry-level properties (Bottom 25%) earn around $76 per night.
Average Daily Rate (ADR) Trend by Month in Antwerp
Get Live Antwerp Market Intelligence 👇
Explore Real-time Analytics
Airbnb Seasonality Analysis & Trends in Antwerp (2025)
Peak Season (August, December, May)
- Revenue averages $2,167 per month
- Occupancy rates average 50.6%
- Daily rates average $132
Shoulder Season
- Revenue averages $1,976 per month
- Occupancy maintains around 47.9%
- Daily rates hold near $132
Low Season (January, February, November)
- Revenue drops to average $1,591 per month
- Occupancy decreases to average 40.8%
- Daily rates adjust to average $126
Seasonality Insights for Antwerp
- The Airbnb seasonality in Antwerp shows moderate seasonality with distinct peak and low periods. While the sections above show seasonal averages, it's also insightful to look at the extremes:
- During the high season, the absolute peak month showcases Antwerp's highest earning potential, with monthly revenues capable of climbing to $2,182, occupancy reaching a high of 54.5%, and ADRs peaking at $147.
- Conversely, the slowest single month of the year, typically falling within the low season, marks the market's lowest point. In this month, revenue might dip to $1,471, occupancy could drop to 37.1%, and ADRs may adjust down to $122.
- Understanding both the seasonal averages and these monthly peaks and troughs in revenue, occupancy, and ADR is crucial for maximizing your Airbnb profit potential in Antwerp.
Seasonal Strategies for Maximizing Profit
- Peak Season: Maximize revenue through premium pricing and potentially longer minimum stays. Ensure high availability.
- Low Season: Offer competitive pricing, special promotions (e.g., extended stay discounts), and flexible cancellation policies. Target off-season travelers like remote workers or budget-conscious guests.
- Shoulder Seasons: Implement dynamic pricing that balances peak and low rates. Target weekend travelers or specific events. Offer slightly more flexible terms than peak season.
- Regularly analyze your own performance against these Antwerp seasonality benchmarks and adjust your pricing and availability strategy accordingly.
Best Areas for Airbnb Investment in Antwerp (2025)
Exploring the top neighborhoods for short-term rentals in Antwerp? This section highlights key areas, outlining why they are attractive for hosts and guests, along with notable local attractions. Consider these locations based on your target guest profile and investment strategy.
| Neighborhood / Area | Why Host Here? (Target Guests & Appeal) | Key Attractions & Landmarks |
|---|---|---|
| City Centre | The heart of Antwerp, known for its historic architecture, shopping, and cultural attractions. Ideal for tourists wanting to explore the city's rich history and vibrant atmosphere. | Antwerp Cathedral, Grote Markt, Museum aan de Stroom (MAS), Antwerp Zoo, Meir shopping street |
| Antwerp South (Zuid) | A fashionable district with art galleries, trendy restaurants, and beautiful parks. Popular among young people and artists, making it appealing for Airbnb guests. | Royal Museum of Fine Arts, Het Zuid, Antwerp Port House, Stanley’s, Kloosterstraat antique street |
| Eilandje | A waterfront neighborhood known for its marina, modern architecture, and restaurants. Great for travelers looking for a relaxed yet vibrant environment near the water. | Museum aan de Stroom (MAS), Red Star Line Museum, Antwerp Marina, Picks Beer, Bonaparte |
| Borgerhout | An up-and-coming area with a multicultural vibe. Increasingly popular among younger tenants and Airbnb hosts looking to attract diverse guests. | Parks and playgrounds, Kloosterstraat antique market, theater festivals, local bars and restaurants |
| Berchem | A residential area with a mix of cultures, conveniently located near public transit. A good choice for families and business travelers. | Station Berchem, Zurenborg architecture, Hernán Cortés Park, local eateries and cafes |
| Antwerp North | A local neighborhood with authentic charm, close to local amenities and connections to public transport. Popular for guests seeking a quieter stay while being close to the city. | Damplein Square, local gyms and parks, community markets, boutique shops |
| Luchtbal | A green and peaceful area of Antwerp, perfect for those seeking a quieter atmosphere while remaining accessible to the city, appealing for longer stays. | Middelarespark, Harmoniepark, local cafes and bakeries |
| Linkeroever | A residential area across the river, offering stunning views of the Antwerp skyline. Attracts guests wanting to be near the city while enjoying a relaxing environment. | Linkeroever Beach, Havenkwartier, beautiful riverside walks |
Understanding Airbnb License Requirements & STR Laws in Antwerp (2025)
While Antwerp, Antwerp, Belgium currently shows low STR regulations, specific Airbnb license requirements might still exist or change. Always verify the latest short term rental regulations and Airbnb license requirements directly with local government authorities for Antwerp to ensure full compliance before hosting.
(Source: AirROI data, 2025, based on 1% licensed listings)
Top Performing Airbnb Properties in Antwerp (2025)
Benchmark your potential! Explore examples of top-performing Airbnb properties in Antwerpbased on Trailing Twelve Month (TTM) revenue. Analyze their characteristics, revenue, occupancy rate, and ADR to understand what drives success in this market.

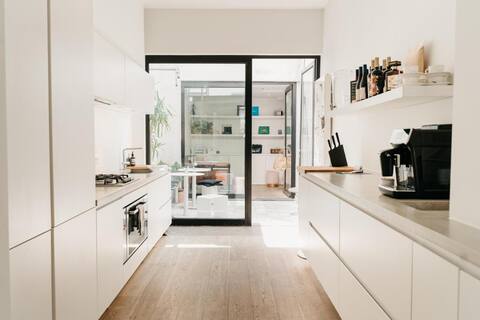
Unique City Center Private Boutique Residence
Entire Place • 6 bedrooms
Beautiful Antwerp Holiday Home (up to 12 Guests)
Entire Place • 5 bedrooms

Townhouse in Antwerp for max 10p
Entire Place • 5 bedrooms

Belle Epoque Townhouse Antwerp
Entire Place • 5 bedrooms
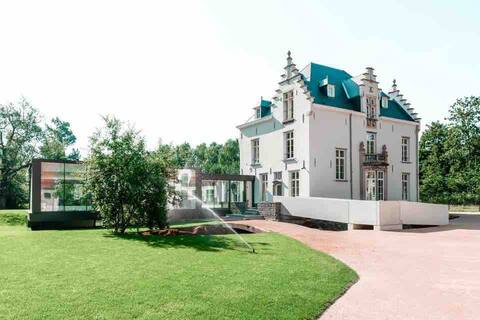
Boterlaerhof Castle near Antwerp
Entire Place • 7 bedrooms
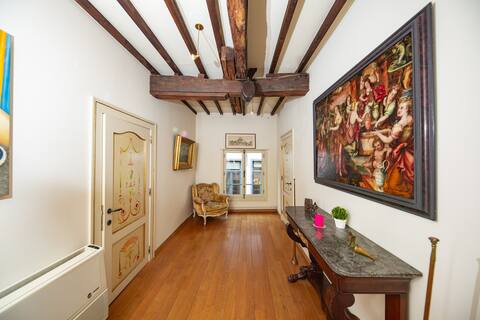
HOFMARKGRAAF: Unique apartment in historic mansion
Entire Place • 4 bedrooms
Note: Performance varies based on location, size, amenities, seasonality, and management quality. Data reflects the past 12 months.
Top Performing Airbnb Hosts in Antwerp (2025)
Learn from the best! This table showcases top-performing Airbnb hosts in Antwerp based on the number of properties managed and estimated total revenue over the past year. Analyze their scale and performance metrics.
| Host Name | Properties | Grossing Revenue | Stay Reviews | Avg Rating |
|---|---|---|---|---|
| Ella | 122 | $1,396,404 | 7539 | 4.10/5.0 |
| Lisa | 60 | $727,771 | 3494 | 4.13/5.0 |
| Arne | 19 | $718,557 | 3776 | 4.71/5.0 |
| Sleep Inn Antwerp | 42 | $661,708 | 1449 | 4.57/5.0 |
| Emma | 63 | $633,428 | 1472 | 4.08/5.0 |
| Anna From HUSWELL | 28 | $511,438 | 262 | 4.25/5.0 |
| Marie | 12 | $491,402 | 790 | 4.54/5.0 |
| Liselore | 21 | $473,026 | 676 | 4.69/5.0 |
| Dante | 10 | $470,360 | 139 | 4.49/5.0 |
| Home & Hill | 28 | $465,413 | 955 | 4.19/5.0 |
Analyzing the strategies of top hosts, such as their property selection, pricing, and guest communication, can offer valuable lessons for optimizing your own Airbnb operations in Antwerp.
Dive Deeper: Advanced Antwerp STR Market Data (2025)
Ready to unlock more insights? AirROI provides access to advanced metrics and comprehensive Airbnb data for Antwerp. Explore detailed analytics beyond this report to refine your investment strategy, optimize pricing, and maximize your vacation rental profits.
Explore Advanced MetricsAntwerp Short-Term Rental Market Composition (2025): Property & Room Types
Room Type Distribution
Property Type Distribution
Market Composition Insights for Antwerp
- The Antwerp Airbnb market composition is heavily skewed towards Entire Home/Apt listings, which make up 86.4% of the 2,003 active rentals. This indicates strong guest preference for privacy and space.
- Looking at the property type distribution in Antwerp, Apartment/Condo properties are the most common (81%), reflecting the local real estate landscape.
- Smaller segments like hotel/boutique, others, unique stays, outdoor/unique (combined 4.7%) offer potential for unique stay experiences.
Antwerp Airbnb Room Capacity Analysis (2025): Bedroom Distribution
Distribution of Listings by Number of Bedrooms
Room Capacity Insights for Antwerp
- The dominant room capacity in Antwerp is 1 bedroom listings, making up 50.9% of the market. This suggests a strong demand for properties suitable for couples or solo travelers.
- Together, 1 bedroom and 2 bedrooms properties represent 75.9% of the active Airbnb listings in Antwerp, indicating a high concentration in these sizes.
- With over half the market (50.9%) consisting of studios or 1-bedroom units, Antwerp is particularly well-suited for individuals or couples.
Antwerp Vacation Rental Guest Capacity Trends (2025)
Distribution of Listings by Guest Capacity
Guest Capacity Insights for Antwerp
- The most common guest capacity trend in Antwerp vacation rentals is listings accommodating 2 guests (32.7%). This suggests the primary traveler segment is likely couples or solo travelers.
- Properties designed for 2 guests and 4 guests dominate the Antwerp STR market, accounting for 56.7% of listings.
- 24.6% of properties accommodate 6+ guests, serving the market segment for larger families or group travel in Antwerp.
- On average, properties in Antwerp are equipped to host 3.7 guests.
Antwerp Airbnb Booking Patterns (2025): Available vs. Booked Days
Available Days Distribution
Booked Days Distribution
Booking Pattern Insights for Antwerp
- The most common availability pattern in Antwerp falls within the 181-270 days range, representing 37.1% of listings. This suggests many properties have significant open periods on their calendars.
- Approximately 73.0% of listings show high availability (181+ days open annually), indicating potential for increased bookings or specific owner usage patterns.
- For booked days, the 91-180 days range is most frequent in Antwerp (38.2%), reflecting common guest stay durations or potential owner blocking patterns.
- A notable 28.1% of properties secure long booking periods (181+ days booked per year), highlighting successful long-term rental strategies or significant owner usage.
Antwerp Airbnb Minimum Stay Requirements Analysis
Distribution of Listings by Minimum Night Requirement
1 Night
738 listings
39.1% of total
2 Nights
524 listings
27.8% of total
3 Nights
90 listings
4.8% of total
4-6 Nights
79 listings
4.2% of total
7-29 Nights
134 listings
7.1% of total
30+ Nights
321 listings
17% of total
Key Insights
- The most prevalent minimum stay requirement in Antwerp is 1 Night, adopted by 39.1% of listings. This highlights the market's preference for shorter, flexible bookings.
- A strong majority (66.9%) of the Antwerp Airbnb data shows acceptance of very short stays (1-2 nights), indicating a dynamic, high-turnover market.
- A significant segment (17%) caters to monthly stays (30+ nights) in Antwerp, pointing to opportunities in the extended-stay market.
Recommendations
- Align with the market by considering a 1 Night minimum stay, as 39.1% of Antwerp hosts use this setting.
- Explore offering discounts for stays of 30+ nights to attract the 17% of the market seeking extended stays.
- Adjust minimum nights based on seasonality – potentially shorter during low season and longer during peak demand periods in Antwerp.
Antwerp Airbnb Cancellation Policy Trends Analysis (2025)
Super Strict 60 Days
3 listings
0.2% of total
Super Strict 30 Days
201 listings
10.6% of total
Flexible
447 listings
23.5% of total
Moderate
593 listings
31.2% of total
Firm
296 listings
15.6% of total
Strict
360 listings
18.9% of total
Cancellation Policy Insights for Antwerp
- The prevailing Airbnb cancellation policy trend in Antwerp is Moderate, used by 31.2% of listings.
- There's a relatively balanced mix between guest-friendly (54.7%) and stricter (34.5%) policies, offering choices for different guest needs.
Recommendations for Hosts
- Consider adopting a Moderate policy to align with the 31.2% market standard in Antwerp.
- Regularly review your cancellation policy against competitors and market demand shifts in Antwerp.
Antwerp STR Booking Lead Time Analysis (2025)
Average Booking Lead Time by Month
Booking Lead Time Insights for Antwerp
- The overall average booking lead time for vacation rentals in Antwerp is 41 days.
- Guests book furthest in advance for stays during February (average 56 days), likely coinciding with peak travel demand or local events.
- The shortest booking windows occur for stays in August (average 32 days), indicating more last-minute travel plans during this time.
- Seasonally, Spring (48 days avg.) sees the longest lead times, while Fall (40 days avg.) has the shortest, reflecting typical travel planning cycles.
Recommendations for Hosts
- Use the overall average lead time (41 days) as a baseline for your pricing and availability strategy in Antwerp.
- For February stays, consider implementing length-of-stay discounts or slightly higher rates for bookings made less than 56 days out to capitalize on advance planning.
- Target marketing efforts for the Spring season well in advance (at least 48 days) to capture early planners.
- Monitor your own booking lead times against these Antwerp averages to identify opportunities for dynamic pricing adjustments.
Popular & Essential Airbnb Amenities in Antwerp (2025)
Amenity data is currently unavailable for Antwerp.
Antwerp Airbnb Guest Demographics & Profile Analysis (2025)
Guest Profile Summary for Antwerp
- The typical guest profile for Airbnb in Antwerp consists of predominantly international visitors (89%), with top international origins including Germany, typically belonging to the Post-2000s (Gen Z/Alpha) group (50%), primarily speaking English or Dutch.
- Domestic travelers account for 11.2% of guests.
- Key international markets include Netherlands (26.4%) and Germany (15.2%).
- Top languages spoken are English (39.8%) followed by Dutch (13.5%).
- A significant demographic segment is the Post-2000s (Gen Z/Alpha) group, representing 50% of guests.
Recommendations for Hosts
- Focus marketing internationally, particularly towards travelers from Germany.
- Tailor amenities and listing descriptions to appeal to the dominant Post-2000s (Gen Z/Alpha) demographic (e.g., highlight fast WiFi, smart home features, local guides).
- Highlight unique local experiences or amenities relevant to the primary guest profile.
- Consider seasonal promotions aligned with peak travel times for key origin markets.
Nearby Short-Term Rental Market Comparison
How does the Antwerp Airbnb market stack up against its neighbors? Compare key performance metrics like average monthly revenue, ADR, and occupancy rates in surrounding areas to understand the broader regional STR landscape.
| Market | Active Properties | Monthly Revenue | Daily Rate | Avg. Occupancy |
|---|---|---|---|---|
| Kockengen | 12 | $7,677 | $440.23 | 62% |
| Merksplas | 11 | $6,282 | $357.33 | 47% |
| Raamsdonksveer | 13 | $5,656 | $570.33 | 43% |
| Bentveld | 14 | $5,404 | $465.38 | 58% |
| Haghorst | 11 | $5,201 | $456.91 | 39% |
| Dion | 12 | $4,682 | $277.19 | 57% |
| Incourt | 11 | $4,232 | $338.50 | 42% |
| Zerkegem | 10 | $4,206 | $429.87 | 51% |
| Beernem | 20 | $4,036 | $315.56 | 44% |
| Wellin | 10 | $4,032 | $262.28 | 45% |