Rumst Airbnb Market Analysis 2026: Short Term Rental Data & Vacation Rental Statistics in Antwerp, Belgium
Is Airbnb profitable in Rumst in 2026? Explore comprehensive Airbnb analytics for Rumst, Antwerp, Belgium to uncover income potential. This 2026 STR market report for Rumst, based on AirROI data from February 2025 to January 2026, reveals key trends in the niche market of 39 active listings.
Whether you're considering an Airbnb investment in Rumst, optimizing your existing vacation rental, or exploring rental arbitrage opportunities, understanding the Rumst Airbnb data is crucial. Leveraging the low regulation environment is key to maximizing your short term rental income potential. Let's dive into the specifics.
Key Rumst Airbnb Performance Metrics Overview
Monthly Airbnb Revenue Variations & Income Potential in Rumst (2026)
Understanding the monthly revenue variations for Airbnb listings in Rumst is key to maximizing your short term rental income potential. Seasonality significantly impacts earnings. Our analysis, based on data from the past 12 months, shows that the peak revenue month for STRs in Rumst is typically August, while September often presents the lowest earnings, highlighting opportunities for strategic pricing adjustments during shoulder and low seasons. Explore the typical Airbnb income in Rumst across different performance tiers:
- Best-in-class properties (Top 10%) achieve $11,113+ monthly, often utilizing dynamic pricing and superior guest experiences.
- Strong performing properties (Top 25%) earn $4,197 or more, indicating effective management and desirable locations/amenities.
- Typical properties (Median) generate around $2,199 per month, representing the average market performance.
- Entry-level properties (Bottom 25%) see earnings around $966, often with potential for optimization.
Average Monthly Airbnb Earnings Trend in Rumst
Rumst Airbnb Occupancy Rate Trends (2026)
Maximize your bookings by understanding the Rumst STR occupancy trends. Seasonal demand shifts significantly influence how often properties are booked. Typically, Junesees the highest demand (peak season occupancy), while May experiences the lowest (low season). Effective strategies, like adjusting minimum stays or offering promotions, can boost occupancy during slower periods. Here's how different property tiers perform in Rumst:
- Best-in-class properties (Top 10%) achieve 89%+ occupancy, indicating high desirability and potentially optimized availability.
- Strong performing properties (Top 25%) maintain 66% or higher occupancy, suggesting good market fit and guest satisfaction.
- Typical properties (Median) have an occupancy rate around 30%.
- Entry-level properties (Bottom 25%) average 16% occupancy, potentially facing higher vacancy.
Average Monthly Occupancy Rate Trend in Rumst
Average Daily Rate (ADR) Airbnb Trends in Rumst (2026)
Effective short term rental pricing strategy in Rumst involves understanding monthly ADR fluctuations. The Average Daily Rate (ADR) for Airbnb in Rumst typically peaks in October and dips lowest during February. Leveraging Airbnb dynamic pricing tools or strategies based on this seasonality can significantly boost revenue. Here's a look at the typical nightly rates achieved:
- Best-in-class properties (Top 10%) command rates of $980+ per night, often due to premium features or locations.
- Strong performing properties (Top 25%) achieve nightly rates of $433 or more.
- Typical properties (Median) charge around $223 per night.
- Entry-level properties (Bottom 25%) earn around $147 per night.
Average Daily Rate (ADR) Trend by Month in Rumst
Get Live Rumst Market Intelligence 👇

Explore Real-time Analytics
Airbnb Seasonality Analysis & Trends in Rumst (2026)
Peak Season (August, June, July)
- Revenue averages $6,497 per month
- Occupancy rates average 46.8%
- Daily rates average $366
Shoulder Season
- Revenue averages $3,104 per month
- Occupancy maintains around 41.4%
- Daily rates hold near $409
Low Season (May, September, October)
- Revenue drops to average $2,232 per month
- Occupancy decreases to average 39.3%
- Daily rates adjust to average $423
Seasonality Insights for Rumst
- The Airbnb seasonality in Rumst shows highly seasonal trends requiring careful strategy. While the sections above show seasonal averages, it's also insightful to look at the extremes:
- During the high season, the absolute peak month showcases Rumst's highest earning potential, with monthly revenues capable of climbing to $8,460, occupancy reaching a high of 51.0%, and ADRs peaking at $480.
- Conversely, the slowest single month of the year, typically falling within the low season, marks the market's lowest point. In this month, revenue might dip to $1,654, occupancy could drop to 30.6%, and ADRs may adjust down to $343.
- Understanding both the seasonal averages and these monthly peaks and troughs in revenue, occupancy, and ADR is crucial for maximizing your Airbnb profit potential in Rumst.
Seasonal Strategies for Maximizing Profit
- Peak Season: Maximize revenue through premium pricing and potentially longer minimum stays. Ensure high availability.
- Low Season: Offer competitive pricing, special promotions (e.g., extended stay discounts), and flexible cancellation policies. Target off-season travelers like remote workers or budget-conscious guests.
- Shoulder Seasons: Implement dynamic pricing that balances peak and low rates. Target weekend travelers or specific events. Offer slightly more flexible terms than peak season.
- Regularly analyze your own performance against these Rumst seasonality benchmarks and adjust your pricing and availability strategy accordingly.
Best Areas for Airbnb Investment in Rumst (2026)
Exploring the top neighborhoods for short-term rentals in Rumst? This section highlights key areas, outlining why they are attractive for hosts and guests, along with notable local attractions. Consider these locations based on your target guest profile and investment strategy.
| Neighborhood / Area | Why Host Here? (Target Guests & Appeal) | Key Attractions & Landmarks |
|---|---|---|
| Rumst Center | The heart of Rumst with easy access to restaurants and shops. Great for those seeking local experiences and convenience. | Rumst Town Hall, Local shops and cafes, Public park, Nearby nature trails, Accessibility to Antwerp |
| Mechelen Area | A short distance from Rumst, Mechelen offers a rich history and beautiful architecture. It's a growing area for tourists wanting a quieter stay. | St. Rumbold's Cathedral, Mechelen City Hall, Kruidtuin, Toy Museum, Beguinage of Mechelen |
| Kessel | A charming village near Rumst, known for its picturesque landscapes and peace. Ideal for nature lovers and families. | Kessel Castle, Local walking routes, River Nete, Cycling paths, Nature reserves |
| Antwerp Central | Just a short train ride away, this area is famous for its diamond district, fashion, and vibrant arts scene. A major draw for visitors. | Antwerp Central Station, Diamond District, Cathedral of Our Lady, Antwerp Zoo, Museum aan de Stroom (MAS) |
| Willebroek | Close to Rumst and offers unique local attractions. Good for travelers looking to explore the history and culture of the region. | Willebroek Canal, Historical buildings, Local markets, Nature walks, Nearby sports facilities |
| Lier | A picturesque town nearby, famous for its historic architecture and charming streets. A great option for those wanting a quaint experience. | Lier Beguinage, Zimmer Tower, Local parks, Dijlestad, The River Dyle |
| Putte | A peaceful village with a rural feel, perfect for a relaxing getaway. Close to nature and outdoor activities. | Local farms, Nature paths, Community activities, Biking routes, Quiet surroundings |
| Hombeek | A smaller, quiet area that offers a suburban feel with local charm. Ideal for families and visitors looking for a peaceful stay. | Local parks, Community events, Quiet neighborhoods, Access to nature, Cycling and walking paths |
Understanding Airbnb License Requirements & STR Laws in Rumst (2026)
While Rumst, Antwerp, Belgium currently shows low STR regulations, specific Airbnb license requirements might still exist or change. Always verify the latest short term rental regulations and Airbnb license requirements directly with local government authorities for Rumst to ensure full compliance before hosting.
(Source: AirROI data, 2026, finding no licensed listings among those analyzed)
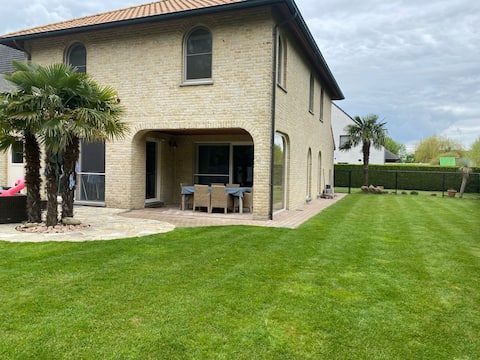
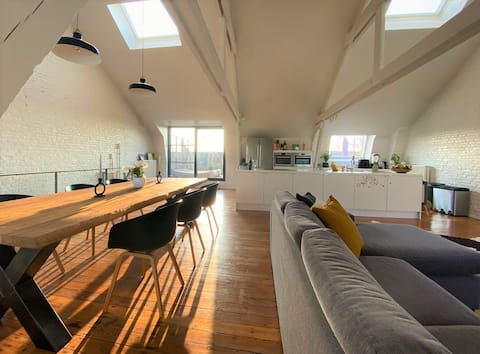
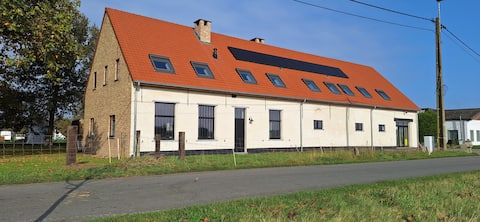
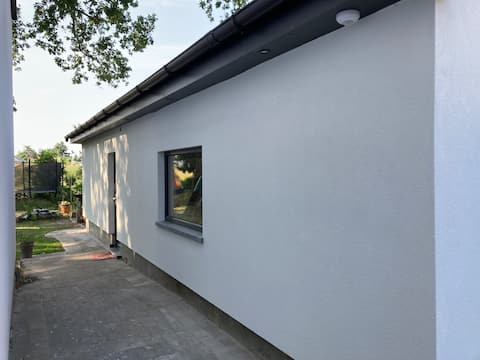
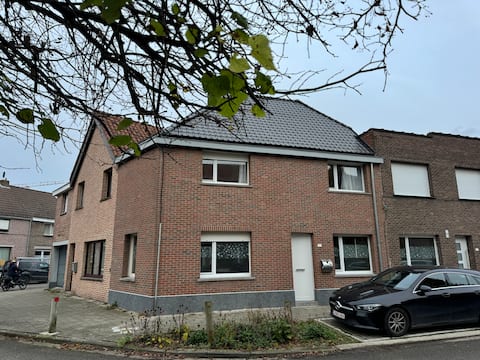
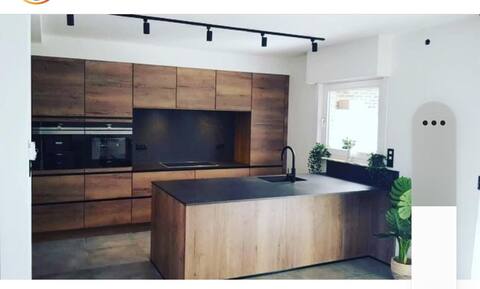
Top Performing Airbnb Properties in Rumst (2026)
Benchmark your potential! Explore examples of top-performing Airbnb properties in Rumstbased on Trailing Twelve Month (TTM) revenue. Analyze their characteristics, revenue, occupancy rate, and ADR to understand what drives success in this market.
House near Tomorrowland for 8 people!
Entire Place • 4 bedrooms
Tomorrowland Loft 2km away from festival
Entire Place • 5 bedrooms
Sheela Farm
Entire Place • 4 bedrooms
Dreamscape Cottage "Tomorrowland Unites"
Entire Place • 3 bedrooms
Centrally located house for six
Entire Place • 3 bedrooms
Close to Tomorrowland!
Entire Place • 3 bedrooms
Note: Performance varies based on location, size, amenities, seasonality, and management quality. Data reflects the past 12 months.
Top Performing Airbnb Hosts in Rumst (2026)
Learn from the best! This table showcases top-performing Airbnb hosts in Rumst based on the number of properties managed and estimated total revenue over the past year. Analyze their scale and performance metrics.
| Host Name | Properties | Grossing Revenue | Stay Reviews | Avg Rating |
|---|---|---|---|---|
| Valentine | 1 | $154,983 | 2 | Not Rated |
| Areta | 1 | $107,447 | 5 | 5.00/5.0 |
| Bruno | 6 | $79,133 | 44 | 4.90/5.0 |
| Yo | 2 | $61,522 | 3 | Not Rated |
| Elke | 2 | $55,133 | 29 | 4.74/5.0 |
| David | 1 | $51,665 | 16 | 4.94/5.0 |
| Tom | 2 | $50,755 | 98 | 4.68/5.0 |
| Fadime | 1 | $39,898 | 3 | 5.00/5.0 |
| Annelies | 1 | $36,212 | 59 | 4.95/5.0 |
| Mersédes | 1 | $28,490 | 4 | 5.00/5.0 |
Analyzing the strategies of top hosts, such as their property selection, pricing, and guest communication, can offer valuable lessons for optimizing your own Airbnb operations in Rumst.
Dive Deeper: Advanced Rumst STR Market Data (2026)
Ready to unlock more insights? AirROI provides access to advanced metrics and comprehensive Airbnb data for Rumst. Explore detailed analytics beyond this report to refine your investment strategy, optimize pricing, and maximize your vacation rental profits.
Explore Advanced MetricsRumst Short-Term Rental Market Composition (2026): Property & Room Types
Room Type Distribution
Property Type Distribution
Market Composition Insights for Rumst
- The Rumst Airbnb market composition is heavily skewed towards Entire Home/Apt listings, which make up 61.5% of the 39 active rentals. This indicates strong guest preference for privacy and space.
- However, a notable 35.9% share for Private Rooms suggests opportunities for budget-conscious travelers or hosts renting out spare rooms.
- Looking at the property type distribution in Rumst, House properties are the most common (56.4%), reflecting the local real estate landscape.
- Houses represent a significant 56.4% portion, catering likely to families or larger groups.
- The presence of 5.1% Hotel/Boutique listings indicates integration with traditional hospitality.
Rumst Airbnb Room Capacity Analysis (2026): Bedroom Distribution
Distribution of Listings by Number of Bedrooms
Room Capacity Insights for Rumst
- The dominant room capacity in Rumst is 2 bedrooms listings, making up 25.6% of the market. This suggests a strong demand for properties suitable for couples or solo travelers.
- Together, 2 bedrooms and 3 bedrooms properties represent 46.1% of the active Airbnb listings in Rumst, indicating a high concentration in these sizes.
- A significant 38.5% of listings offer 3+ bedrooms, catering to larger groups and families seeking more space in Rumst.
Rumst Vacation Rental Guest Capacity Trends (2026)
Distribution of Listings by Guest Capacity
Guest Capacity Insights for Rumst
- The most common guest capacity trend in Rumst vacation rentals is listings accommodating 2 guests (17.9%). This suggests the primary traveler segment is likely couples or solo travelers.
- Properties designed for 2 guests and 6 guests dominate the Rumst STR market, accounting for 33.3% of listings.
- 30.8% of properties accommodate 6+ guests, serving the market segment for larger families or group travel in Rumst.
- On average, properties in Rumst are equipped to host 3.4 guests.
Rumst Airbnb Booking Patterns (2026): Available vs. Booked Days
Available Days Distribution
Booked Days Distribution
Booking Pattern Insights for Rumst
- The most common availability pattern in Rumst falls within the 271-366 days range, representing 84.6% of listings. This suggests many properties have significant open periods on their calendars.
- Approximately 94.9% of listings show high availability (181+ days open annually), indicating potential for increased bookings or specific owner usage patterns.
- For booked days, the 1-30 days range is most frequent in Rumst (43.6%), reflecting common guest stay durations or potential owner blocking patterns.
- A notable 7.7% of properties secure long booking periods (181+ days booked per year), highlighting successful long-term rental strategies or significant owner usage.
Rumst Airbnb Minimum Stay Requirements Analysis
Distribution of Listings by Minimum Night Requirement
1 Night
3 listings
7.7% of total
2 Nights
7 listings
17.9% of total
3 Nights
8 listings
20.5% of total
4-6 Nights
8 listings
20.5% of total
7-29 Nights
1 listings
2.6% of total
30+ Nights
12 listings
30.8% of total
Key Insights
- The most prevalent minimum stay requirement in Rumst is 30+ Nights, adopted by 30.8% of listings. This highlights the market's preference for longer commitments.
- A significant segment (30.8%) caters to monthly stays (30+ nights) in Rumst, pointing to opportunities in the extended-stay market.
Recommendations
- Align with the market by considering a 30+ Nights minimum stay, as 30.8% of Rumst hosts use this setting.
- If feasible, allowing 1-night stays, especially midweek or during low season, could capture last-minute bookings, as only 7.7% currently do.
- Explore offering discounts for stays of 30+ nights to attract the 30.8% of the market seeking extended stays.
- Adjust minimum nights based on seasonality – potentially shorter during low season and longer during peak demand periods in Rumst.
Rumst Airbnb Cancellation Policy Trends Analysis (2026)
Flexible
5 listings
12.8% of total
Moderate
2 listings
5.1% of total
Firm
19 listings
48.7% of total
Strict
13 listings
33.3% of total
Cancellation Policy Insights for Rumst
- The prevailing Airbnb cancellation policy trend in Rumst is Firm, used by 48.7% of listings.
- A majority (82.0%) of hosts in Rumst utilize Firm or Strict policies, indicating a market where hosts prioritize booking security.
Recommendations for Hosts
- Consider adopting a Firm policy to align with the 48.7% market standard in Rumst.
- With 33.3% using Strict terms, this is a viable option in Rumst, particularly for high-value properties or during peak demand periods.
- Regularly review your cancellation policy against competitors and market demand shifts in Rumst.
Rumst STR Booking Lead Time Analysis (2026)
Average Booking Lead Time by Month
Booking Lead Time Insights for Rumst
- The overall average booking lead time for vacation rentals in Rumst is 66 days.
- Guests book furthest in advance for stays during February (average 81 days), likely coinciding with peak travel demand or local events.
- The shortest booking windows occur for stays in November (average 27 days), indicating more last-minute travel plans during this time.
- Seasonally, Summer (69 days avg.) sees the longest lead times, while Fall (47 days avg.) has the shortest, reflecting typical travel planning cycles.
Recommendations for Hosts
- Use the overall average lead time (66 days) as a baseline for your pricing and availability strategy in Rumst.
- For February stays, consider implementing length-of-stay discounts or slightly higher rates for bookings made less than 81 days out to capitalize on advance planning.
- Target marketing efforts for the Summer season well in advance (at least 69 days) to capture early planners.
- Monitor your own booking lead times against these Rumst averages to identify opportunities for dynamic pricing adjustments.
Popular & Essential Airbnb Amenities in Rumst (2026)
Amenity Prevalence
Amenity Insights for Rumst
- Essential amenities in Rumst that guests expect include: Wifi. Lacking these (this) could significantly impact bookings.
- Popular amenities like Smoke alarm, Hot water, Heating are common but not universal. Offering these can provide a competitive edge.
Recommendations for Hosts
- Ensure your listing includes all essential amenities for Rumst: Wifi.
- Consider adding popular differentiators like Smoke alarm or Hot water to increase appeal.
- Highlight unique or less common amenities you offer (e.g., hot tub, dedicated workspace, EV charger) in your listing description and photos.
- Regularly check competitor amenities in Rumst to stay competitive.
Rumst Airbnb Guest Demographics & Profile Analysis (2026)
Guest Profile Summary for Rumst
- The typical guest profile for Airbnb in Rumst consists of predominantly international visitors (88%), with top international origins including Netherlands, typically belonging to the Post-2000s (Gen Z/Alpha) group (50%), primarily speaking English or German.
- Domestic travelers account for 11.8% of guests.
- Key international markets include Germany (18.4%) and Netherlands (14.5%).
- Top languages spoken are English (39.4%) followed by German (14.4%).
- A significant demographic segment is the Post-2000s (Gen Z/Alpha) group, representing 50% of guests.
Recommendations for Hosts
- Focus marketing internationally, particularly towards travelers from Netherlands.
- Tailor amenities and listing descriptions to appeal to the dominant Post-2000s (Gen Z/Alpha) demographic (e.g., highlight fast WiFi, smart home features, local guides).
- Highlight unique local experiences or amenities relevant to the primary guest profile.
- Consider seasonal promotions aligned with peak travel times for key origin markets.
Nearby Short-Term Rental Market Comparison
How does the Rumst Airbnb market stack up against its neighbors? Compare key performance metrics like average monthly revenue, ADR, and occupancy rates in surrounding areas to understand the broader regional STR landscape.
| Market | Active Properties | Monthly Revenue | Daily Rate | Avg. Occupancy |
|---|---|---|---|---|
| Raamsdonksveer | 16 | $7,756 | $736.17 | 38% |
| Kockengen | 11 | $6,027 | $485.77 | 53% |
| Haghorst | 11 | $5,995 | $480.40 | 40% |
| Mont-de-l'Enclus | 10 | $5,398 | $407.81 | 36% |
| Merksplas | 12 | $5,367 | $356.64 | 43% |
| Zerkegem | 10 | $4,846 | $437.71 | 57% |
| Bentveld | 15 | $4,727 | $517.02 | 50% |
| Anzegem | 10 | $4,425 | $460.61 | 35% |
| Incourt | 13 | $4,412 | $303.48 | 52% |
| Wellin | 12 | $4,365 | $446.64 | 42% |