Sint-Laureins Airbnb Market Analysis 2025: Short Term Rental Data & Vacation Rental Statistics in East Flanders, Belgium
Is Airbnb profitable in Sint-Laureins in 2025? Explore comprehensive Airbnb analytics for Sint-Laureins, East Flanders, Belgium to uncover income potential. This 2025 STR market report for Sint-Laureins, based on AirROI data from June 2024 to May 2025, reveals key trends in the niche market of 19 active listings.
Whether you're considering an Airbnb investment in Sint-Laureins, optimizing your existing vacation rental, or exploring rental arbitrage opportunities, understanding the Sint-Laureins Airbnb data is crucial. Navigating the high regulation landscape is key to maximizing your short term rental income potential. Let's dive into the specifics.
Key Sint-Laureins Airbnb Performance Metrics Overview
Monthly Airbnb Revenue Variations & Income Potential in Sint-Laureins (2025)
Understanding the monthly revenue variations for Airbnb listings in Sint-Laureins is key to maximizing your short term rental income potential. Seasonality significantly impacts earnings. Our analysis, based on data from the past 12 months, shows that the peak revenue month for STRs in Sint-Laureins is typically August, while June often presents the lowest earnings, highlighting opportunities for strategic pricing adjustments during shoulder and low seasons. Explore the typical Airbnb income in Sint-Laureins across different performance tiers:
- Best-in-class properties (Top 10%) achieve $5,031+ monthly, often utilizing dynamic pricing and superior guest experiences.
- Strong performing properties (Top 25%) earn $3,389 or more, indicating effective management and desirable locations/amenities.
- Typical properties (Median) generate around $1,698 per month, representing the average market performance.
- Entry-level properties (Bottom 25%) see earnings around $963, often with potential for optimization.
Average Monthly Airbnb Earnings Trend in Sint-Laureins
Sint-Laureins Airbnb Occupancy Rate Trends (2025)
Maximize your bookings by understanding the Sint-Laureins STR occupancy trends. Seasonal demand shifts significantly influence how often properties are booked. Typically, Augustsees the highest demand (peak season occupancy), while November experiences the lowest (low season). Effective strategies, like adjusting minimum stays or offering promotions, can boost occupancy during slower periods. Here's how different property tiers perform in Sint-Laureins:
- Best-in-class properties (Top 10%) achieve 80%+ occupancy, indicating high desirability and potentially optimized availability.
- Strong performing properties (Top 25%) maintain 60% or higher occupancy, suggesting good market fit and guest satisfaction.
- Typical properties (Median) have an occupancy rate around 41%.
- Entry-level properties (Bottom 25%) average 25% occupancy, potentially facing higher vacancy.
Average Monthly Occupancy Rate Trend in Sint-Laureins
Average Daily Rate (ADR) Airbnb Trends in Sint-Laureins (2025)
Effective short term rental pricing strategy in Sint-Laureins involves understanding monthly ADR fluctuations. The Average Daily Rate (ADR) for Airbnb in Sint-Laureins typically peaks in May and dips lowest during June. Leveraging Airbnb dynamic pricing tools or strategies based on this seasonality can significantly boost revenue. Here's a look at the typical nightly rates achieved:
- Best-in-class properties (Top 10%) command rates of $312+ per night, often due to premium features or locations.
- Strong performing properties (Top 25%) achieve nightly rates of $215 or more.
- Typical properties (Median) charge around $147 per night.
- Entry-level properties (Bottom 25%) earn around $110 per night.
Average Daily Rate (ADR) Trend by Month in Sint-Laureins
Get Live Sint-Laureins Market Intelligence 👇

Explore Real-time Analytics
Airbnb Seasonality Analysis & Trends in Sint-Laureins (2025)
Peak Season (August, July, January)
- Revenue averages $2,919 per month
- Occupancy rates average 57.3%
- Daily rates average $179
Shoulder Season
- Revenue averages $2,402 per month
- Occupancy maintains around 42.7%
- Daily rates hold near $186
Low Season (May, June, November)
- Revenue drops to average $1,914 per month
- Occupancy decreases to average 35.1%
- Daily rates adjust to average $180
Seasonality Insights for Sint-Laureins
- The Airbnb seasonality in Sint-Laureins shows moderate seasonality with distinct peak and low periods. While the sections above show seasonal averages, it's also insightful to look at the extremes:
- During the high season, the absolute peak month showcases Sint-Laureins's highest earning potential, with monthly revenues capable of climbing to $3,224, occupancy reaching a high of 69.1%, and ADRs peaking at $213.
- Conversely, the slowest single month of the year, typically falling within the low season, marks the market's lowest point. In this month, revenue might dip to $1,591, occupancy could drop to 34.1%, and ADRs may adjust down to $162.
- Understanding both the seasonal averages and these monthly peaks and troughs in revenue, occupancy, and ADR is crucial for maximizing your Airbnb profit potential in Sint-Laureins.
Seasonal Strategies for Maximizing Profit
- Peak Season: Maximize revenue through premium pricing and potentially longer minimum stays. Ensure high availability.
- Low Season: Offer competitive pricing, special promotions (e.g., extended stay discounts), and flexible cancellation policies. Target off-season travelers like remote workers or budget-conscious guests.
- Shoulder Seasons: Implement dynamic pricing that balances peak and low rates. Target weekend travelers or specific events. Offer slightly more flexible terms than peak season.
- Regularly analyze your own performance against these Sint-Laureins seasonality benchmarks and adjust your pricing and availability strategy accordingly.
Best Areas for Airbnb Investment in Sint-Laureins (2025)
Exploring the top neighborhoods for short-term rentals in Sint-Laureins? This section highlights key areas, outlining why they are attractive for hosts and guests, along with notable local attractions. Consider these locations based on your target guest profile and investment strategy.
| Neighborhood / Area | Why Host Here? (Target Guests & Appeal) | Key Attractions & Landmarks |
|---|---|---|
| Landschap De Dierte | A picturesque natural reserve in Sint-Laureins, perfect for nature lovers and outdoor activities. It attracts visitors looking for tranquility and scenic views, making it excellent for a relaxing getaway. | Birdwatching, Hiking trails, Fishing spots, Scenic walks |
| Sint-Laureins Center | The charming town center with local shops and eateries. It's a great spot for guests who want to experience local culture and community life while being close to major attractions in the region. | Local restaurants, Weekly markets, Saint Martin's Church |
| Meetjesland | This region is known for its beautiful landscapes, cycling routes, and heritage sites. Ideal for guests interested in countryside enjoyment and outdoor adventures. | Cycling routes, Historical sites, Natural parks |
| Damme | Damme is a historic town near Sint-Laureins, known for its rich history and beautiful canals. It attracts history buffs and those looking for a serene environment with beautiful architecture. | Damme Canal, Historic buildings, Books and publishers |
| Oostkamp | A nearby town with a quaint feel and access to larger cities like Bruges. Great for tourists who want a peaceful stay while having easy access to vibrant city life. | Local markets, Cycling paths, Parks |
| Bruges | While not in Sint-Laureins, Bruges is very close and is one of Belgium's top tourist destinations, making it a prime spot for Airbnb hosting due to high tourist traffic. | Bruges canals, Markt square, Historic city center |
| Ghent | Ghent is a vibrant city known for its art, culture, and history. Just a short drive from Sint-Laureins, it's a fantastic option for attracting a diverse range of guests. | Gravensteen Castle, St. Bavo's Cathedral, Korenlei along the river |
| Eeklo | A medium-sized town nearby that offers a mix of local culture and modern amenities. Ideal for guests looking for a more urban experience while being able to explore the countryside as well. | Eeklo Market, Museum van Eeklo, Parks |
Understanding Airbnb License Requirements & STR Laws in Sint-Laureins (2025)
Yes, Sint-Laureins, East Flanders, Belgium enforces high STR regulations. Obtaining a license and ensuring compliance is almost certainly required according to current 2025 STR laws. Always verify the latest short term rental regulations and Airbnb license requirements directly with local government authorities for Sint-Laureins to ensure full compliance before hosting.
(Source: AirROI data, 2025, based on 32% licensed listings)
Top Performing Airbnb Properties in Sint-Laureins (2025)
Benchmark your potential! Explore examples of top-performing Airbnb properties in Sint-Laureinsbased on Trailing Twelve Month (TTM) revenue. Analyze their characteristics, revenue, occupancy rate, and ADR to understand what drives success in this market.
Holiday home Zente
Entire Place • 3 bedrooms

Country house 'Cleylantshof' max. 8 people
Entire Place • 3 bedrooms
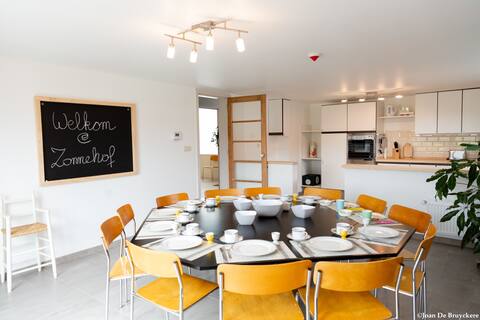
Zonnehof: Welcome to the Meetjeslandse Polders
Entire Place • 5 bedrooms

Huisje Nummer 10 - between Sea/Bruges/Ghent
Entire Place • 3 bedrooms

Stil 1827 - Exclusive Slow Living Retreat
Entire Place • 4 bedrooms

Modern holiday home near Zeeuws-Vlaanderen
Entire Place • 3 bedrooms
Note: Performance varies based on location, size, amenities, seasonality, and management quality. Data reflects the past 12 months.
Top Performing Airbnb Hosts in Sint-Laureins (2025)
Learn from the best! This table showcases top-performing Airbnb hosts in Sint-Laureins based on the number of properties managed and estimated total revenue over the past year. Analyze their scale and performance metrics.
| Host Name | Properties | Grossing Revenue | Stay Reviews | Avg Rating |
|---|---|---|---|---|
| Dries | 5 | $109,702 | 171 | 4.95/5.0 |
| Bart | 1 | $69,563 | 43 | 4.98/5.0 |
| Sara | 2 | $50,786 | 39 | 4.92/5.0 |
| Filip & Annelies | 1 | $46,114 | 111 | 4.89/5.0 |
| Miguel & Eve | 1 | $45,182 | 31 | 4.68/5.0 |
| Jos | 1 | $22,954 | 86 | 4.71/5.0 |
| Maarten | 1 | $20,472 | 68 | 4.68/5.0 |
| Bart | 1 | $20,155 | 19 | 5.00/5.0 |
| Sonia | 1 | $19,271 | 72 | 4.90/5.0 |
| Ben | 1 | $18,725 | 112 | 4.97/5.0 |
Analyzing the strategies of top hosts, such as their property selection, pricing, and guest communication, can offer valuable lessons for optimizing your own Airbnb operations in Sint-Laureins.
Dive Deeper: Advanced Sint-Laureins STR Market Data (2025)
Ready to unlock more insights? AirROI provides access to advanced metrics and comprehensive Airbnb data for Sint-Laureins. Explore detailed analytics beyond this report to refine your investment strategy, optimize pricing, and maximize your vacation rental profits.
Explore Advanced MetricsSint-Laureins Short-Term Rental Market Composition (2025): Property & Room Types
Room Type Distribution
Property Type Distribution
Market Composition Insights for Sint-Laureins
- The Sint-Laureins Airbnb market composition is heavily skewed towards Entire Home/Apt listings, which make up 84.2% of the 19 active rentals. This indicates strong guest preference for privacy and space.
- Looking at the property type distribution in Sint-Laureins, House properties are the most common (78.9%), reflecting the local real estate landscape.
- Houses represent a significant 78.9% portion, catering likely to families or larger groups.
- The presence of 15.8% Hotel/Boutique listings indicates integration with traditional hospitality.
Sint-Laureins Airbnb Room Capacity Analysis (2025): Bedroom Distribution
Distribution of Listings by Number of Bedrooms
Room Capacity Insights for Sint-Laureins
- The dominant room capacity in Sint-Laureins is 3 bedrooms listings, making up 36.8% of the market. This suggests a strong demand for properties suitable for families or small groups.
- Together, 3 bedrooms and 2 bedrooms properties represent 57.9% of the active Airbnb listings in Sint-Laureins, indicating a high concentration in these sizes.
- A significant 57.9% of listings offer 3+ bedrooms, catering to larger groups and families seeking more space in Sint-Laureins.
Sint-Laureins Vacation Rental Guest Capacity Trends (2025)
Distribution of Listings by Guest Capacity
Guest Capacity Insights for Sint-Laureins
- The most common guest capacity trend in Sint-Laureins vacation rentals is listings accommodating 6 guests (36.8%). This suggests the primary traveler segment is likely larger groups.
- Properties designed for 6 guests and 4 guests dominate the Sint-Laureins STR market, accounting for 57.9% of listings.
- 57.9% of properties accommodate 6+ guests, serving the market segment for larger families or group travel in Sint-Laureins.
- On average, properties in Sint-Laureins are equipped to host 5.1 guests.
Sint-Laureins Airbnb Booking Patterns (2025): Available vs. Booked Days
Available Days Distribution
Booked Days Distribution
Booking Pattern Insights for Sint-Laureins
- The most common availability pattern in Sint-Laureins falls within the 271-366 days range, representing 52.6% of listings. This suggests many properties have significant open periods on their calendars.
- Approximately 63.1% of listings show high availability (181+ days open annually), indicating potential for increased bookings or specific owner usage patterns.
- For booked days, the 31-90 days range is most frequent in Sint-Laureins (36.8%), reflecting common guest stay durations or potential owner blocking patterns.
- A notable 36.8% of properties secure long booking periods (181+ days booked per year), highlighting successful long-term rental strategies or significant owner usage.
Sint-Laureins Airbnb Minimum Stay Requirements Analysis
Distribution of Listings by Minimum Night Requirement
1 Night
2 listings
10.5% of total
2 Nights
5 listings
26.3% of total
3 Nights
4 listings
21.1% of total
4-6 Nights
1 listings
5.3% of total
30+ Nights
7 listings
36.8% of total
Key Insights
- The most prevalent minimum stay requirement in Sint-Laureins is 30+ Nights, adopted by 36.8% of listings. This highlights the market's preference for longer commitments.
- A significant segment (36.8%) caters to monthly stays (30+ nights) in Sint-Laureins, pointing to opportunities in the extended-stay market.
Recommendations
- Align with the market by considering a 30+ Nights minimum stay, as 36.8% of Sint-Laureins hosts use this setting.
- If feasible, allowing 1-night stays, especially midweek or during low season, could capture last-minute bookings, as only 10.5% currently do.
- Explore offering discounts for stays of 30+ nights to attract the 36.8% of the market seeking extended stays.
- Adjust minimum nights based on seasonality – potentially shorter during low season and longer during peak demand periods in Sint-Laureins.
Sint-Laureins Airbnb Cancellation Policy Trends Analysis (2025)
Flexible
8 listings
42.1% of total
Moderate
4 listings
21.1% of total
Firm
4 listings
21.1% of total
Strict
3 listings
15.8% of total
Cancellation Policy Insights for Sint-Laureins
- The prevailing Airbnb cancellation policy trend in Sint-Laureins is Flexible, used by 42.1% of listings.
- There's a relatively balanced mix between guest-friendly (63.2%) and stricter (36.9%) policies, offering choices for different guest needs.
Recommendations for Hosts
- Consider adopting a Flexible policy to align with the 42.1% market standard in Sint-Laureins.
- Regularly review your cancellation policy against competitors and market demand shifts in Sint-Laureins.
Sint-Laureins STR Booking Lead Time Analysis (2025)
Average Booking Lead Time by Month
Booking Lead Time Insights for Sint-Laureins
- The overall average booking lead time for vacation rentals in Sint-Laureins is 61 days.
- Guests book furthest in advance for stays during August (average 108 days), likely coinciding with peak travel demand or local events.
- The shortest booking windows occur for stays in January (average 32 days), indicating more last-minute travel plans during this time.
- Seasonally, Summer (95 days avg.) sees the longest lead times, while Winter (52 days avg.) has the shortest, reflecting typical travel planning cycles.
Recommendations for Hosts
- Use the overall average lead time (61 days) as a baseline for your pricing and availability strategy in Sint-Laureins.
- For August stays, consider implementing length-of-stay discounts or slightly higher rates for bookings made less than 108 days out to capitalize on advance planning.
- Target marketing efforts for the Summer season well in advance (at least 95 days) to capture early planners.
- Monitor your own booking lead times against these Sint-Laureins averages to identify opportunities for dynamic pricing adjustments.
Popular & Essential Airbnb Amenities in Sint-Laureins (2025)
Amenity Prevalence
Amenity Insights for Sint-Laureins
- Essential amenities in Sint-Laureins that guests expect include: Free parking on premises, Wifi, Smoke alarm, Kitchen. Lacking these (any) could significantly impact bookings.
- Popular amenities like Hot water, Essentials, Heating are common but not universal. Offering these can provide a competitive edge.
Recommendations for Hosts
- Ensure your listing includes all essential amenities for Sint-Laureins: Free parking on premises, Wifi, Smoke alarm, Kitchen.
- Consider adding popular differentiators like Hot water or Essentials to increase appeal.
- Highlight unique or less common amenities you offer (e.g., hot tub, dedicated workspace, EV charger) in your listing description and photos.
- Regularly check competitor amenities in Sint-Laureins to stay competitive.
Sint-Laureins Airbnb Guest Demographics & Profile Analysis (2025)
Guest Profile Summary for Sint-Laureins
- The typical guest profile for Airbnb in Sint-Laureins consists of predominantly international visitors (70%), with top international origins including Germany, typically belonging to the Post-2000s (Gen Z/Alpha) group (50%), primarily speaking English or German.
- Domestic travelers account for 29.6% of guests.
- Key international markets include Belgium (29.6%) and Germany (21.5%).
- Top languages spoken are English (37.9%) followed by German (17.6%).
- A significant demographic segment is the Post-2000s (Gen Z/Alpha) group, representing 50% of guests.
Recommendations for Hosts
- Focus marketing internationally, particularly towards travelers from Germany.
- Tailor amenities and listing descriptions to appeal to the dominant Post-2000s (Gen Z/Alpha) demographic (e.g., highlight fast WiFi, smart home features, local guides).
- Highlight unique local experiences or amenities relevant to the primary guest profile.
- Consider seasonal promotions aligned with peak travel times for key origin markets.
Nearby Short-Term Rental Market Comparison
How does the Sint-Laureins Airbnb market stack up against its neighbors? Compare key performance metrics like average monthly revenue, ADR, and occupancy rates in surrounding areas to understand the broader regional STR landscape.
| Market | Active Properties | Monthly Revenue | Daily Rate | Avg. Occupancy |
|---|---|---|---|---|
| Kockengen | 11 | $6,955 | $451.23 | 63% |
| Mont-de-l'Enclus | 10 | $5,756 | $378.03 | 42% |
| Bentveld | 13 | $5,409 | $461.67 | 56% |
| Merksplas | 13 | $4,776 | $309.15 | 41% |
| Lo-Reninge | 16 | $4,729 | $435.11 | 40% |
| Dion | 12 | $4,720 | $274.00 | 58% |
| Jemeppe-sur-Sambre | 10 | $4,334 | $483.43 | 45% |
| Raamsdonksveer | 15 | $3,962 | $497.14 | 40% |
| Aerdenhout | 19 | $3,907 | $651.91 | 49% |
| Oud Ade | 17 | $3,879 | $284.15 | 54% |