Halle Airbnb Market Analysis 2026: Short Term Rental Data & Vacation Rental Statistics in Flemish Brabant, Belgium
Is Airbnb profitable in Halle in 2026? Explore comprehensive Airbnb analytics for Halle, Flemish Brabant, Belgium to uncover income potential. This 2026 STR market report for Halle, based on AirROI data from January 2025 to December 2025, reveals key trends in the niche market of 19 active listings.
Whether you're considering an Airbnb investment in Halle, optimizing your existing vacation rental, or exploring rental arbitrage opportunities, understanding the Halle Airbnb data is crucial. Leveraging the low regulation environment is key to maximizing your short term rental income potential. Let's dive into the specifics.
Key Halle Airbnb Performance Metrics Overview
Monthly Airbnb Revenue Variations & Income Potential in Halle (2026)
Understanding the monthly revenue variations for Airbnb listings in Halle is key to maximizing your short term rental income potential. Seasonality significantly impacts earnings. Our analysis, based on data from the past 12 months, shows that the peak revenue month for STRs in Halle is typically June, while February often presents the lowest earnings, highlighting opportunities for strategic pricing adjustments during shoulder and low seasons. Explore the typical Airbnb income in Halle across different performance tiers:
- Best-in-class properties (Top 10%) achieve $9,083+ monthly, often utilizing dynamic pricing and superior guest experiences.
- Strong performing properties (Top 25%) earn $2,947 or more, indicating effective management and desirable locations/amenities.
- Typical properties (Median) generate around $1,374 per month, representing the average market performance.
- Entry-level properties (Bottom 25%) see earnings around $614, often with potential for optimization.
Average Monthly Airbnb Earnings Trend in Halle
Halle Airbnb Occupancy Rate Trends (2026)
Maximize your bookings by understanding the Halle STR occupancy trends. Seasonal demand shifts significantly influence how often properties are booked. Typically, Junesees the highest demand (peak season occupancy), while September experiences the lowest (low season). Effective strategies, like adjusting minimum stays or offering promotions, can boost occupancy during slower periods. Here's how different property tiers perform in Halle:
- Best-in-class properties (Top 10%) achieve 82%+ occupancy, indicating high desirability and potentially optimized availability.
- Strong performing properties (Top 25%) maintain 59% or higher occupancy, suggesting good market fit and guest satisfaction.
- Typical properties (Median) have an occupancy rate around 34%.
- Entry-level properties (Bottom 25%) average 18% occupancy, potentially facing higher vacancy.
Average Monthly Occupancy Rate Trend in Halle
Average Daily Rate (ADR) Airbnb Trends in Halle (2026)
Effective short term rental pricing strategy in Halle involves understanding monthly ADR fluctuations. The Average Daily Rate (ADR) for Airbnb in Halle typically peaks in December and dips lowest during March. Leveraging Airbnb dynamic pricing tools or strategies based on this seasonality can significantly boost revenue. Here's a look at the typical nightly rates achieved:
- Best-in-class properties (Top 10%) command rates of $365+ per night, often due to premium features or locations.
- Strong performing properties (Top 25%) achieve nightly rates of $196 or more.
- Typical properties (Median) charge around $127 per night.
- Entry-level properties (Bottom 25%) earn around $86 per night.
Average Daily Rate (ADR) Trend by Month in Halle
Get Live Halle Market Intelligence 👇

Explore Real-time Analytics
Airbnb Seasonality Analysis & Trends in Halle (2025)
Peak Season (June, October, December)
- Revenue averages $4,454 per month
- Occupancy rates average 42.1%
- Daily rates average $211
Shoulder Season
- Revenue averages $2,951 per month
- Occupancy maintains around 39.8%
- Daily rates hold near $197
Low Season (January, February, March)
- Revenue drops to average $1,484 per month
- Occupancy decreases to average 41.5%
- Daily rates adjust to average $171
Seasonality Insights for Halle
- The Airbnb seasonality in Halle shows highly seasonal trends requiring careful strategy. While the sections above show seasonal averages, it's also insightful to look at the extremes:
- During the high season, the absolute peak month showcases Halle's highest earning potential, with monthly revenues capable of climbing to $4,876, occupancy reaching a high of 48.3%, and ADRs peaking at $224.
- Conversely, the slowest single month of the year, typically falling within the low season, marks the market's lowest point. In this month, revenue might dip to $1,027, occupancy could drop to 28.9%, and ADRs may adjust down to $170.
- Understanding both the seasonal averages and these monthly peaks and troughs in revenue, occupancy, and ADR is crucial for maximizing your Airbnb profit potential in Halle.
Seasonal Strategies for Maximizing Profit
- Peak Season: Maximize revenue through premium pricing and potentially longer minimum stays. Ensure high availability.
- Low Season: Offer competitive pricing, special promotions (e.g., extended stay discounts), and flexible cancellation policies. Target off-season travelers like remote workers or budget-conscious guests.
- Shoulder Seasons: Implement dynamic pricing that balances peak and low rates. Target weekend travelers or specific events. Offer slightly more flexible terms than peak season.
- Regularly analyze your own performance against these Halle seasonality benchmarks and adjust your pricing and availability strategy accordingly.
Best Areas for Airbnb Investment in Halle (2026)
Exploring the top neighborhoods for short-term rentals in Halle? This section highlights key areas, outlining why they are attractive for hosts and guests, along with notable local attractions. Consider these locations based on your target guest profile and investment strategy.
| Neighborhood / Area | Why Host Here? (Target Guests & Appeal) | Key Attractions & Landmarks |
|---|---|---|
| Halle City Center | The bustling heart of Halle, offering a mix of local shops, cafes, and cultural attractions. Ideal for visitors wanting to explore the city's vibrant life and attend local events. | Halle Market Square, Halle St. Martin's Church, The Provincial Archives of Flemish Brabant, The Halle Museum of Art, Cultural events at the town square |
| Zonien Forest | A beautiful natural area just outside Halle, perfect for nature lovers and outdoor enthusiasts. Attracts visitors looking to hike, bike, and enjoy the tranquility of the forest. | Zoniënwoud, Cycling and walking trails, Picnic areas, Nature observatories, Wildlife watching |
| Halle Train Station | Strategically located for travelers coming to and from Brussels and other major cities. A great spot for business travelers and tourists needing easy transport links. | Direct trains to Brussels, Nearby restaurants and cafes, Accessibility to local attractions, Public transport links |
| Blanden | A quiet residential area with picturesque landscapes, appealing to families and those seeking a peaceful stay. Close to parks and local charm. | Green parks, Local restaurants, Community events, Peaceful walking paths |
| Hekelgem | A quaint neighborhood with a village feel, attracting visitors who wish to experience local life in a serene environment, ideal for family stays. | Hekelgem Village, Local shops, Surrounding nature, Community activities |
| Sint-Pieters-Leeuw | A nearby town with its own attractions, offering a suburban experience with easy access to Halle. Great for those wanting a quieter stay while visiting Halle. | Park of Leeuw, Local historical sites, Small-town events, Community markets |
| Kasteel van Beersel | Near Halle, this historic castle attracts tourists interested in history and architecture, perfect for cultural tourism. | Beersel Castle, Guided tours, Historical reenactments, Scenic views |
| Drogenbos | A charming suburb that's close to both nature and urban amenities, attracting visitors who appreciate a mix of city and countryside. | Local parks, Drogenbos Chapel, Cafes and restaurants, Community parks |
Understanding Airbnb License Requirements & STR Laws in Halle (2026)
While Halle, Flemish Brabant, Belgium currently shows low STR regulations, specific Airbnb license requirements might still exist or change. Always verify the latest short term rental regulations and Airbnb license requirements directly with local government authorities for Halle to ensure full compliance before hosting.
(Source: AirROI data, 2026, finding no licensed listings among those analyzed)
Top Performing Airbnb Properties in Halle (2026)
Benchmark your potential! Explore examples of top-performing Airbnb properties in Hallebased on Trailing Twelve Month (TTM) revenue. Analyze their characteristics, revenue, occupancy rate, and ADR to understand what drives success in this market.

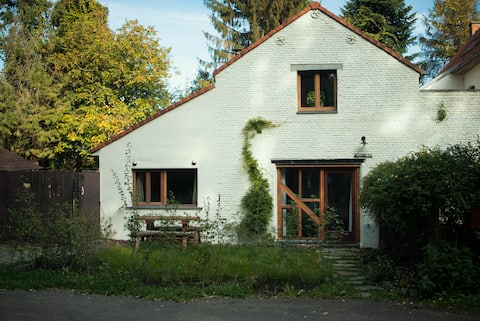
FlemisHome Spacious Stay Near Brussels
Entire Place • 5 bedrooms

Luxury Villa • Pool & Spa
Entire Place • 8 bedrooms

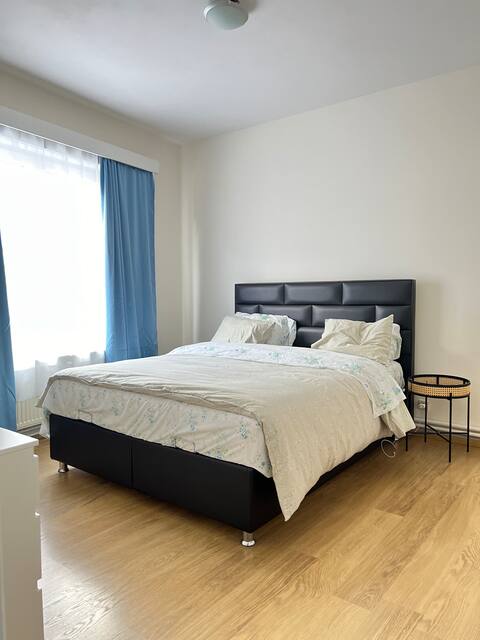
Large apartment near the center
Entire Place • 3 bedrooms

Cozy vacation home in a quiet corner of Halle
Entire Place • 1 bedroom
Het Bosnest, a holiday home at the Hallerbos
Entire Place • 2 bedrooms
Appartement
Entire Place • 1 bedroom
Note: Performance varies based on location, size, amenities, seasonality, and management quality. Data reflects the past 12 months.
Top Performing Airbnb Hosts in Halle (2026)
Learn from the best! This table showcases top-performing Airbnb hosts in Halle based on the number of properties managed and estimated total revenue over the past year. Analyze their scale and performance metrics.
| Host Name | Properties | Grossing Revenue | Stay Reviews | Avg Rating |
|---|---|---|---|---|
| Yunting | 1 | $155,968 | 182 | 4.80/5.0 |
| Harutyun | 1 | $78,462 | 9 | 4.89/5.0 |
| Laura | 1 | $30,420 | 20 | 4.90/5.0 |
| Anne & Jan | 1 | $28,997 | 103 | 4.94/5.0 |
| Bart | 1 | $22,056 | 18 | 4.78/5.0 |
| Solange | 1 | $17,104 | 21 | 4.71/5.0 |
| Larissa | 2 | $16,392 | 96 | 4.07/5.0 |
| Host #490289614 | 3 | $16,188 | 5 | 5.00/5.0 |
| Ruhumuza | 1 | $15,880 | 5 | 4.80/5.0 |
| Chanelle | 1 | $14,715 | 10 | 4.80/5.0 |
Analyzing the strategies of top hosts, such as their property selection, pricing, and guest communication, can offer valuable lessons for optimizing your own Airbnb operations in Halle.
Dive Deeper: Advanced Halle STR Market Data (2026)
Ready to unlock more insights? AirROI provides access to advanced metrics and comprehensive Airbnb data for Halle. Explore detailed analytics beyond this report to refine your investment strategy, optimize pricing, and maximize your vacation rental profits.
Explore Advanced MetricsHalle Short-Term Rental Market Composition (2026): Property & Room Types
Room Type Distribution
Property Type Distribution
Market Composition Insights for Halle
- The Halle Airbnb market composition is heavily skewed towards Entire Home/Apt listings, which make up 73.7% of the 19 active rentals. This indicates strong guest preference for privacy and space.
- Looking at the property type distribution in Halle, Apartment/Condo properties are the most common (47.4%), reflecting the local real estate landscape.
- Houses represent a significant 36.8% portion, catering likely to families or larger groups.
- The presence of 15.8% Hotel/Boutique listings indicates integration with traditional hospitality.
Halle Airbnb Room Capacity Analysis (2026): Bedroom Distribution
Distribution of Listings by Number of Bedrooms
Room Capacity Insights for Halle
- The dominant room capacity in Halle is 1 bedroom listings, making up 36.8% of the market. This suggests a strong demand for properties suitable for couples or solo travelers.
- Together, 1 bedroom and 2 bedrooms properties represent 63.1% of the active Airbnb listings in Halle, indicating a high concentration in these sizes.
- A significant 21.0% of listings offer 3+ bedrooms, catering to larger groups and families seeking more space in Halle.
Halle Vacation Rental Guest Capacity Trends (2026)
Distribution of Listings by Guest Capacity
Guest Capacity Insights for Halle
- The most common guest capacity trend in Halle vacation rentals is listings accommodating 4 guests (36.8%). This suggests the primary traveler segment is likely small families or groups.
- Properties designed for 4 guests and 2 guests dominate the Halle STR market, accounting for 63.1% of listings.
- 21.0% of properties accommodate 6+ guests, serving the market segment for larger families or group travel in Halle.
- On average, properties in Halle are equipped to host 3.7 guests.
Halle Airbnb Booking Patterns (2026): Available vs. Booked Days
Available Days Distribution
Booked Days Distribution
Booking Pattern Insights for Halle
- The most common availability pattern in Halle falls within the 271-366 days range, representing 52.6% of listings. This suggests many properties have significant open periods on their calendars.
- Approximately 94.7% of listings show high availability (181+ days open annually), indicating potential for increased bookings or specific owner usage patterns.
- For booked days, the 91-180 days range is most frequent in Halle (36.8%), reflecting common guest stay durations or potential owner blocking patterns.
- A notable 10.6% of properties secure long booking periods (181+ days booked per year), highlighting successful long-term rental strategies or significant owner usage.
Halle Airbnb Minimum Stay Requirements Analysis
Distribution of Listings by Minimum Night Requirement
1 Night
1 listings
6.3% of total
2 Nights
2 listings
12.5% of total
3 Nights
2 listings
12.5% of total
4-6 Nights
2 listings
12.5% of total
7-29 Nights
1 listings
6.3% of total
30+ Nights
8 listings
50% of total
Key Insights
- The most prevalent minimum stay requirement in Halle is 30+ Nights, adopted by 50% of listings. This highlights the market's preference for longer commitments.
- Very short stays (1-2 nights) are less common (18.8%), suggesting hosts prefer slightly longer bookings to optimize turnover.
- A significant segment (50%) caters to monthly stays (30+ nights) in Halle, pointing to opportunities in the extended-stay market.
Recommendations
- Align with the market by considering a 30+ Nights minimum stay, as 50% of Halle hosts use this setting.
- If feasible, allowing 1-night stays, especially midweek or during low season, could capture last-minute bookings, as only 6.3% currently do.
- Explore offering discounts for stays of 30+ nights to attract the 50% of the market seeking extended stays.
- Adjust minimum nights based on seasonality – potentially shorter during low season and longer during peak demand periods in Halle.
Halle Airbnb Cancellation Policy Trends Analysis (2026)
Flexible
4 listings
25% of total
Moderate
10 listings
62.5% of total
Firm
2 listings
12.5% of total
Cancellation Policy Insights for Halle
- The prevailing Airbnb cancellation policy trend in Halle is Moderate, used by 62.5% of listings.
- The market strongly favors guest-friendly terms, with 87.5% of listings offering Flexible or Moderate policies. This suggests guests in Halle may expect booking flexibility.
Recommendations for Hosts
- Consider adopting a Moderate policy to align with the 62.5% market standard in Halle.
- Regularly review your cancellation policy against competitors and market demand shifts in Halle.
Halle STR Booking Lead Time Analysis (2026)
Average Booking Lead Time by Month
Booking Lead Time Insights for Halle
- The overall average booking lead time for vacation rentals in Halle is 86 days.
- Guests book furthest in advance for stays during June (average 120 days), likely coinciding with peak travel demand or local events.
- The shortest booking windows occur for stays in January (average 12 days), indicating more last-minute travel plans during this time.
- Seasonally, Summer (90 days avg.) sees the longest lead times, while Winter (46 days avg.) has the shortest, reflecting typical travel planning cycles.
Recommendations for Hosts
- Use the overall average lead time (86 days) as a baseline for your pricing and availability strategy in Halle.
- For June stays, consider implementing length-of-stay discounts or slightly higher rates for bookings made less than 120 days out to capitalize on advance planning.
- During January, focus on last-minute booking availability and promotions, as guests book with very short notice (12 days avg.).
- Target marketing efforts for the Summer season well in advance (at least 90 days) to capture early planners.
- Monitor your own booking lead times against these Halle averages to identify opportunities for dynamic pricing adjustments.
Popular & Essential Airbnb Amenities in Halle (2026)
Amenity Prevalence
Amenity Insights for Halle
- Essential amenities in Halle that guests expect include: Wifi. Lacking these (this) could significantly impact bookings.
- Popular amenities like Heating, Hot water, Kitchen are common but not universal. Offering these can provide a competitive edge.
Recommendations for Hosts
- Ensure your listing includes all essential amenities for Halle: Wifi.
- Consider adding popular differentiators like Heating or Hot water to increase appeal.
- Highlight unique or less common amenities you offer (e.g., hot tub, dedicated workspace, EV charger) in your listing description and photos.
- Regularly check competitor amenities in Halle to stay competitive.
Halle Airbnb Guest Demographics & Profile Analysis (2026)
Guest Profile Summary for Halle
- The typical guest profile for Airbnb in Halle consists of predominantly international visitors (75%), with top international origins including France, typically belonging to the Post-2000s (Gen Z/Alpha) group (50%), primarily speaking English or French.
- Domestic travelers account for 25.0% of guests.
- Key international markets include Belgium (25%) and France (15.9%).
- Top languages spoken are English (35.8%) followed by French (18.9%).
- A significant demographic segment is the Post-2000s (Gen Z/Alpha) group, representing 50% of guests.
Recommendations for Hosts
- Focus marketing internationally, particularly towards travelers from France.
- Tailor amenities and listing descriptions to appeal to the dominant Post-2000s (Gen Z/Alpha) demographic (e.g., highlight fast WiFi, smart home features, local guides).
- Highlight unique local experiences or amenities relevant to the primary guest profile.
- Consider seasonal promotions aligned with peak travel times for key origin markets.
Nearby Short-Term Rental Market Comparison
How does the Halle Airbnb market stack up against its neighbors? Compare key performance metrics like average monthly revenue, ADR, and occupancy rates in surrounding areas to understand the broader regional STR landscape.
| Market | Active Properties | Monthly Revenue | Daily Rate | Avg. Occupancy |
|---|---|---|---|---|
| Raamsdonksveer | 16 | $7,996 | $736.98 | 40% |
| Haghorst | 11 | $6,275 | $467.13 | 43% |
| Merksplas | 12 | $5,977 | $357.51 | 44% |
| Mont-de-l'Enclus | 11 | $5,774 | $389.06 | 39% |
| Zerkegem | 10 | $4,741 | $432.70 | 56% |
| Anzegem | 10 | $4,494 | $459.15 | 36% |
| Aubel | 26 | $4,369 | $287.67 | 47% |
| Wellin | 12 | $4,311 | $442.67 | 44% |
| Dion | 12 | $4,192 | $270.23 | 51% |
| Incourt | 14 | $4,153 | $301.79 | 48% |