San Pedro Town Airbnb Market Analysis 2026: Short Term Rental Data & Vacation Rental Statistics in Corozal District, Belize
Is Airbnb profitable in San Pedro Town in 2026? Explore comprehensive Airbnb analytics for San Pedro Town, Corozal District, Belize to uncover income potential. This 2026 STR market report for San Pedro Town, based on AirROI data from February 2025 to January 2026, reveals key trends in the market of 667 active listings.
Whether you're considering an Airbnb investment in San Pedro Town, optimizing your existing vacation rental, or exploring rental arbitrage opportunities, understanding the San Pedro Town Airbnb data is crucial. Leveraging the low regulation environment is key to maximizing your short term rental income potential. Let's dive into the specifics.
Key San Pedro Town Airbnb Performance Metrics Overview
Monthly Airbnb Revenue Variations & Income Potential in San Pedro Town (2026)
Understanding the monthly revenue variations for Airbnb listings in San Pedro Town is key to maximizing your short term rental income potential. Seasonality significantly impacts earnings. Our analysis, based on data from the past 12 months, shows that the peak revenue month for STRs in San Pedro Town is typically February, while September often presents the lowest earnings, highlighting opportunities for strategic pricing adjustments during shoulder and low seasons. Explore the typical Airbnb income in San Pedro Town across different performance tiers:
- Best-in-class properties (Top 10%) achieve $8,971+ monthly, often utilizing dynamic pricing and superior guest experiences.
- Strong performing properties (Top 25%) earn $5,204 or more, indicating effective management and desirable locations/amenities.
- Typical properties (Median) generate around $2,683 per month, representing the average market performance.
- Entry-level properties (Bottom 25%) see earnings around $1,277, often with potential for optimization.
Average Monthly Airbnb Earnings Trend in San Pedro Town
San Pedro Town Airbnb Occupancy Rate Trends (2026)
Maximize your bookings by understanding the San Pedro Town STR occupancy trends. Seasonal demand shifts significantly influence how often properties are booked. Typically, Februarysees the highest demand (peak season occupancy), while September experiences the lowest (low season). Effective strategies, like adjusting minimum stays or offering promotions, can boost occupancy during slower periods. Here's how different property tiers perform in San Pedro Town:
- Best-in-class properties (Top 10%) achieve 76%+ occupancy, indicating high desirability and potentially optimized availability.
- Strong performing properties (Top 25%) maintain 58% or higher occupancy, suggesting good market fit and guest satisfaction.
- Typical properties (Median) have an occupancy rate around 37%.
- Entry-level properties (Bottom 25%) average 20% occupancy, potentially facing higher vacancy.
Average Monthly Occupancy Rate Trend in San Pedro Town
Average Daily Rate (ADR) Airbnb Trends in San Pedro Town (2026)
Effective short term rental pricing strategy in San Pedro Town involves understanding monthly ADR fluctuations. The Average Daily Rate (ADR) for Airbnb in San Pedro Town typically peaks in February and dips lowest during October. Leveraging Airbnb dynamic pricing tools or strategies based on this seasonality can significantly boost revenue. Here's a look at the typical nightly rates achieved:
- Best-in-class properties (Top 10%) command rates of $595+ per night, often due to premium features or locations.
- Strong performing properties (Top 25%) achieve nightly rates of $381 or more.
- Typical properties (Median) charge around $241 per night.
- Entry-level properties (Bottom 25%) earn around $156 per night.
Average Daily Rate (ADR) Trend by Month in San Pedro Town
Get Live San Pedro Town Market Intelligence 👇
Explore Real-time Analytics
Airbnb Seasonality Analysis & Trends in San Pedro Town (2026)
Peak Season (February, March, April)
- Revenue averages $5,683 per month
- Occupancy rates average 53.4%
- Daily rates average $331
Shoulder Season
- Revenue averages $3,891 per month
- Occupancy maintains around 37.6%
- Daily rates hold near $315
Low Season (August, September, October)
- Revenue drops to average $2,845 per month
- Occupancy decreases to average 32.1%
- Daily rates adjust to average $286
Seasonality Insights for San Pedro Town
- The Airbnb seasonality in San Pedro Town shows highly seasonal trends requiring careful strategy. While the sections above show seasonal averages, it's also insightful to look at the extremes:
- During the high season, the absolute peak month showcases San Pedro Town's highest earning potential, with monthly revenues capable of climbing to $6,446, occupancy reaching a high of 62.3%, and ADRs peaking at $341.
- Conversely, the slowest single month of the year, typically falling within the low season, marks the market's lowest point. In this month, revenue might dip to $2,692, occupancy could drop to 30.8%, and ADRs may adjust down to $284.
- Understanding both the seasonal averages and these monthly peaks and troughs in revenue, occupancy, and ADR is crucial for maximizing your Airbnb profit potential in San Pedro Town.
Seasonal Strategies for Maximizing Profit
- Peak Season: Maximize revenue through premium pricing and potentially longer minimum stays. Ensure high availability.
- Low Season: Offer competitive pricing, special promotions (e.g., extended stay discounts), and flexible cancellation policies. Target off-season travelers like remote workers or budget-conscious guests.
- Shoulder Seasons: Implement dynamic pricing that balances peak and low rates. Target weekend travelers or specific events. Offer slightly more flexible terms than peak season.
- Regularly analyze your own performance against these San Pedro Town seasonality benchmarks and adjust your pricing and availability strategy accordingly.
Best Areas for Airbnb Investment in San Pedro Town (2026)
Exploring the top neighborhoods for short-term rentals in San Pedro Town? This section highlights key areas, outlining why they are attractive for hosts and guests, along with notable local attractions. Consider these locations based on your target guest profile and investment strategy.
| Neighborhood / Area | Why Host Here? (Target Guests & Appeal) | Key Attractions & Landmarks |
|---|---|---|
| Corozal Town | A bustling town serving as the economic center of the Corozal District. It offers a variety of amenities, shops, and services making it appealing for tourists. | Corozal Bay, Cenote Elijio Panti, Corozal Free Zone, Cultural Heritage Museum, Las Vegas Beach |
| Cerros Maya | An ancient Maya site and a national park, attract visitors interested in archaeology and history. Blessed with beautiful coastal scenery. | Cerros Mayan Ruins, Natural beaches, Birdwatching, Scenic coastlines, Snorkeling and diving spots |
| Chetumal Bay | Just a short distance away, it's a great spot for those visiting Mexico. Offers beaches and coastal activities, making it attractive for Airbnb guests. | Chetumal Beach, Museum of Mayan Culture, Chetumal Mall, Bars and waterfront restaurants, Nearby fishing spots |
| Sarteneja | A picturesque fishing village known for its laid-back atmosphere and stunning natural surroundings. Great for guests looking for tranquility away from city life. | Sarteneja Beach, Fishing activities, Coral reefs for snorkeling, Local culture experiences, Eco-tourism spots |
| Bacalar Lagoon | Known for its turquoise waters and stunning cenotes, popular for those seeking adventure and unique water activities. | Bacalar Lagoon, Cenote Azul, Kayaking and paddleboarding, Bird watching, Local dining experiences |
| San Pedro Town | The most popular destination for tourists in Belize with vibrant nightlife, shopping, and beautiful beaches. It's a prime location for investors. | Ambergris Caye beaches, Nightlife on the island, Snorkeling at Hol Chan, Barrier Reef excursions, Local artisan markets |
| Ambergris Caye | A top tourist destination known for its stunning marine life and close proximity to the Great Barrier Reef. Highly sought after by travelers. | Hol Chan Marine Reserve, Shark Ray Alley, Great Blue Hole, Beach bars and restaurants, Scuba diving and snorkeling |
| Caye Caulker | A charming, laid-back island that attracts budget travelers and those looking to enjoy a relaxed coastal atmosphere. | The Split, Snorkeling with manatees, Caye Caulker Marine Reserve, Beachfront dining and bars, Local festivals and events |
Understanding Airbnb License Requirements & STR Laws in San Pedro Town (2026)
While San Pedro Town, Corozal District, Belize currently shows low STR regulations, specific Airbnb license requirements might still exist or change. Always verify the latest short term rental regulations and Airbnb license requirements directly with local government authorities for San Pedro Town to ensure full compliance before hosting.
(Source: AirROI data, 2026, finding no licensed listings among those analyzed)
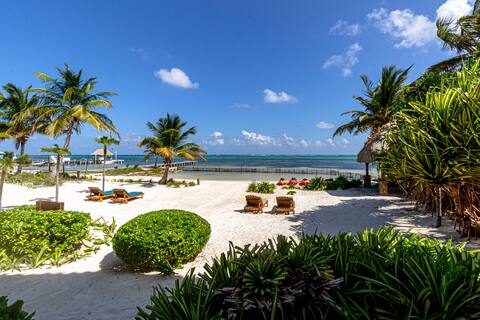
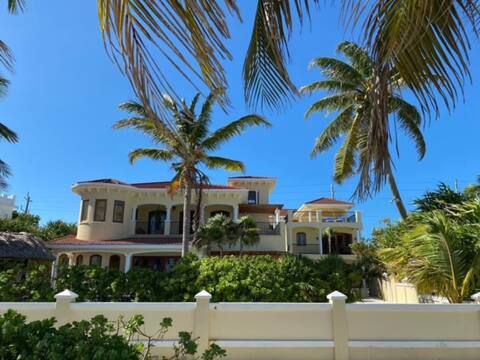
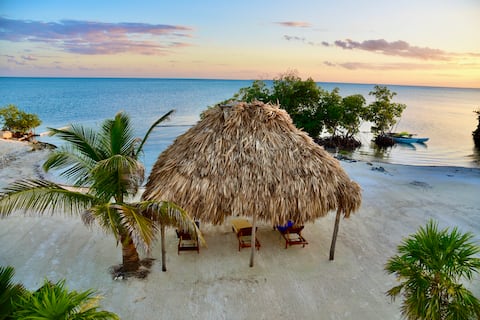
Top Performing Airbnb Properties in San Pedro Town (2026)
Benchmark your potential! Explore examples of top-performing Airbnb properties in San Pedro Townbased on Trailing Twelve Month (TTM) revenue. Analyze their characteristics, revenue, occupancy rate, and ADR to understand what drives success in this market.
Two Luxury Villas, 9 Bedrooms, Sleeps 16, 2 Pools.
Entire Place • 9 bedrooms

Oceanfront Villa w/Private Pool & Dock
Entire Place • 5 bedrooms
Adagio Villa Full Property
Entire Place • 7 bedrooms
6BR Beachfront Villa Mandevilla Pool/Wedding/Event
Entire Place • 6 bedrooms

Luxury beachfront home with pool, gym, more!
Entire Place • 4 bedrooms

Multi Room Beachfront Home
Entire Place • 8 bedrooms
Note: Performance varies based on location, size, amenities, seasonality, and management quality. Data reflects the past 12 months.
Top Performing Airbnb Hosts in San Pedro Town (2026)
Learn from the best! This table showcases top-performing Airbnb hosts in San Pedro Town based on the number of properties managed and estimated total revenue over the past year. Analyze their scale and performance metrics.
| Host Name | Properties | Grossing Revenue | Stay Reviews | Avg Rating |
|---|---|---|---|---|
| M&B Luxury Rentals | 29 | $2,906,282 | 1172 | 4.84/5.0 |
| StayFloreo | 24 | $1,310,713 | 245 | 4.79/5.0 |
| Sunrise | 24 | $1,274,262 | 289 | 4.85/5.0 |
| Barbara, Belize & Colombia | 25 | $1,175,658 | 468 | 4.92/5.0 |
| Suyas Belize Management | 22 | $1,056,757 | 436 | 4.90/5.0 |
| Nellie | 34 | $961,093 | 1776 | 4.89/5.0 |
| BelizeIt | 20 | $805,816 | 206 | 4.76/5.0 |
| Vacasa | 66 | $734,597 | 2428 | 4.58/5.0 |
| Corrina | 10 | $724,846 | 230 | 4.84/5.0 |
| Pista | 8 | $659,800 | 813 | 4.86/5.0 |
Analyzing the strategies of top hosts, such as their property selection, pricing, and guest communication, can offer valuable lessons for optimizing your own Airbnb operations in San Pedro Town.
Dive Deeper: Advanced San Pedro Town STR Market Data (2026)
Ready to unlock more insights? AirROI provides access to advanced metrics and comprehensive Airbnb data for San Pedro Town. Explore detailed analytics beyond this report to refine your investment strategy, optimize pricing, and maximize your vacation rental profits.
Explore Advanced MetricsSan Pedro Town Short-Term Rental Market Composition (2026): Property & Room Types
Room Type Distribution
Property Type Distribution
Market Composition Insights for San Pedro Town
- The San Pedro Town Airbnb market composition is heavily skewed towards Entire Home/Apt listings, which make up 85.2% of the 667 active rentals. This indicates strong guest preference for privacy and space.
- Looking at the property type distribution in San Pedro Town, Apartment/Condo properties are the most common (55.9%), reflecting the local real estate landscape.
- Houses represent a significant 31.6% portion, catering likely to families or larger groups.
- The presence of 12% Hotel/Boutique listings indicates integration with traditional hospitality.
- Smaller segments like others (combined 0.4%) offer potential for unique stay experiences.
San Pedro Town Airbnb Room Capacity Analysis (2026): Bedroom Distribution
Distribution of Listings by Number of Bedrooms
Room Capacity Insights for San Pedro Town
- The dominant room capacity in San Pedro Town is 1 bedroom listings, making up 36.9% of the market. This suggests a strong demand for properties suitable for couples or solo travelers.
- Together, 1 bedroom and 2 bedrooms properties represent 64.9% of the active Airbnb listings in San Pedro Town, indicating a high concentration in these sizes.
- A significant 31.9% of listings offer 3+ bedrooms, catering to larger groups and families seeking more space in San Pedro Town.
San Pedro Town Vacation Rental Guest Capacity Trends (2026)
Distribution of Listings by Guest Capacity
Guest Capacity Insights for San Pedro Town
- The most common guest capacity trend in San Pedro Town vacation rentals is listings accommodating 2 guests (24.4%). This suggests the primary traveler segment is likely couples or solo travelers.
- Properties designed for 2 guests and 8+ guests dominate the San Pedro Town STR market, accounting for 46.1% of listings.
- 40.1% of properties accommodate 6+ guests, serving the market segment for larger families or group travel in San Pedro Town.
- On average, properties in San Pedro Town are equipped to host 4.6 guests.
San Pedro Town Airbnb Booking Patterns (2026): Available vs. Booked Days
Available Days Distribution
Booked Days Distribution
Booking Pattern Insights for San Pedro Town
- The most common availability pattern in San Pedro Town falls within the 271-366 days range, representing 53.1% of listings. This suggests many properties have significant open periods on their calendars.
- Approximately 83.4% of listings show high availability (181+ days open annually), indicating potential for increased bookings or specific owner usage patterns.
- For booked days, the 31-90 days range is most frequent in San Pedro Town (36.9%), reflecting common guest stay durations or potential owner blocking patterns.
- A notable 18.1% of properties secure long booking periods (181+ days booked per year), highlighting successful long-term rental strategies or significant owner usage.
San Pedro Town Airbnb Minimum Stay Requirements Analysis
Distribution of Listings by Minimum Night Requirement
1 Night
98 listings
14.7% of total
2 Nights
115 listings
17.3% of total
3 Nights
137 listings
20.6% of total
4-6 Nights
38 listings
5.7% of total
30+ Nights
278 listings
41.7% of total
Key Insights
- The most prevalent minimum stay requirement in San Pedro Town is 30+ Nights, adopted by 41.7% of listings. This highlights the market's preference for longer commitments.
- A significant segment (41.7%) caters to monthly stays (30+ nights) in San Pedro Town, pointing to opportunities in the extended-stay market.
Recommendations
- Align with the market by considering a 30+ Nights minimum stay, as 41.7% of San Pedro Town hosts use this setting.
- If feasible, allowing 1-night stays, especially midweek or during low season, could capture last-minute bookings, as only 14.7% currently do.
- Explore offering discounts for stays of 30+ nights to attract the 41.7% of the market seeking extended stays.
- Adjust minimum nights based on seasonality – potentially shorter during low season and longer during peak demand periods in San Pedro Town.
San Pedro Town Airbnb Cancellation Policy Trends Analysis (2026)
Super Strict 60 Days
27 listings
4.1% of total
Limited
4 listings
0.6% of total
Super Strict 30 Days
77 listings
11.6% of total
Flexible
79 listings
11.9% of total
Moderate
126 listings
18.9% of total
Firm
293 listings
44% of total
Strict
60 listings
9% of total
Cancellation Policy Insights for San Pedro Town
- The prevailing Airbnb cancellation policy trend in San Pedro Town is Firm, used by 44% of listings.
- A majority (53.0%) of hosts in San Pedro Town utilize Firm or Strict policies, indicating a market where hosts prioritize booking security.
- Strict cancellation policies are quite rare (9%), potentially making listings with this policy less competitive unless justified by high demand or property type.
Recommendations for Hosts
- Consider adopting a Firm policy to align with the 44% market standard in San Pedro Town.
- Using a Strict policy might deter some guests, as only 9% of listings use it. Evaluate if potential revenue protection outweighs possible lower booking rates.
- Regularly review your cancellation policy against competitors and market demand shifts in San Pedro Town.
San Pedro Town STR Booking Lead Time Analysis (2026)
Average Booking Lead Time by Month
Booking Lead Time Insights for San Pedro Town
- The overall average booking lead time for vacation rentals in San Pedro Town is 76 days.
- Guests book furthest in advance for stays during January (average 110 days), likely coinciding with peak travel demand or local events.
- The shortest booking windows occur for stays in August (average 53 days), indicating more last-minute travel plans during this time.
- Seasonally, Winter (103 days avg.) sees the longest lead times, while Summer (61 days avg.) has the shortest, reflecting typical travel planning cycles.
Recommendations for Hosts
- Use the overall average lead time (76 days) as a baseline for your pricing and availability strategy in San Pedro Town.
- For January stays, consider implementing length-of-stay discounts or slightly higher rates for bookings made less than 110 days out to capitalize on advance planning.
- Target marketing efforts for the Winter season well in advance (at least 103 days) to capture early planners.
- Monitor your own booking lead times against these San Pedro Town averages to identify opportunities for dynamic pricing adjustments.
Popular & Essential Airbnb Amenities in San Pedro Town (2026)
Amenity Prevalence
Amenity Insights for San Pedro Town
- Essential amenities in San Pedro Town that guests expect include: Wifi, Air conditioning. Lacking these (any) could significantly impact bookings.
- Popular amenities like TV, Smoke alarm, Fire extinguisher are common but not universal. Offering these can provide a competitive edge.
Recommendations for Hosts
- Ensure your listing includes all essential amenities for San Pedro Town: Wifi, Air conditioning.
- Prioritize adding missing essentials: Wifi, Air conditioning.
- Consider adding popular differentiators like TV or Smoke alarm to increase appeal.
- Highlight unique or less common amenities you offer (e.g., hot tub, dedicated workspace, EV charger) in your listing description and photos.
- Regularly check competitor amenities in San Pedro Town to stay competitive.
San Pedro Town Airbnb Guest Demographics & Profile Analysis (2026)
Guest Profile Summary for San Pedro Town
- The typical guest profile for Airbnb in San Pedro Town consists of predominantly international visitors (99%), with top international origins including Canada, typically belonging to the Post-2000s (Gen Z/Alpha) group (50%), primarily speaking English or Spanish.
- Domestic travelers account for 0.6% of guests.
- Key international markets include United States (81.9%) and Canada (9.5%).
- Top languages spoken are English (71%) followed by Spanish (16.5%).
- A significant demographic segment is the Post-2000s (Gen Z/Alpha) group, representing 50% of guests.
Recommendations for Hosts
- Focus marketing internationally, particularly towards travelers from Canada.
- Tailor amenities and listing descriptions to appeal to the dominant Post-2000s (Gen Z/Alpha) demographic (e.g., highlight fast WiFi, smart home features, local guides).
- Highlight unique local experiences or amenities relevant to the primary guest profile.
- Consider seasonal promotions aligned with peak travel times for key origin markets.
Nearby Short-Term Rental Market Comparison
How does the San Pedro Town Airbnb market stack up against its neighbors? Compare key performance metrics like average monthly revenue, ADR, and occupancy rates in surrounding areas to understand the broader regional STR landscape.
| Market | Active Properties | Monthly Revenue | Daily Rate | Avg. Occupancy |
|---|---|---|---|---|
| Maya Beach | 76 | $4,346 | $421.40 | 38% |
| Seine Bight | 26 | $3,700 | $413.82 | 38% |
| Caribbean Way | 26 | $3,083 | $361.55 | 37% |
| Kate Subdivision | 13 | $2,924 | $346.23 | 37% |
| San Pedro | 44 | $2,911 | $402.68 | 33% |
| Hopkins Village | 67 | $2,814 | $300.89 | 35% |
| San Pedro | 94 | $2,209 | $282.54 | 36% |
| Placencia | 297 | $2,167 | $296.42 | 34% |
| West Bay | 42 | $2,130 | $374.23 | 31% |
| Caye Caulker Village | 356 | $1,975 | $173.01 | 42% |