Whydah Airbnb Market Analysis 2026: Short Term Rental Data & Vacation Rental Statistics in Atlantique Department, Benin
Is Airbnb profitable in Whydah in 2026? Explore comprehensive Airbnb analytics for Whydah, Atlantique Department, Benin to uncover income potential. This 2026 STR market report for Whydah, based on AirROI data from February 2025 to January 2026, reveals key trends in the niche market of 18 active listings.
Whether you're considering an Airbnb investment in Whydah, optimizing your existing vacation rental, or exploring rental arbitrage opportunities, understanding the Whydah Airbnb data is crucial. Leveraging the low regulation environment is key to maximizing your short term rental income potential. Let's dive into the specifics.
Key Whydah Airbnb Performance Metrics Overview
Monthly Airbnb Revenue Variations & Income Potential in Whydah (2026)
Understanding the monthly revenue variations for Airbnb listings in Whydah is key to maximizing your short term rental income potential. Seasonality significantly impacts earnings. Our analysis, based on data from the past 12 months, shows that the peak revenue month for STRs in Whydah is typically December, while January often presents the lowest earnings, highlighting opportunities for strategic pricing adjustments during shoulder and low seasons. Explore the typical Airbnb income in Whydah across different performance tiers:
- Best-in-class properties (Top 10%) achieve $1,756+ monthly, often utilizing dynamic pricing and superior guest experiences.
- Strong performing properties (Top 25%) earn $346 or more, indicating effective management and desirable locations/amenities.
- Typical properties (Median) generate around $139 per month, representing the average market performance.
- Entry-level properties (Bottom 25%) see earnings around $65, often with potential for optimization.
Average Monthly Airbnb Earnings Trend in Whydah
Whydah Airbnb Occupancy Rate Trends (2026)
Maximize your bookings by understanding the Whydah STR occupancy trends. Seasonal demand shifts significantly influence how often properties are booked. Typically, Februarysees the highest demand (peak season occupancy), while March experiences the lowest (low season). Effective strategies, like adjusting minimum stays or offering promotions, can boost occupancy during slower periods. Here's how different property tiers perform in Whydah:
- Best-in-class properties (Top 10%) achieve 48%+ occupancy, indicating high desirability and potentially optimized availability.
- Strong performing properties (Top 25%) maintain 22% or higher occupancy, suggesting good market fit and guest satisfaction.
- Typical properties (Median) have an occupancy rate around 13%.
- Entry-level properties (Bottom 25%) average 8% occupancy, potentially facing higher vacancy.
Average Monthly Occupancy Rate Trend in Whydah
Average Daily Rate (ADR) Airbnb Trends in Whydah (2026)
Effective short term rental pricing strategy in Whydah involves understanding monthly ADR fluctuations. The Average Daily Rate (ADR) for Airbnb in Whydah typically peaks in September and dips lowest during February. Leveraging Airbnb dynamic pricing tools or strategies based on this seasonality can significantly boost revenue. Here's a look at the typical nightly rates achieved:
- Best-in-class properties (Top 10%) command rates of $122+ per night, often due to premium features or locations.
- Strong performing properties (Top 25%) achieve nightly rates of $79 or more.
- Typical properties (Median) charge around $29 per night.
- Entry-level properties (Bottom 25%) earn around $22 per night.
Average Daily Rate (ADR) Trend by Month in Whydah
Get Live Whydah Market Intelligence 👇

Explore Real-time Analytics
Airbnb Seasonality Analysis & Trends in Whydah (2026)
Peak Season (December, August, February)
- Revenue averages $777 per month
- Occupancy rates average 24.3%
- Daily rates average $66
Shoulder Season
- Revenue averages $360 per month
- Occupancy maintains around 18.6%
- Daily rates hold near $66
Low Season (January, April, September)
- Revenue drops to average $280 per month
- Occupancy decreases to average 16.6%
- Daily rates adjust to average $69
Seasonality Insights for Whydah
- The Airbnb seasonality in Whydah shows highly seasonal trends requiring careful strategy. While the sections above show seasonal averages, it's also insightful to look at the extremes:
- During the high season, the absolute peak month showcases Whydah's highest earning potential, with monthly revenues capable of climbing to $1,026, occupancy reaching a high of 29.8%, and ADRs peaking at $72.
- Conversely, the slowest single month of the year, typically falling within the low season, marks the market's lowest point. In this month, revenue might dip to $255, occupancy could drop to 12.2%, and ADRs may adjust down to $63.
- Understanding both the seasonal averages and these monthly peaks and troughs in revenue, occupancy, and ADR is crucial for maximizing your Airbnb profit potential in Whydah.
Seasonal Strategies for Maximizing Profit
- Peak Season: Maximize revenue through premium pricing and potentially longer minimum stays. Ensure high availability.
- Low Season: Offer competitive pricing, special promotions (e.g., extended stay discounts), and flexible cancellation policies. Target off-season travelers like remote workers or budget-conscious guests.
- Shoulder Seasons: Implement dynamic pricing that balances peak and low rates. Target weekend travelers or specific events. Offer slightly more flexible terms than peak season.
- Regularly analyze your own performance against these Whydah seasonality benchmarks and adjust your pricing and availability strategy accordingly.
Best Areas for Airbnb Investment in Whydah (2026)
Exploring the top neighborhoods for short-term rentals in Whydah? This section highlights key areas, outlining why they are attractive for hosts and guests, along with notable local attractions. Consider these locations based on your target guest profile and investment strategy.
| Neighborhood / Area | Why Host Here? (Target Guests & Appeal) | Key Attractions & Landmarks |
|---|---|---|
| Plage de Whydah | A popular beach destination known for its golden sands and vibrant atmosphere. Ideal for tourists looking to enjoy beach activities, local food, and a lively social scene. | Whydah Museum, Beachfront restaurants, Water sports activities, Local markets, Cultural festivals |
| Centre Ville | The bustling city center filled with shops, markets, and cafes. Great for tourists wanting to experience the local culture and lifestyle of Whydah. | Grand Marché de Whydah, Cultural Heritage Sites, Historic buildings, Local eateries, Street vendors |
| Les Cocotiers | A serene area featuring coconut palms and resorts. Perfect for guests looking for a relaxing getaway with beautiful views and peaceful surroundings. | Coconut groves, Quiet beaches, Wellness resorts, Nature walks, Sunset views |
| Bénin Marina | A modern marina area attracting visitors who enjoy boating and luxurious waterfront experiences. A great spot for upscale Airbnb offerings near the water. | Yachting activities, Waterfront restaurants, Boat tours, Fishing expeditions, Scenic views |
| Cotonou Beach | Nearby area that enhances Whydah's appeal with its expansive beaches and entertainment options. Attracts both tourists and locals for weekend getaways. | Cotonou markets, Artisan villages, Live music venues, Local crafts, Food stalls |
| Sable d'Or | A premium beach area known for its exquisite sand and upscale accommodations. Ideal for visitors looking for luxury and comfort while enjoying beach life. | Luxury resorts, Beach clubs, Surfing spots, Spas, Fine dining options |
| Avenue de l'Indépendance | A key street in Whydah lined with hotels, restaurants, and shops. Convenient for tourists and business travelers wanting to be in the heart of the action. | Shopping centers, Business hubs, Local cuisine, Nightlife, Cultural events |
| La Plage de Croix | A tranquil beach offering opportunities for relaxation and recreation. This area appeals to families and those looking for a peaceful retreat. | Family-friendly beaches, Picnic areas, Water activities, Nature reserves, Scenic walking paths |
Understanding Airbnb License Requirements & STR Laws in Whydah (2026)
While Whydah, Atlantique Department, Benin currently shows low STR regulations, specific Airbnb license requirements might still exist or change. Always verify the latest short term rental regulations and Airbnb license requirements directly with local government authorities for Whydah to ensure full compliance before hosting.
(Source: AirROI data, 2026, finding no licensed listings among those analyzed)
Top Performing Airbnb Properties in Whydah (2026)
Benchmark your potential! Explore examples of top-performing Airbnb properties in Whydahbased on Trailing Twelve Month (TTM) revenue. Analyze their characteristics, revenue, occupancy rate, and ADR to understand what drives success in this market.
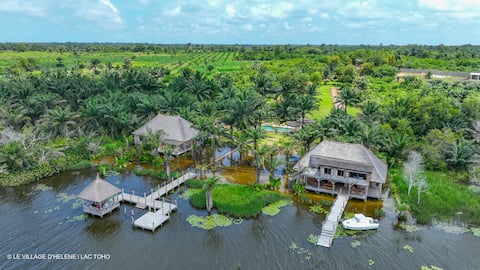
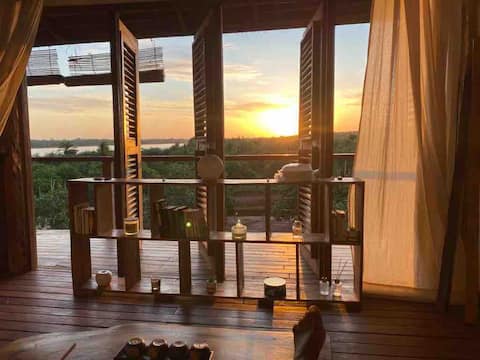
Lodge Oshun, Hélène's Village
Entire Place • 2 bedrooms
Lodge Rosa Madeira in the middle of the orange grove
Entire Place • 3 bedrooms

Maisonfleurie Furnished apartment in the heart of Ouida
Entire Place • 1 bedroom

Comfortable room + Wi-Fi in the heart of Ouidah
Private Room • N/A

Beautiful residence in Ouidah (BENIN)
Entire Place • 3 bedrooms
Fruity stay: 2 bedrooms + wifi + solar
Entire Place • 2 bedrooms

L'Air de Rien Calm, good mood in Ouidah!
Private Room • 3 bedrooms
Note: Performance varies based on location, size, amenities, seasonality, and management quality. Data reflects the past 12 months.
Top Performing Airbnb Hosts in Whydah (2026)
Learn from the best! This table showcases top-performing Airbnb hosts in Whydah based on the number of properties managed and estimated total revenue over the past year. Analyze their scale and performance metrics.
| Host Name | Properties | Grossing Revenue | Stay Reviews | Avg Rating |
|---|---|---|---|---|
| Gillus | 1 | $20,260 | 3 | 5.00/5.0 |
| Layo Primaël | 4 | $6,759 | 87 | 4.89/5.0 |
| Anita | 1 | $4,904 | 8 | 4.50/5.0 |
| Regine | 2 | $1,902 | 20 | 4.94/5.0 |
| Oladjide | 1 | $1,133 | 5 | 5.00/5.0 |
| Lynda | 1 | $1,025 | 17 | 4.76/5.0 |
| Pamphile | 1 | $644 | 10 | 4.90/5.0 |
| Lucia | 1 | $643 | 2 | Not Rated |
| Nadine | 1 | $493 | 4 | 4.75/5.0 |
| Cica Mathilda | 1 | $424 | 1 | Not Rated |
Analyzing the strategies of top hosts, such as their property selection, pricing, and guest communication, can offer valuable lessons for optimizing your own Airbnb operations in Whydah.
Dive Deeper: Advanced Whydah STR Market Data (2026)
Ready to unlock more insights? AirROI provides access to advanced metrics and comprehensive Airbnb data for Whydah. Explore detailed analytics beyond this report to refine your investment strategy, optimize pricing, and maximize your vacation rental profits.
Explore Advanced MetricsWhydah Short-Term Rental Market Composition (2026): Property & Room Types
Room Type Distribution
Property Type Distribution
Market Composition Insights for Whydah
- The Whydah Airbnb market composition is heavily skewed towards Private Room listings, which make up 50% of the 18 active rentals. This indicates strong guest preference for privacy and space.
- Looking at the property type distribution in Whydah, Hotel/Boutique properties are the most common (33.3%), reflecting the local real estate landscape.
- Houses represent a significant 27.8% portion, catering likely to families or larger groups.
- The presence of 33.3% Hotel/Boutique listings indicates integration with traditional hospitality.
Whydah Airbnb Room Capacity Analysis (2026): Bedroom Distribution
Distribution of Listings by Number of Bedrooms
Room Capacity Insights for Whydah
- The dominant room capacity in Whydah is 3 bedrooms listings, making up 22.2% of the market. This suggests a strong demand for properties suitable for families or small groups.
- Together, 3 bedrooms and 2 bedrooms properties represent 44.4% of the active Airbnb listings in Whydah, indicating a high concentration in these sizes.
- A significant 27.8% of listings offer 3+ bedrooms, catering to larger groups and families seeking more space in Whydah.
Whydah Vacation Rental Guest Capacity Trends (2026)
Distribution of Listings by Guest Capacity
Guest Capacity Insights for Whydah
- The most common guest capacity trend in Whydah vacation rentals is listings accommodating 4 guests (22.2%). This suggests the primary traveler segment is likely small families or groups.
- Properties designed for 4 guests and 2 guests dominate the Whydah STR market, accounting for 38.9% of listings.
- 16.7% of properties accommodate 6+ guests, serving the market segment for larger families or group travel in Whydah.
- On average, properties in Whydah are equipped to host 2.4 guests.
Whydah Airbnb Booking Patterns (2026): Available vs. Booked Days
Available Days Distribution
Booked Days Distribution
Booking Pattern Insights for Whydah
- The most common availability pattern in Whydah falls within the 271-366 days range, representing 94.4% of listings. This suggests many properties have significant open periods on their calendars.
- Approximately 100.0% of listings show high availability (181+ days open annually), indicating potential for increased bookings or specific owner usage patterns.
- For booked days, the 1-30 days range is most frequent in Whydah (61.1%), reflecting common guest stay durations or potential owner blocking patterns.
Whydah Airbnb Minimum Stay Requirements Analysis
Distribution of Listings by Minimum Night Requirement
1 Night
13 listings
72.2% of total
2 Nights
4 listings
22.2% of total
30+ Nights
1 listings
5.6% of total
Key Insights
- The most prevalent minimum stay requirement in Whydah is 1 Night, adopted by 72.2% of listings. This highlights the market's preference for shorter, flexible bookings.
- A strong majority (94.4%) of the Whydah Airbnb data shows acceptance of very short stays (1-2 nights), indicating a dynamic, high-turnover market.
Recommendations
- Align with the market by considering a 1 Night minimum stay, as 72.2% of Whydah hosts use this setting.
- Explore offering discounts for stays of 30+ nights to attract the 5.6% of the market seeking extended stays.
- Adjust minimum nights based on seasonality – potentially shorter during low season and longer during peak demand periods in Whydah.
Whydah Airbnb Cancellation Policy Trends Analysis (2026)
Flexible
12 listings
66.7% of total
Moderate
4 listings
22.2% of total
Firm
2 listings
11.1% of total
Cancellation Policy Insights for Whydah
- The prevailing Airbnb cancellation policy trend in Whydah is Flexible, used by 66.7% of listings.
- The market strongly favors guest-friendly terms, with 88.9% of listings offering Flexible or Moderate policies. This suggests guests in Whydah may expect booking flexibility.
Recommendations for Hosts
- Consider adopting a Flexible policy to align with the 66.7% market standard in Whydah.
- Given the high prevalence of Flexible policies (66.7%), offering this can enhance booking appeal, especially during shoulder seasons.
- Regularly review your cancellation policy against competitors and market demand shifts in Whydah.
Whydah STR Booking Lead Time Analysis (2026)
Average Booking Lead Time by Month
Booking Lead Time Insights for Whydah
- The overall average booking lead time for vacation rentals in Whydah is 55 days.
- Guests book furthest in advance for stays during January (average 103 days), likely coinciding with peak travel demand or local events.
- The shortest booking windows occur for stays in August (average 8 days), indicating more last-minute travel plans during this time.
- Seasonally, Winter (51 days avg.) sees the longest lead times, while Spring (14 days avg.) has the shortest, reflecting typical travel planning cycles.
Recommendations for Hosts
- Use the overall average lead time (55 days) as a baseline for your pricing and availability strategy in Whydah.
- For January stays, consider implementing length-of-stay discounts or slightly higher rates for bookings made less than 103 days out to capitalize on advance planning.
- During August, focus on last-minute booking availability and promotions, as guests book with very short notice (8 days avg.).
- Target marketing efforts for the Winter season well in advance (at least 51 days) to capture early planners.
- Monitor your own booking lead times against these Whydah averages to identify opportunities for dynamic pricing adjustments.
Popular & Essential Airbnb Amenities in Whydah (2026)
Amenity Prevalence
Amenity Insights for Whydah
- Popular amenities like Free parking on premises, Wifi, Bed linens are common but not universal. Offering these can provide a competitive edge.
- Warning: Wifi is not universally provided but is considered essential globally. Ensure reliable Wifi is offered.
Recommendations for Hosts
- Consider adding popular differentiators like Free parking on premises or Wifi to increase appeal.
- Highlight unique or less common amenities you offer (e.g., hot tub, dedicated workspace, EV charger) in your listing description and photos.
- Regularly check competitor amenities in Whydah to stay competitive.
Whydah Airbnb Guest Demographics & Profile Analysis (2026)
Guest Profile Summary for Whydah
- The typical guest profile for Airbnb in Whydah consists of predominantly international visitors (100%), with top international origins including United States, typically belonging to the Post-2000s (Gen Z/Alpha) group (50%), primarily speaking English or French.
- Domestic travelers account for 0.0% of guests.
- Key international markets include France (50%) and United States (15.4%).
- Top languages spoken are English (38.5%) followed by French (33.3%).
- A significant demographic segment is the Post-2000s (Gen Z/Alpha) group, representing 50% of guests.
Recommendations for Hosts
- Focus marketing internationally, particularly towards travelers from United States.
- Tailor amenities and listing descriptions to appeal to the dominant Post-2000s (Gen Z/Alpha) demographic (e.g., highlight fast WiFi, smart home features, local guides).
- Highlight unique local experiences or amenities relevant to the primary guest profile.
- Consider seasonal promotions aligned with peak travel times for key origin markets.
Nearby Short-Term Rental Market Comparison
How does the Whydah Airbnb market stack up against its neighbors? Compare key performance metrics like average monthly revenue, ADR, and occupancy rates in surrounding areas to understand the broader regional STR landscape.
| Market | Active Properties | Monthly Revenue | Daily Rate | Avg. Occupancy |
|---|---|---|---|---|
| Ibeju | 16 | $1,061 | $108.42 | 37% |
| Eko Atlantic | 10 | $914 | $227.86 | 20% |
| Falomo | 97 | $713 | $157.78 | 30% |
| Ebute-Metta | 19 | $709 | $56.74 | 46% |
| Moba | 155 | $573 | $110.35 | 30% |
| Ajah | 10 | $511 | $99.79 | 28% |
| Ikate | 120 | $478 | $102.32 | 29% |
| Itirin | 97 | $464 | $110.21 | 30% |
| Ikeja | 182 | $450 | $73.45 | 30% |
| Djako Daho | 47 | $420 | $56.59 | 38% |